Rio Grande Valley Economic Indicators

Third quarter 2024
| Rio Grande Valley economy dashboard (September 2024) | ||||
| Job growth (annualized) June–Sept. '24 |
Unemployment rate |
Avg. hourly earnings |
Avg. hourly earnings growth y/y |
|
| Rio Grande Valley | 4.2% | 5.8% | $21.38 | 7.9% |
| Brownsville | 5.4% | 5.4% | $21.01 | 18.8% |
| McAllen | 3.6% | 6.0% | $21.55 | 3.4% |
The Rio Grande Valley saw solid and broad-based employment growth in the third quarter. Unemployment was relatively flat, and wages rose at a rapid clip. Overall trade volumes were stable year over year in September. Water storage in Rio Grande Valley reservoirs remained well below historical levels and was little changed in early November.
Labor market
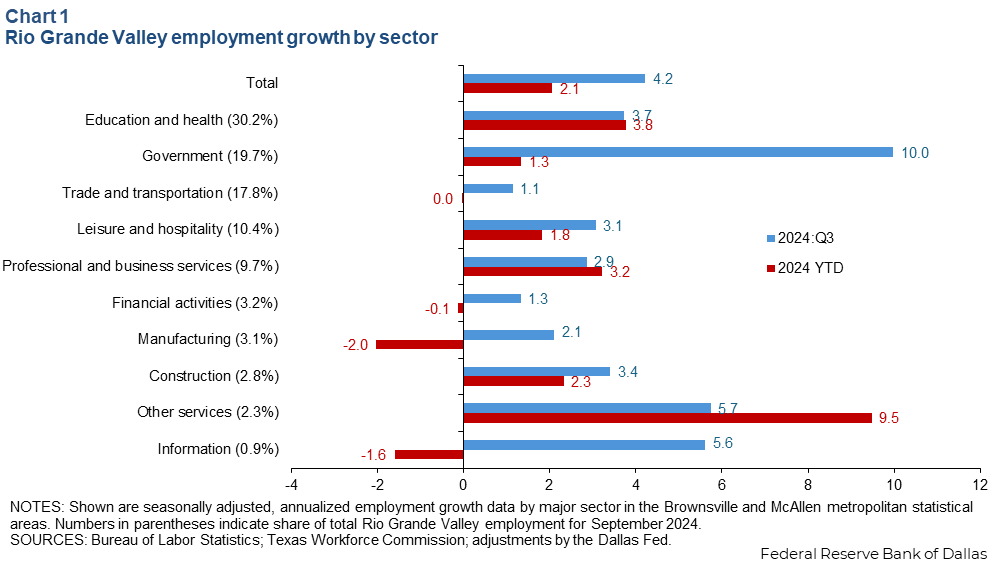
Employment growth strengthens
Rio Grande Valley jobs increased an annualized 4.2 percent in the third quarter (4,800 jobs) (Chart 1). While all sectors expanded, job gains were driven mainly by government (2,200 jobs), education and health (1,300 jobs), and leisure and hospitality (370 jobs). Year-to-date employment grew 2.1 percent annualized in the Rio Grande Valley, slower than Texas (2.3 percent) but faster than the U.S. (1.3 percent).
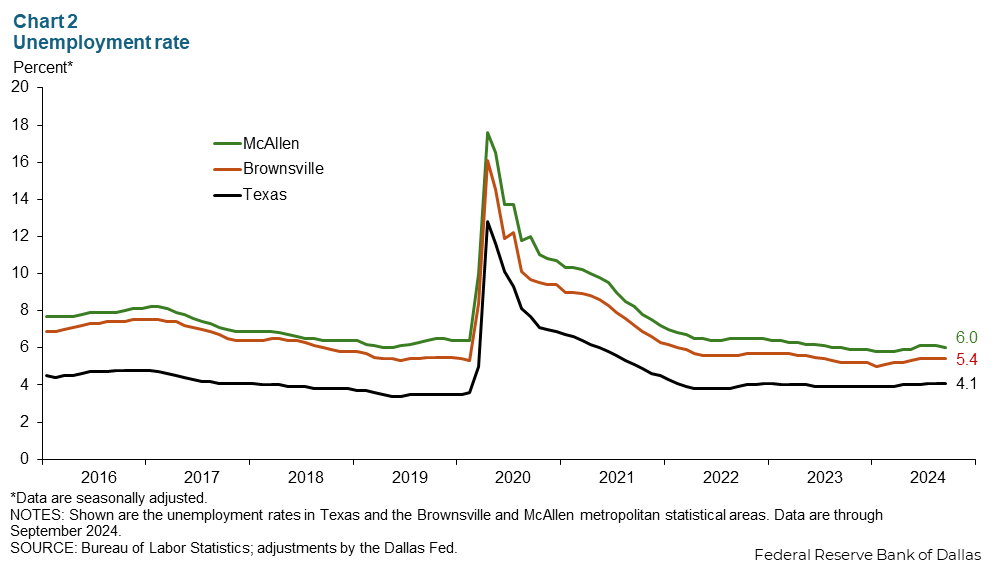
Unemployment little changed
The unemployment rate in McAllen ticked down to 6.0 percent in September but held steady in Brownsville for the fourth straight month at 5.4 percent (Chart 2). Unemployment rates in both metro areas are higher than the 4.1 percent jobless rate in both Texas and the U.S., but the gap has narrowed since the pandemic.
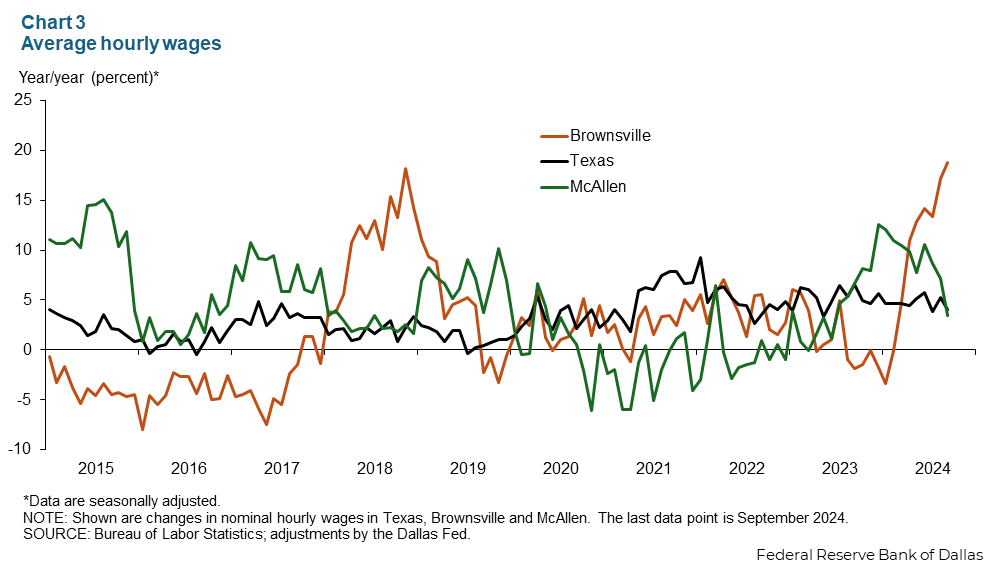
Wages increase sharply in Brownsville
Private sector hourly wages in Brownsville continued to rise steeply, up 18.8 percent year over year, in part reflecting faster employment growth in some high-paying sectors (Chart 3). Wage growth in McAllen has slowed this year but, at $21.55 per hour, wages are still up 3.4 percent year over year. Wages rose 4.1 percent in Texas.
Water availability
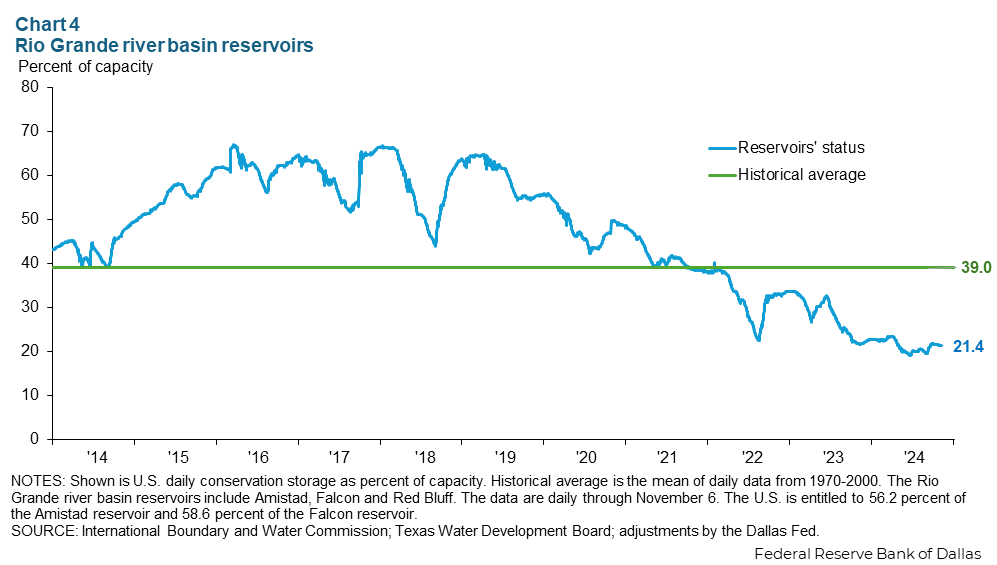
Water supply near historic low
Rio Grande farmers and households alike depend on river water. Water levels in Rio Grande Valley reservoirs held steady at 21 percent of storage capacity in early November but remained 53.1 percentage points below the historical average (Chart 4). According to the International Boundary and Water Commission, multiple factors have contributed to the low storage volume including drought, slower upstream flows into the Rio Grande’s top reservoir, and delays in Mexico’s treaty-established schedule for water deliveries to the U.S. from their Rio Grande tributaries.
Trade
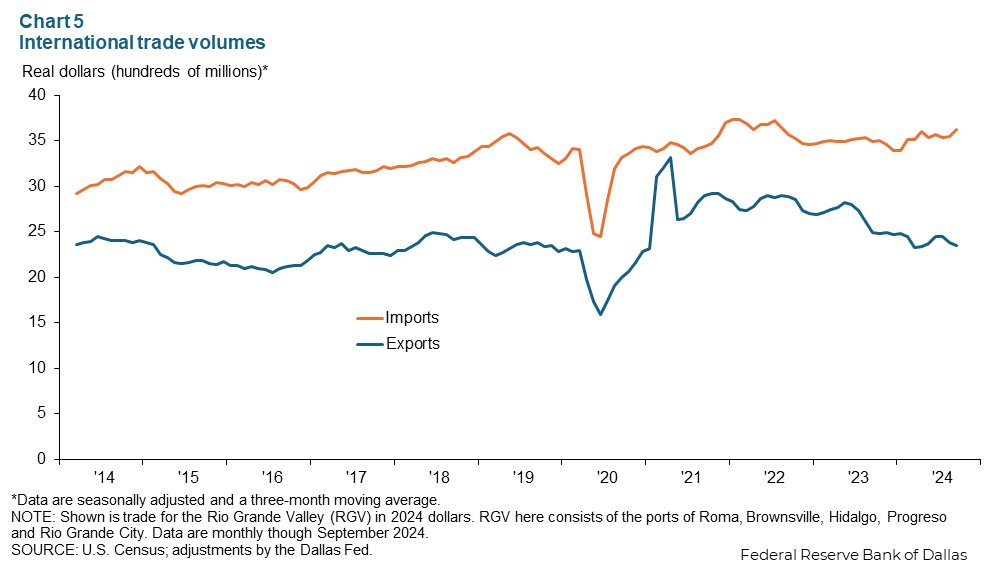
International trade moves sideways
The three-month moving average of real exports through the Rio Grande Valley fell 5.9 percent year over year in September, while imports grew 3.6 percent (Chart 5). In Texas, both exports and imports grew in September, with the three-month moving average of exports rising 1.2 percent, and imports increasing 3.6 percent. Trade through RGV makes up 1.3 percent of overall U.S. trade. Top exports through this area are oil and machinery, while top imports are machinery and fruit.
UPDATE 5/2/2025: Historical water level data was corrected in Chart 4 and the text immediately preceding it. The same data also was updated in the fourth quarter 2024 Rio Grande Valley Economic Indictors, and data about historical water storage levels in Rio Grande Valley reservoirs was corrected in Chart 3 and the text immediately preceding it in this article.
NOTES: Employment data are for the McAllen–Edinburg–Mission and Brownsville–Harlingen metropolitan statistical areas (Cameron and Hidalgo counties), unless otherwise specified. Data may not match previously published numbers due to revisions
About Rio Grande Valley Economic Indicators
Questions or suggestions can be addressed to Ethan Dixon at Ethan.Dixon@dal.frb.org. Rio Grande Valley Indicators is published quarterly.