Texas Economic Indicators

September 21, 2022
The Texas economy slowed in August. Employment was flat, and unemployment ticked up. Growth in the Texas Business-Cycle Index softened but remained above the 2000–21 average. The August Texas Business Outlook Surveys indicated that price pressures moderated. Oil and natural gas prices as well as the Texas rig count fell in early September. Serious consumer loan delinquencies in Texas broadly declined in the second quarter.
Labor market
Employment flat
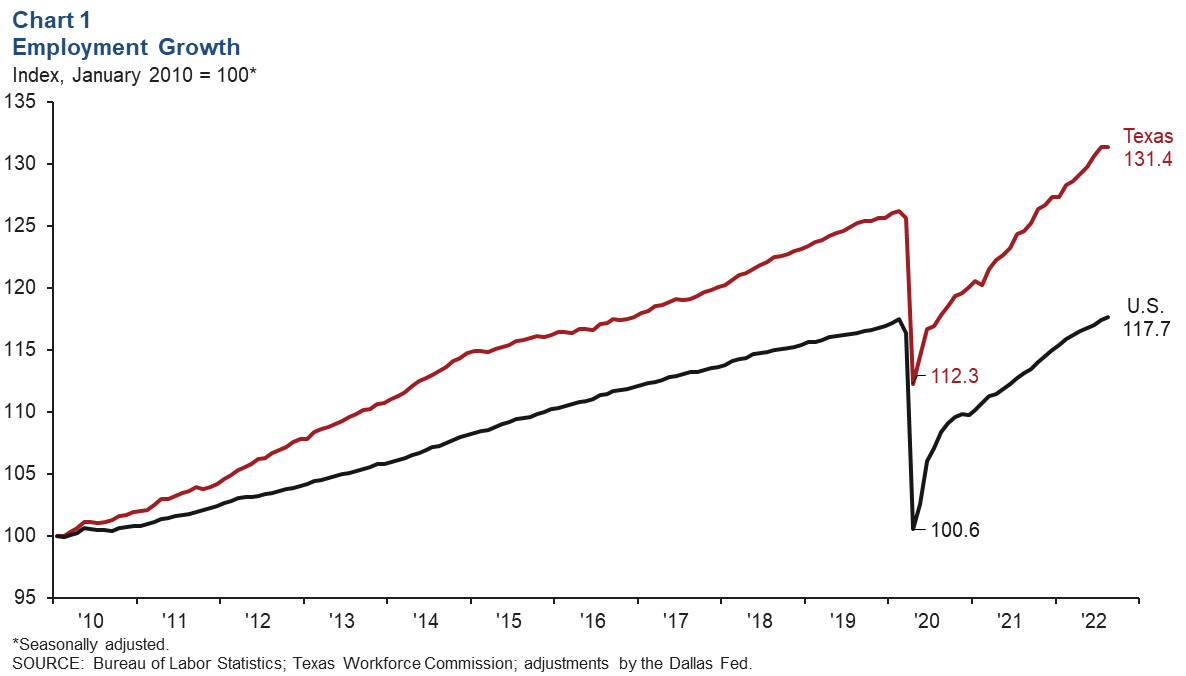
Texas employment held steady in August after growing an upwardly revised 7.6 percent in July, while U.S. jobs grew an annualized 2.5 percent (Chart 1). State job gains were mixed across major sectors, with oil and gas outperforming other sectors and information seeing the largest decline. Through August, payrolls have increased an annualized 4.9 percent in Texas and 3.5 percent in the nation. The Dallas Fed’s Texas Employment Forecast predicts 4.2 percent job growth this year, down from last month’s 5.2 percent estimate (December/December). The Texas unemployment rate ticked up to 4.1 percent in August.
Trade, transportation and utilities job growth slips
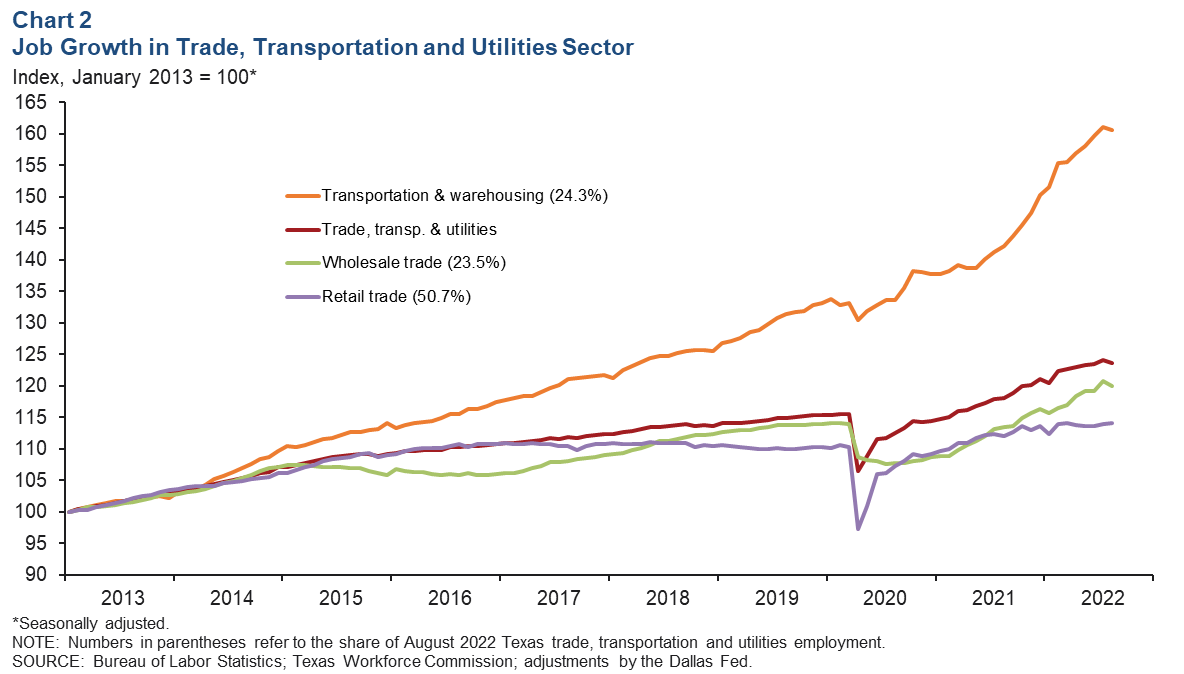
Employment fell in Texas’ trade, transportation and utilities sector in August (Chart 2). Retail trade was the only subsector that saw an increase, adding 2,140 positions. The wholesale trade subsector posted the largest decline at an annualized 9.9 percent, or a loss of 3,790 jobs. Employment in transportation and warehousing fell an annualized 3.5 percent, down 1,950 jobs. So far this year, gains in the trade, transportation and utilities sector have been solid at an annualized 3.2 percent, with transportation and warehousing seeing the strongest increase (10.5 percent) due to expansion in e-commerce and logistics activity.
Business-cycle index
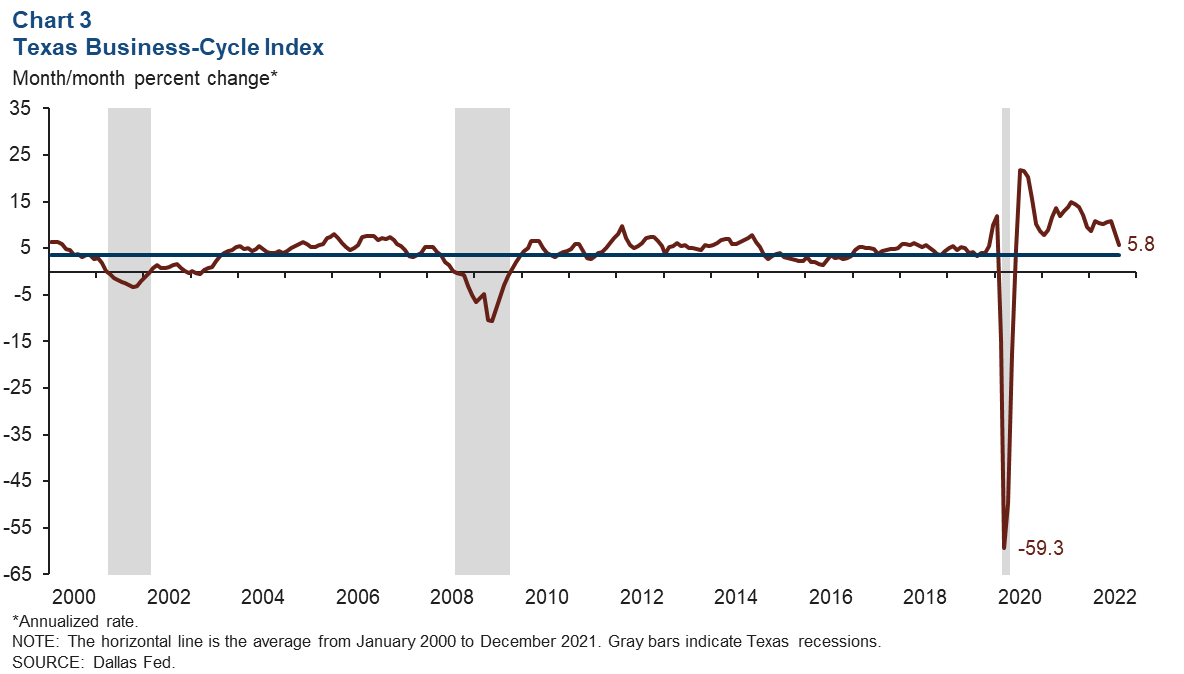
The Texas Business-Cycle Index—a composite of the unemployment rate, state payroll employment and gross state product—reflects underlying economic activity in the state. In August, the index grew at an above-average annualized pace of 5.8 percent (Chart 3). While growth in the index was robust, it was slower than July’s 8.3 percent increase.
Texas Business Outlook Surveys
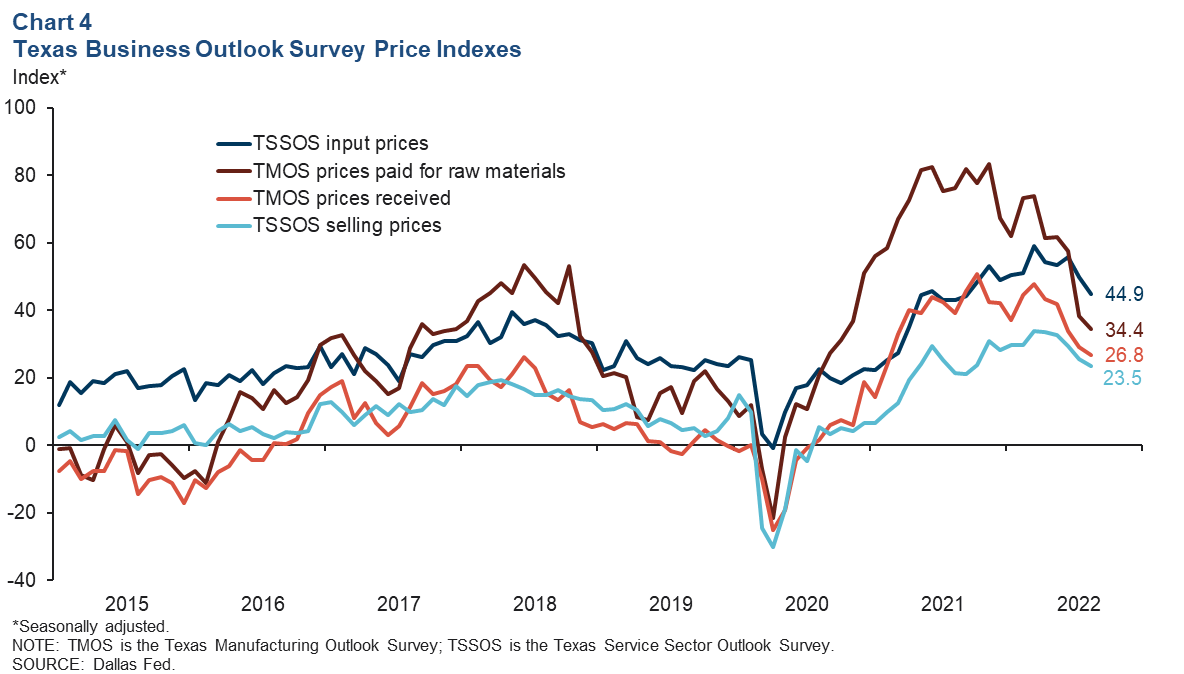
The Texas Business Outlook Surveys’ price indexes dipped but remained positive in August, suggesting that the pace of increases is slowing, though prices remain elevated (Chart 4). The manufacturing survey’s index for raw materials prices eased for the fifth month in a row, to 34.4 in August, while the prices received index dipped from 29.3 to 26.8. The service sector input prices index fell from 49.9 to 44.9, and the service sector selling price index slipped from 25.7 to 23.5. Texas business executives’ outlook for prices six months ahead in the manufacturing and service sectors moderated as well.
Energy
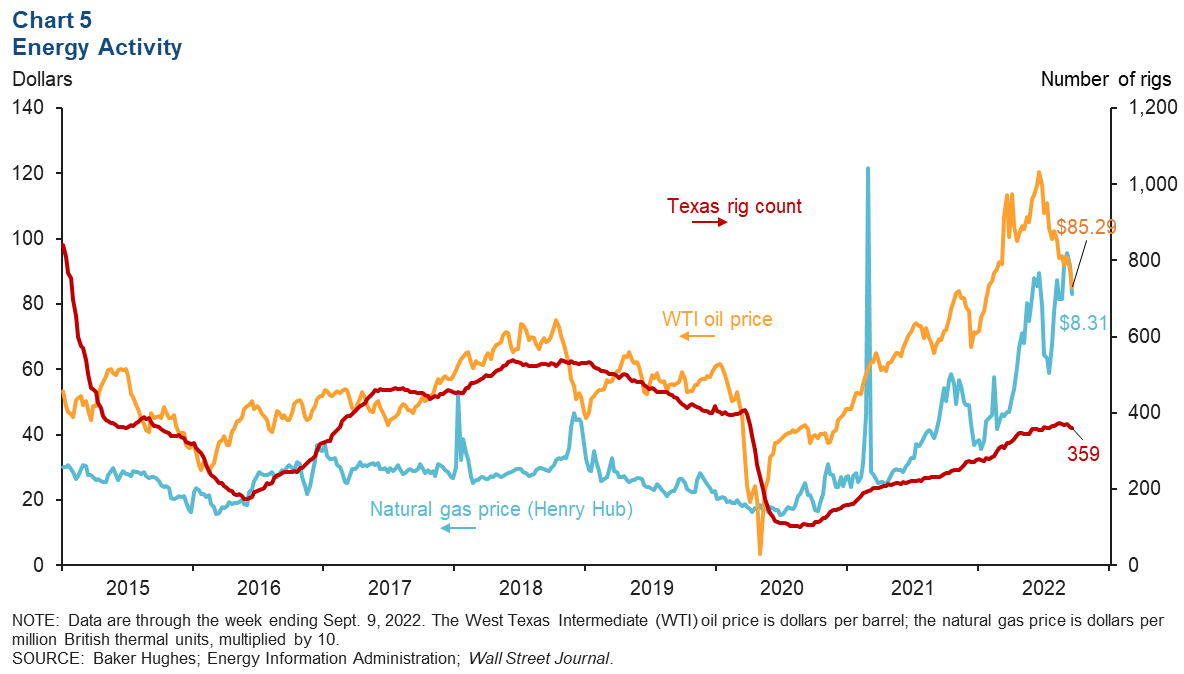
Oil prices have fallen and are well below the average year-end price forecast reported in the second-quarter Dallas Fed Energy Survey (Chart 5). As of the week ending Sept. 9, the price of West Texas Intermediate crude was $85.29 per barrel, a decrease of $5.50 from the previous week. Natural gas (Henry Hub) dipped 86 cents to $8.31 per million British thermal units. The number of active rigs in Texas dropped from 362 to 359 over the same period and remained below prepandemic levels.
Serious delinquencies
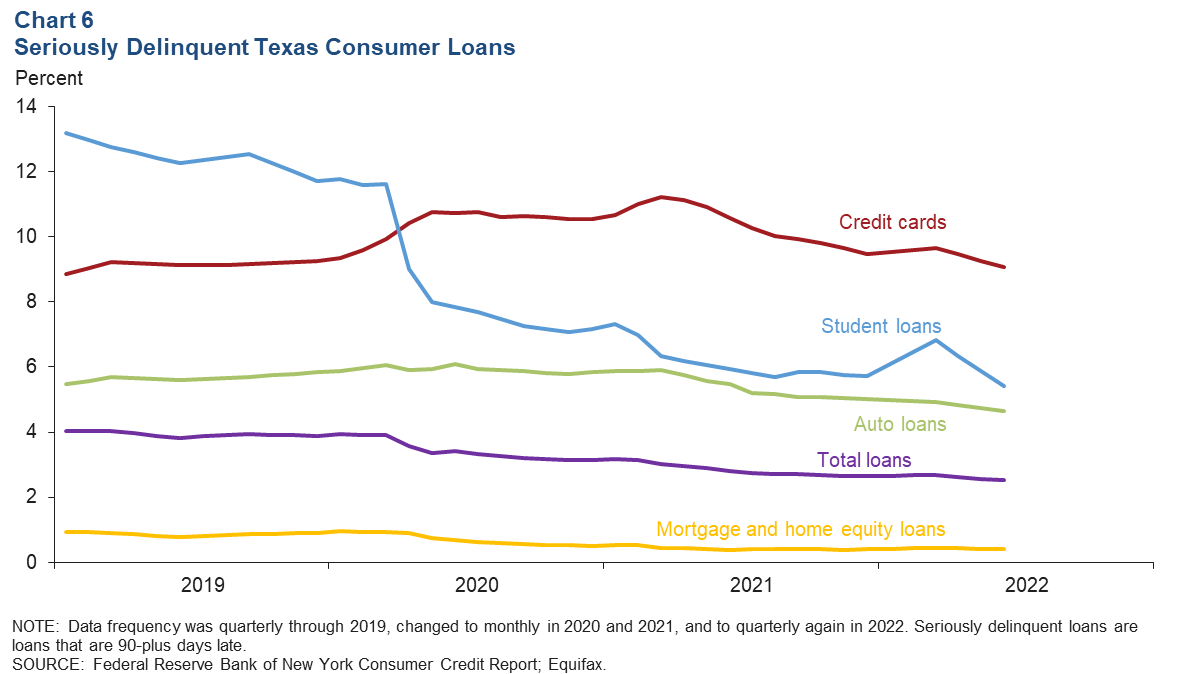
Overall serious delinquency rates for consumer loans in Texas fell slightly in second quarter 2022 (Chart 6). Student loan delinquency rates had the largest decline among the four consumer loan types, falling 1.4 percentage points to 5.4 percent. Delinquencies for mortgage and home-equity loans dipped to 0.4 percent. Auto loan and credit card delinquencies decreased to 4.7 percent and 9.1 percent, respectively. Second-quarter delinquency rates for all four consumer loan types remained below prepandemic levels (February 2020).
NOTE: Data may not match previously published numbers due to revisions.
About Texas Economic Indicators
Questions can be addressed to Mytiah Caldwell at Mytiah.Caldwell@dal.frb.org. Texas Economic Indicators is published every month during the week after state and metro employment data are released.