Dallas Fed Energy Survey

Oil and Gas Activity Jumps; Costs Escalate, Supply-Chain Delays Worsen
Special questions this quarter consider the impact of supply-chain issues and the ability to acquire inputs. Other questions ask about reasons for uncertainty in firm outlooks, expectations for U.S. crude oil production growth this year, expectations of the time needed to drill and complete an additional well, and whether firms plan to target wells with higher natural gas content.
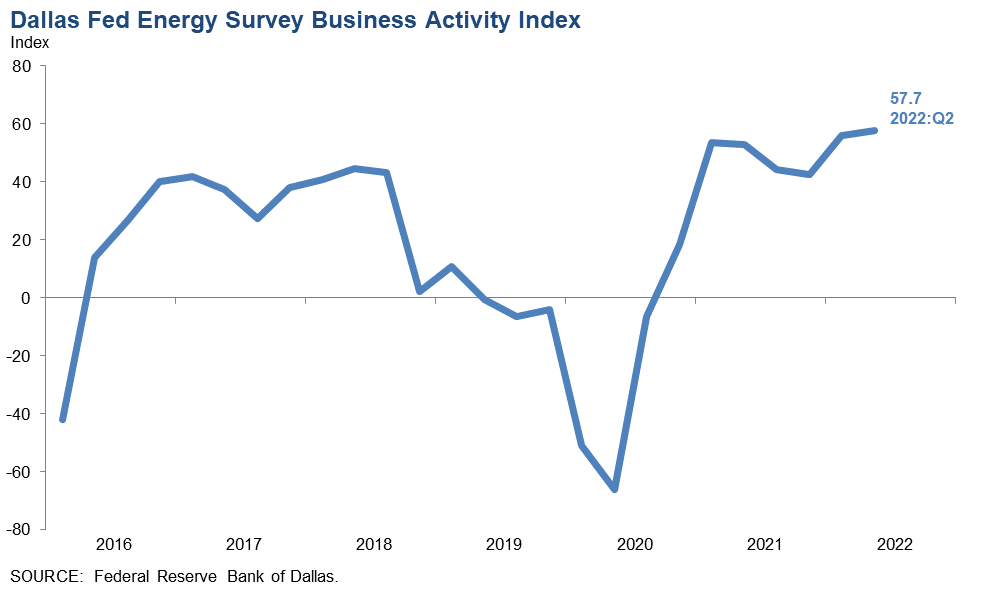
Activity in the oil and gas sector expanded at a robust pace in second quarter 2022, according to oil and gas executives responding to the Dallas Fed Energy Survey. The business activity index—the survey’s broadest measure of conditions facing Eleventh District energy firms—edged up from 56.0 in the first quarter to 57.7, registering its highest reading in the survey’s six-year history.
Oil and natural gas production increased, though the pace eased slightly, according to executives at exploration and production (E&P) firms. The oil production index remained well above average but fell from 45.0 in the first quarter to 32.6 in the second quarter. The natural gas production index declined five points to 35.3.
Costs increased for a sixth straight quarter. Among oilfield services firms, the index for input costs jumped from 77.1 to 88.0—reaching a record high. None of the 52 responding oilfield services firms reported lower input costs. Among E&P firms, the index for finding and development costs increased from 56.0 in the first quarter to 70.6 in the second. Additionally, the index for lease operating expenses also advanced notably, from 58.9 to 74.1. Both indexes reached highs for the survey’s six-year history.
It is taking longer for firms to receive materials and equipment. The supplier delivery index edged up from 30.6 to 31.9—a record high. Among oilfield service firms, the measure of lag time for deliveries jumped from 25.5 to 36.0—also a record high and suggestive of delays acquiring products and/or services.
Oilfield services firms reported improvement across key indicators. The equipment utilization index jumped from 50.0 in the first quarter to 66.7 in the second quarter. The operating margin index advanced from 21.3 to 32.7, a record high. The index of prices received for services increased from 53.2 to 62.7.
All labor market indexes in the second quarter remained elevated, pointing to strong growth in employment, hours and wages. The aggregate employment index posted a sixth consecutive positive reading but declined from 28.0 to 22.6, indicative of a slightly slowing rate of expansion in a very active job market. The aggregate employee hours index also remained positive but dipped from 36.0 to 31.4. The aggregate wages and benefits index decreased from 54.0 to 48.6.
Six-month outlooks improved significantly, with the index at 65.9, a highly elevated reading. The outlook uncertainty index remained positive but fell from 31.9 to 12.4, suggesting that while uncertainty continued to increase on net, fewer firms noted a rise this quarter than last quarter.
On average, respondents expect a West Texas Intermediate (WTI) oil price of $108 per barrel by year-end 2022; responses ranged from $65 to $160 per barrel. Survey participants expect Henry Hub natural gas prices of $7.55 per million British thermal units (MMBtu) at year-end. For reference, WTI spot prices averaged $119.56 per barrel during the survey collection period, and Henry Hub spot prices averaged $8.38 per MMBtu.
Next release: September 28, 2022
Data were collected June 8–16, and 137 energy firms responded. Of the respondents, 85 were exploration and production firms and 52 were oilfield services firms.
The Dallas Fed conducts the Dallas Fed Energy Survey quarterly to obtain a timely assessment of energy activity among oil and gas firms located or headquartered in the Eleventh District. Firms are asked whether business activity, employment, capital expenditures and other indicators increased, decreased or remained unchanged compared with the prior quarter and with the same quarter a year ago. Survey responses are used to calculate an index for each indicator. Each index is calculated by subtracting the percentage of respondents reporting a decrease from the percentage reporting an increase. When the share of firms reporting an increase exceeds the share reporting a decrease, the index will be greater than zero, suggesting the indicator has increased over the previous quarter. If the share of firms reporting a decrease exceeds the share reporting an increase, the index will be below zero, suggesting the indicator has decreased over the previous quarter.
Price Forecasts
West Texas Intermediate Crude
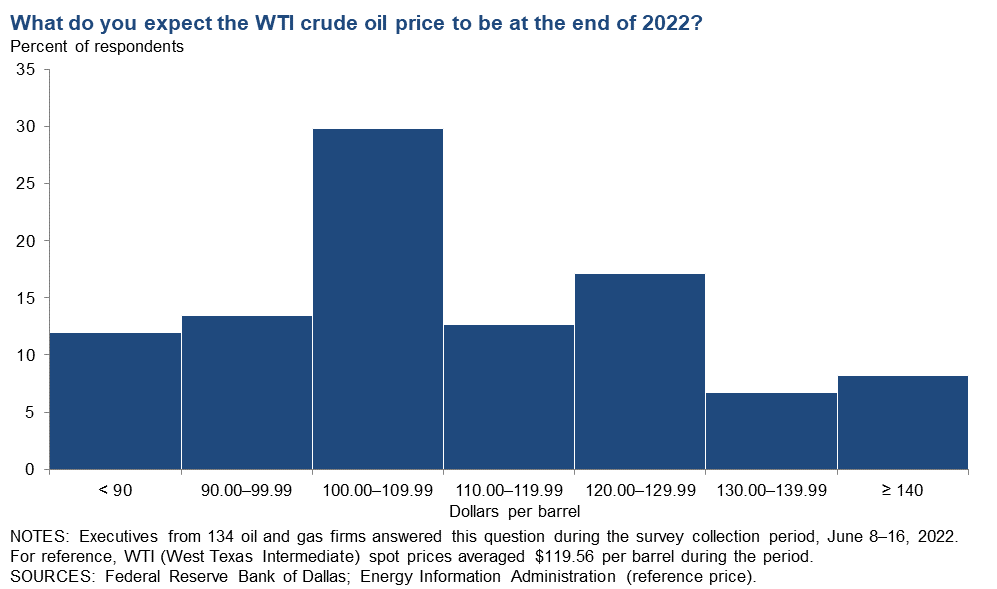
| West Texas Intermediate crude oil price (dollars per barrel), year-end 2022 | ||||
| Indicator | Survey Average | Low Forecast | High Forecast | Price During Survey |
Current quarter | $107.93 | $65.00 | $160.00 | $119.56 |
Prior quarter | $93.26 | $50.00 | $200.00 | $103.07 |
| NOTE: Price during survey is an average of daily spot prices during the survey collection period. SOURCES: Energy Information Administration; Federal Reserve Bank of Dallas. | ||||
Henry Hub Natural Gas
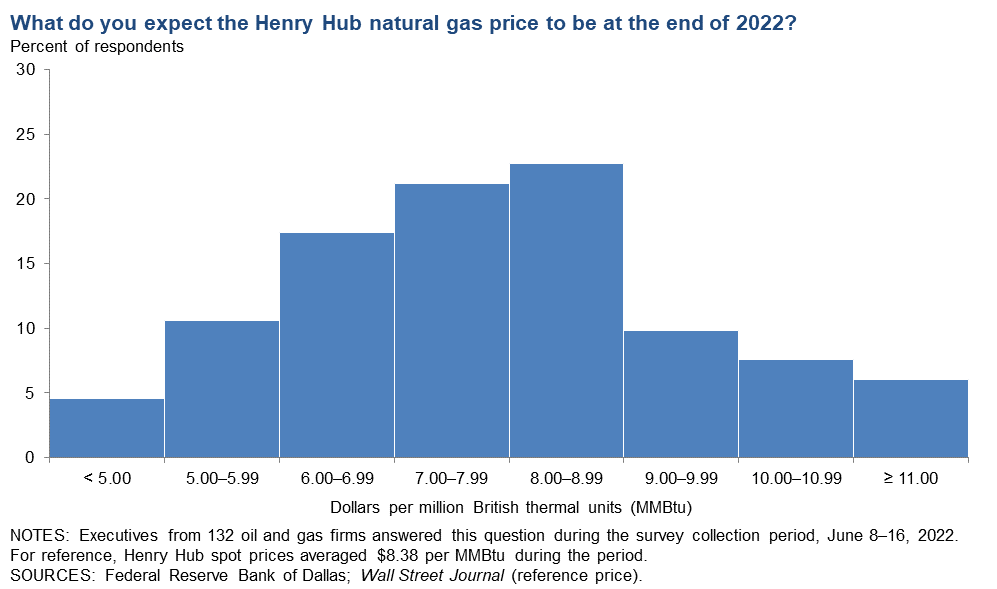
| Henry Hub natural gas price (dollars per MMBtu), year-end 2022 | ||||
| Indicator | Survey Average | Low Forecast | High Forecast | Price During Survey |
Current quarter | $7.55 | $2.90 | $12.00 | $8.38 |
Prior quarter | $4.57 | $3.00 | $8.00 | $4.65 |
| NOTE: Price during survey is an average of daily spot prices during the survey collection period. SOURCES: Federal Reserve Bank of Dallas; Wall Street Journal. | ||||
Special Questions
Data were collected June 8–16; 133 oil and gas firms responded to the special questions survey.
All Firms
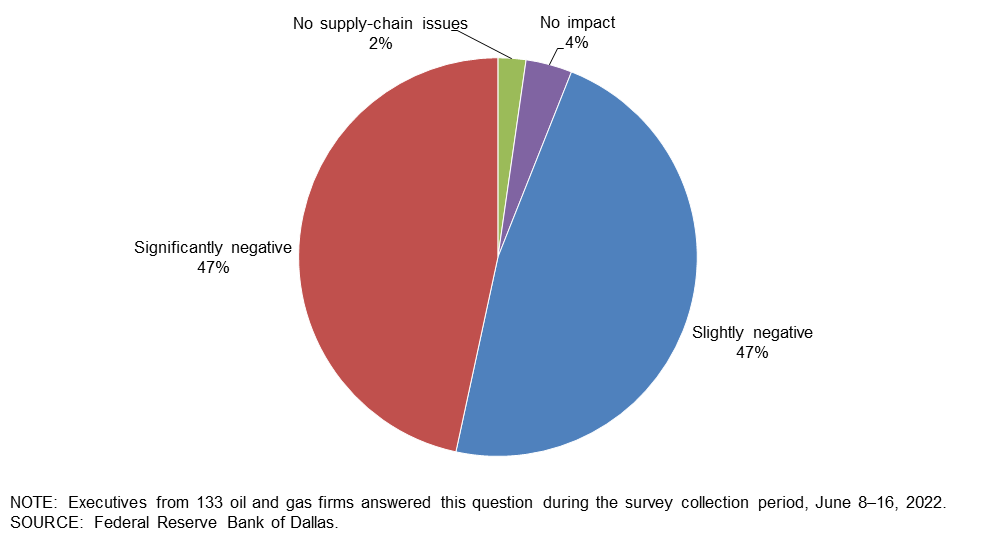
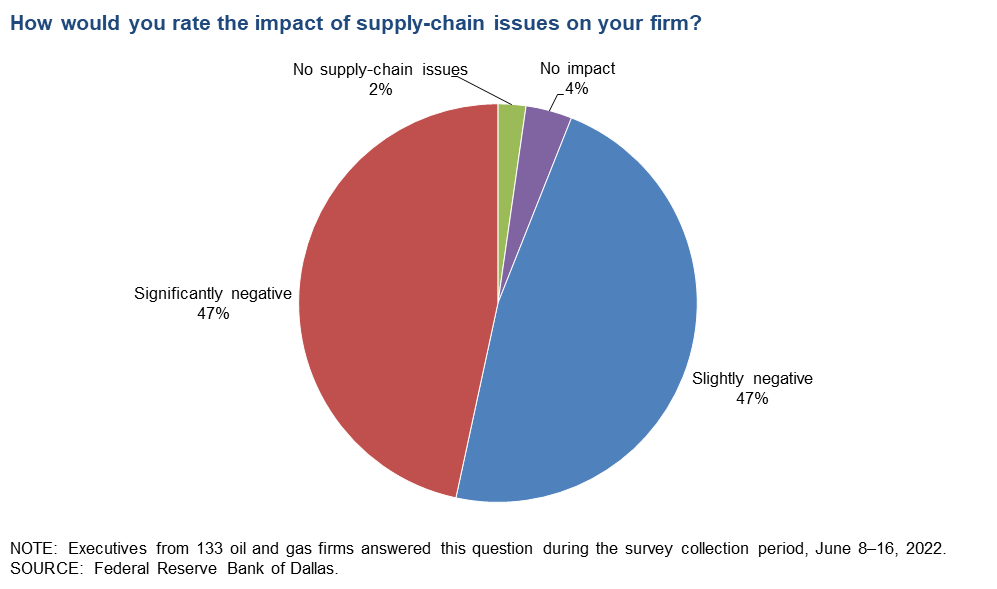
How would you rate the impact of supply-chain issues on your firm?
Almost half of the executives—47 percent—said supply-chain issues are having a slightly negative impact on their firms. An additional 47 percent rate the impact as significantly negative. Six percent of executives said their firms are experiencing no supply-chain issues or impacts.
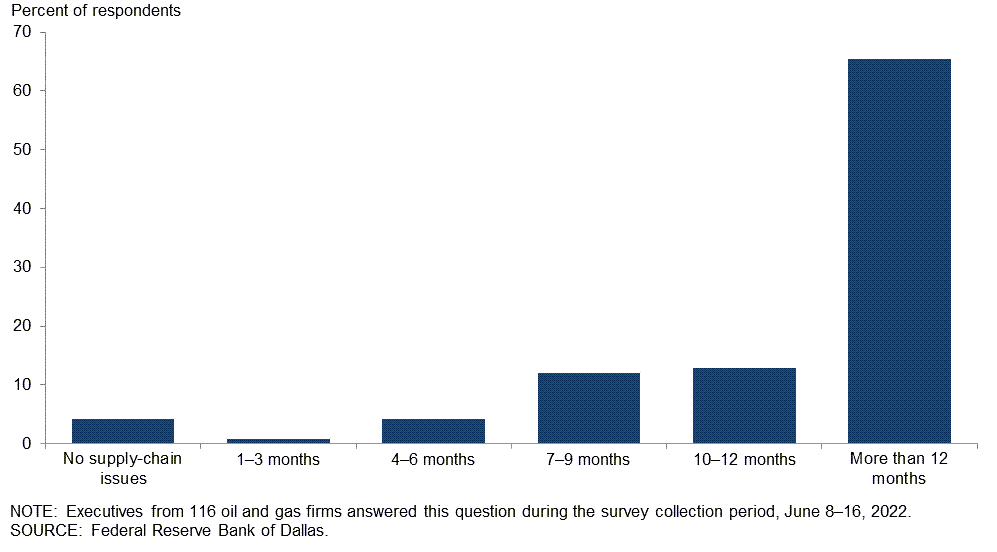
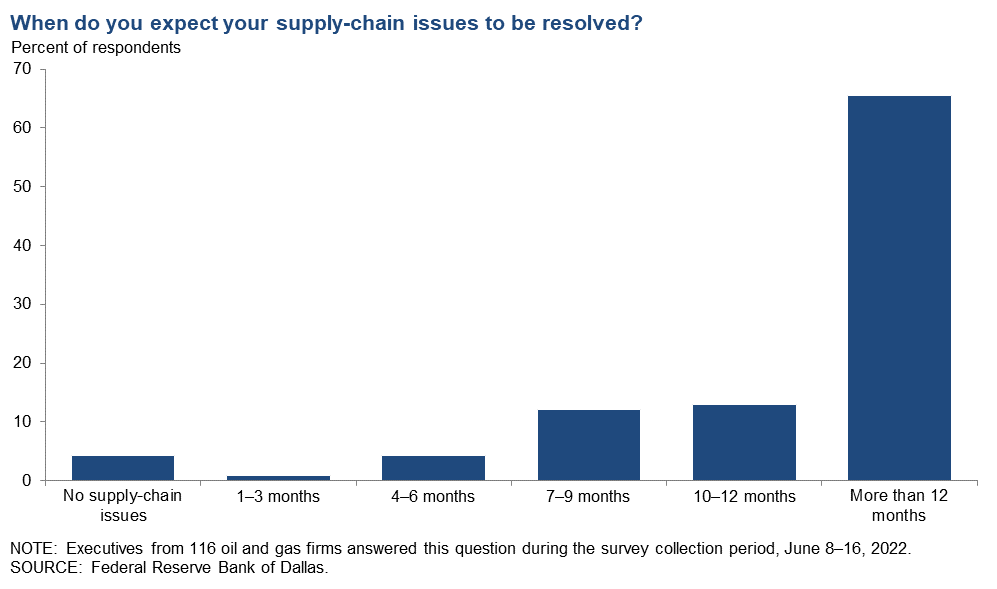
When do you expect your supply-chain issues to be resolved?
Most executives (66 percent) expect it will take more than a year to resolve supply-chain issues. Thirteen percent expect it will take 10 to 12 months, and 12 percent expect it will take seven to nine months. Few executives expect resolution of supply-chain issues in six months or less, and 4 percent of executives said that their firms are experiencing no supply-chain issues.
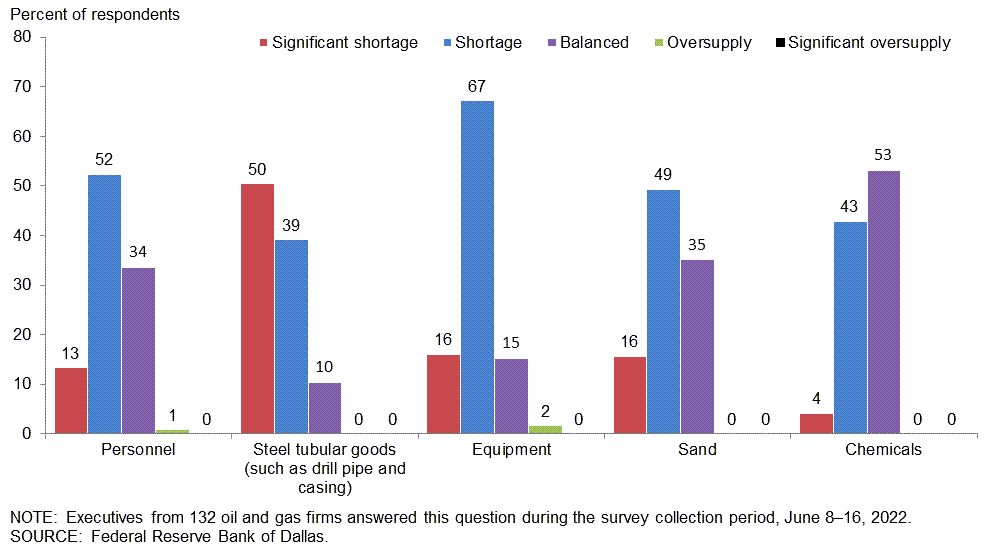
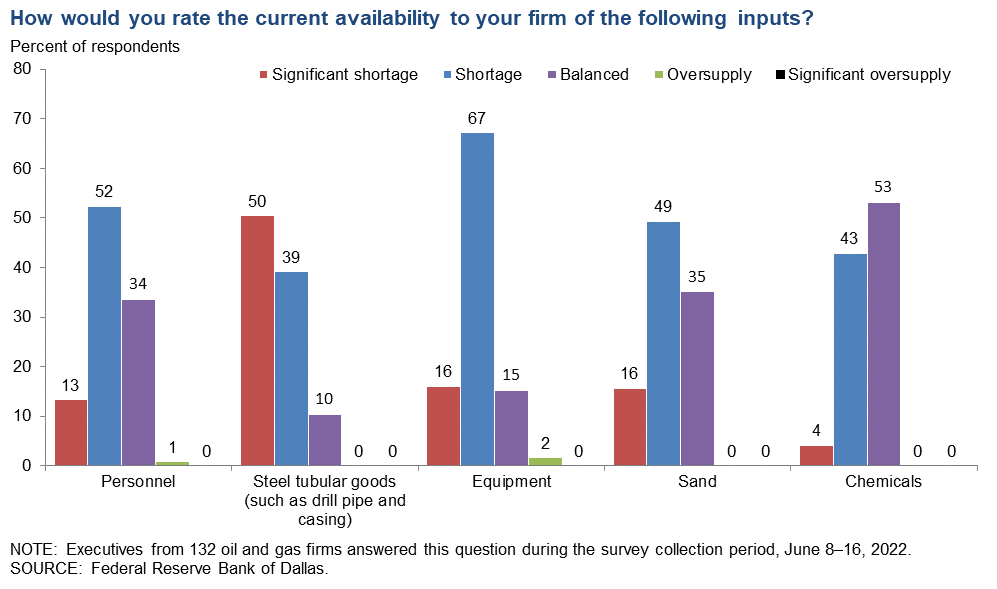
How would you rate the current availability to your firm of the following inputs?
Firms were provided with five inputs and were asked to rate the current availability as: significant shortage, shortage, balanced, oversupply or significant oversupply. Executives generally rated availability of steel tubular goods (such as drill pipe and casing) as in significant shortage. Executives generally rated availability of personnel, equipment and sand as in shortage. The availability of chemicals to firms was generally rated as balanced. Almost no executives rated the availability of inputs as in oversupply or in significant oversupply.
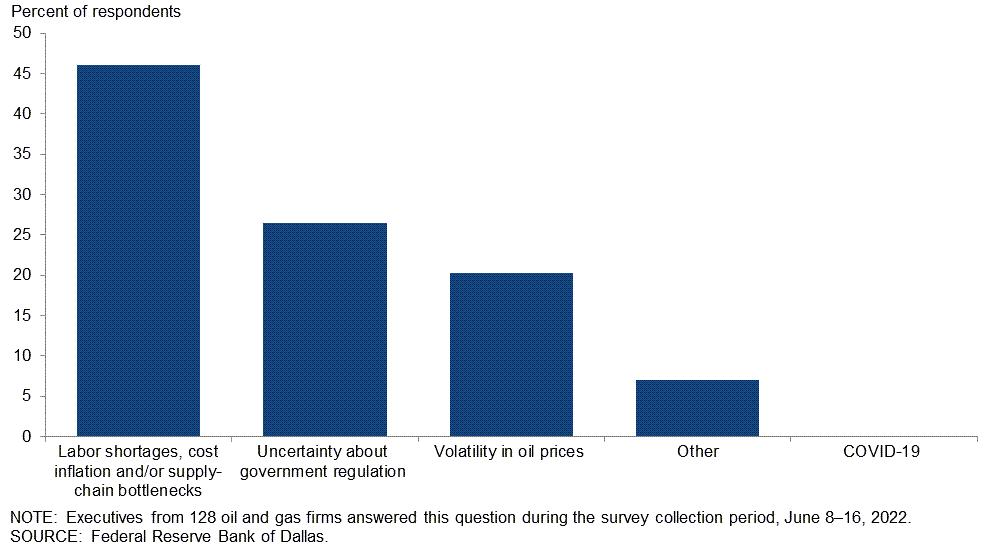
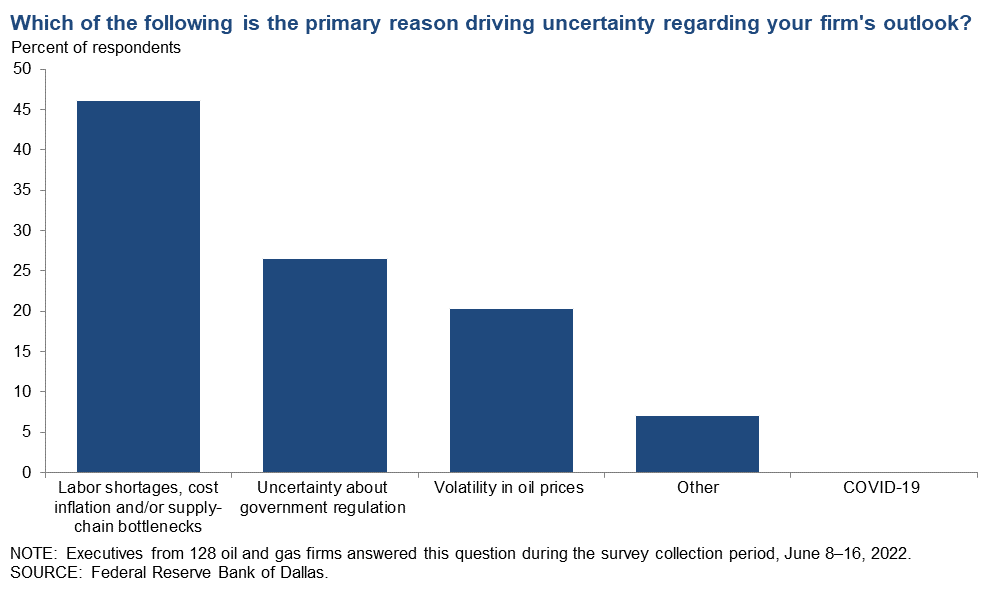
Which of the following is the primary reason driving uncertainty regarding your firm's outlook?
Forty-six percent of executives note that the primary factor driving uncertainty regarding their firm's outlook is “labor shortages, cost inflation and/or supply-chain bottlenecks.” Twenty-seven percent cited uncertainty about government regulation, and 20 percent said oil-price volatility. Seven percent said “other,” and none noted COVID-19.
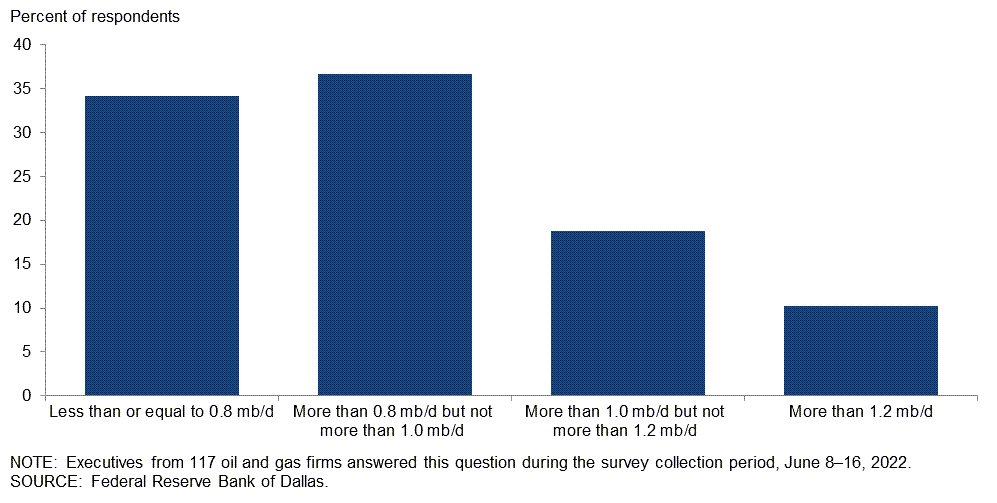
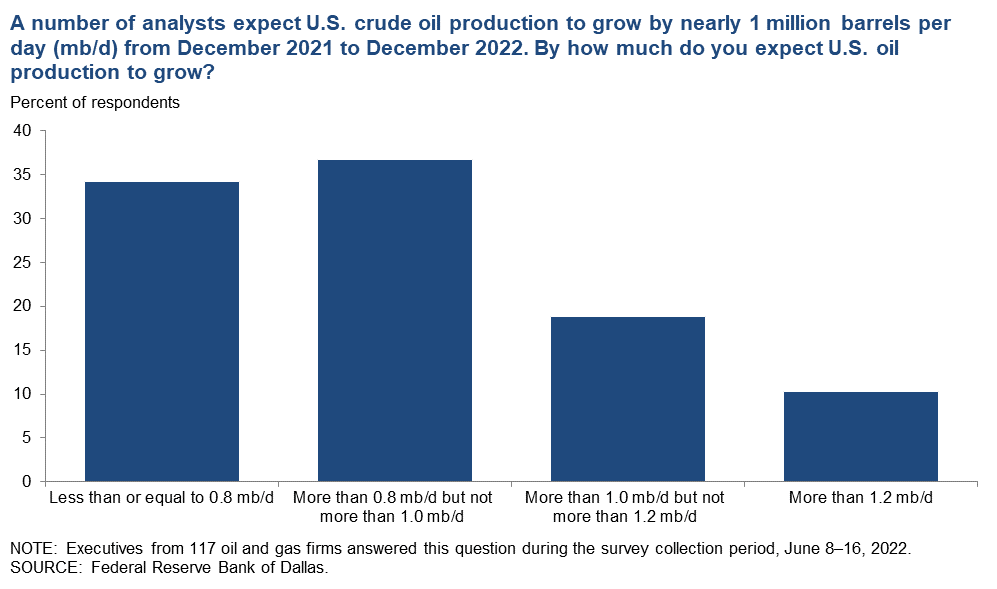
A number of analysts expect U.S. crude oil production to grow by nearly 1 million barrels per day (mb/d) from December 2021 to December 2022. By how much do you expect U.S. oil production to grow?
Most executives expect U.S. crude oil production to grow by 1.0 mb/d or less. Thirty-seven percent of executives expect production to increase by more than 0.8 mb/d but not more than 1.0 mb/d, and an additional 34 percent of executives expect production to grow by 0.8 mb/d or less.
Nineteen percent expect U.S. production to grow by more than 1.0 mb/d but not more than 1.2 mb/d, and 10 percent indicated more than 1.2 mb/d.
Exploration and Production (E&P) Firms
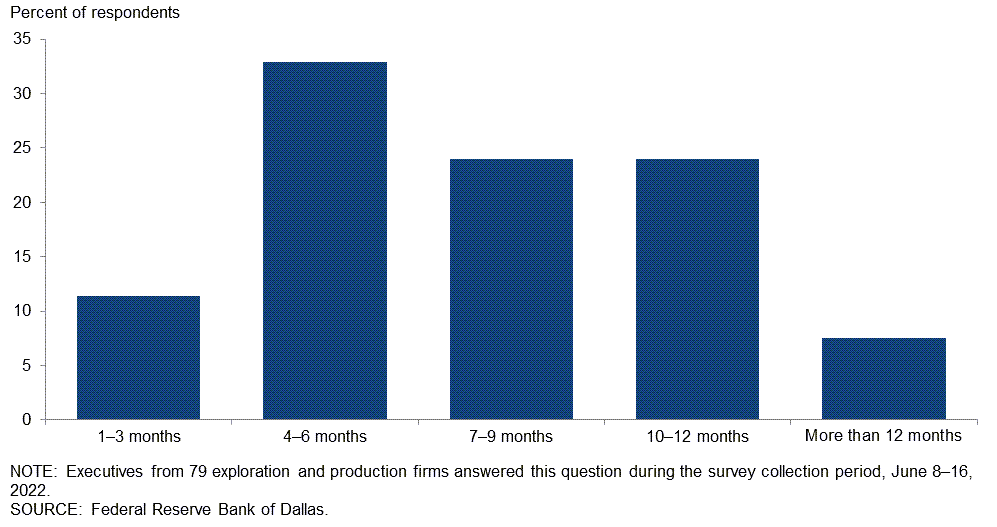
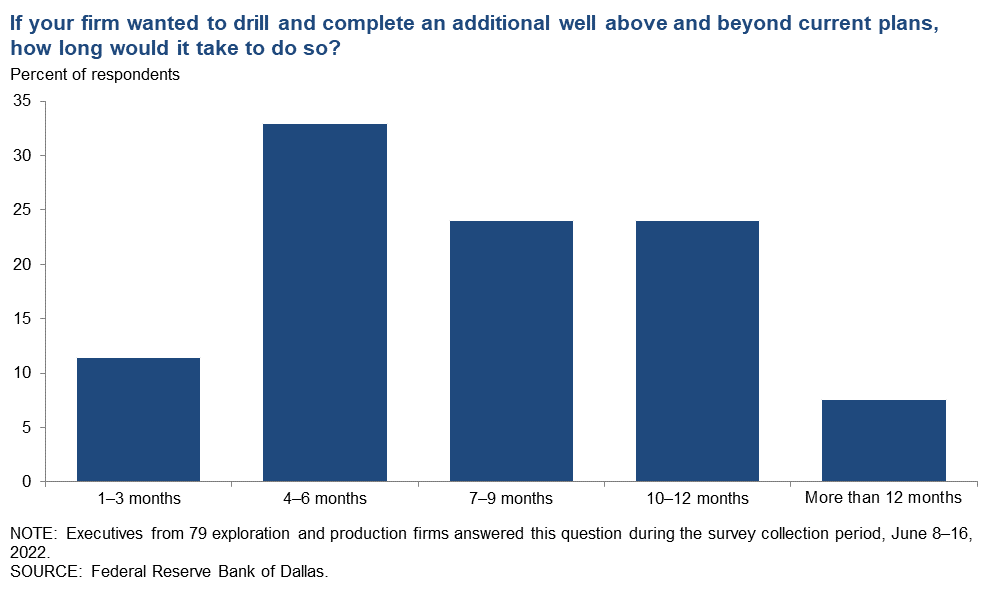
If your firm wanted to drill and complete an additional well above and beyond current plans, how long would it take to do so?
Thirty-three percent of executives expect that it would take 4‒6 months for their firm to drill and complete an additional well above and beyond current plans. Twenty-four percent of executives expect it would take 7‒9 months, and an additional 24 percent believe it would take 10‒12 months. Eleven percent said 1–3 months, and the remaining 8 percent said more than 12 months.
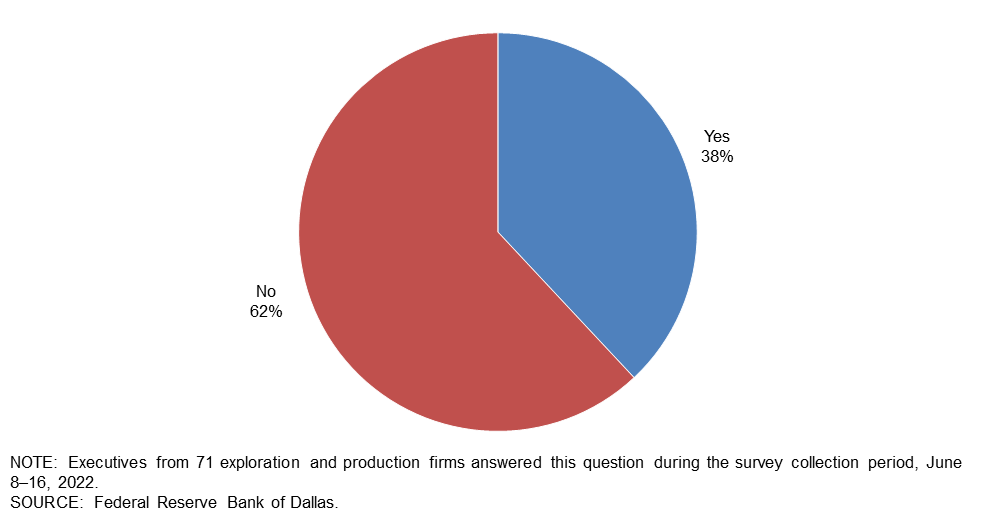
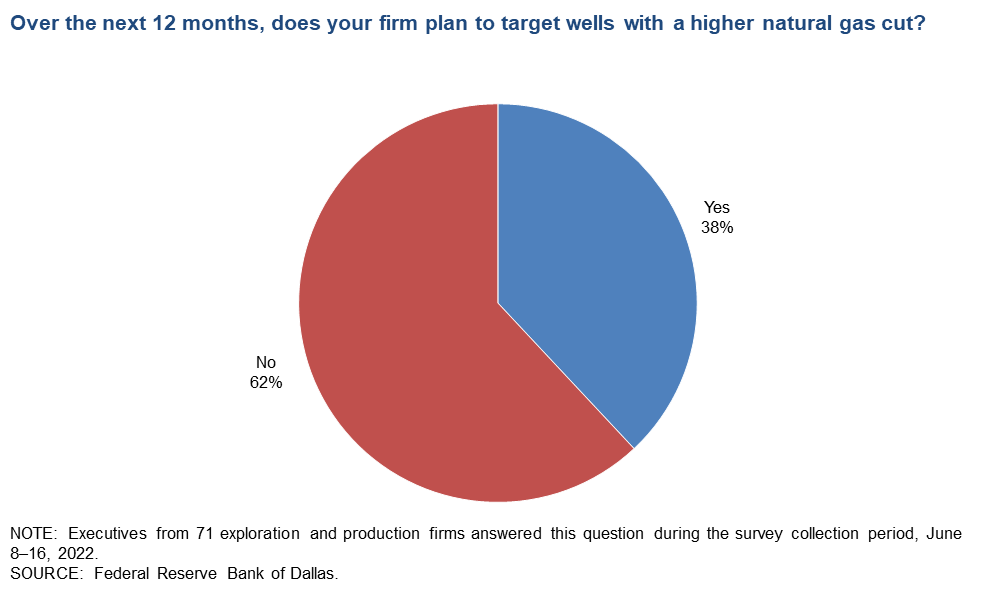
Over the next 12 months, does your firm plan to target wells with a higher natural gas cut?
Sixty-two percent of executives said their firm does not plan to target wells with a higher natural gas cut over the next 12 months. The remaining 38 percent said their firm plans to do so.
Special Questions Comments
Exploration and Production (E&P) Firms
- Government animosity toward our industry makes us reluctant to pursue new projects.
- While the tariff exemption on steel from Ukraine is a step in the right direction, Ukraine’s mills are unable to quickly restart production. This will not increase steel product availability in the near term. We need to remove or reduce tariffs and quotas from other countries to increase availability.
- The real energy crisis isn’t even here yet. The U.S. Energy Information Administration forecasts U.S. oil production to average 12.5 million barrels per day for the next 30 years. This is all but impossible. Shale will likely tip into terminal decline in about five years as the main shale plays run out of locations. Unfortunately, by then, most of the individuals with incumbent knowledge about offshore and international development will have retired. The brain drain in the industry will create a real and much larger crisis in the mid-to-late 2020s.
- The current administration [in Washington] declared war on fossil fuels before going into office, and they have continued that war to this day.
- Mixed messages from politicians remain unhelpful to longer-term projects and commitments. Politicians need the reminder that a barrel of oil does not go directly into the gas tank of a car. Broadly speaking, permitting of all kinds remains difficult, if not impossible, and the lead times are forever.
- Although the question regarding availability of inputs has not affected me, it has had a significant impact on business decisions, especially whether or not to drill and/or participate in new wells.
- Analysts underestimate the impact of supply-chain disruptions and loss of efficiency of the contractors who construct our wells, as equipment maintenance is done on the jobsite and personnel have less training.
- I hope this industry can weather the outrageous current assaults and the tidal wave of more of them to come from the administration.
- Many companies are planning an exit of their business.
Oil and Gas Support Services Firms
- Government regulations and the constant pounding on oil and gas companies and their suppliers certainly are causing a reluctance to invest in the business. When our government leaders are regularly demonizing the business, we shouldn’t be surprised that investors are not interested in supporting exploration for new supplies. The lag time to secure a return is measured in years or decades; who would invest when you have no certainty that the government won’t restrict or, even worse, guarantee you will not be successful?
- Those of us in oil and gas services businesses are very frustrated with those who push for elimination of fossil fuels now! Most folks do not comprehend the sheer number of everyday products that have some fossil fuel in their production. Would I like to see the use of fossil fuels reduced? Of course I would—if not for my sake, then for the sake of my kids and grandkids and the generations to come. However, I wholeheartedly support a gradual shift away from fossil fuels in a well-conceived and structured plan of action—not “let’s get this done yesterday!”
- Wages in oil and gas support services firms increased 25 percent in 2021 and another 10 percent so far in 2022. Rig hands are starting at about $85,000, with no experience and work half the year.
- There is very little, if any, extra capacity of oilfield cement.
Additional Comments »
Historical data are available from first quarter 2016 to the most current release quarter.
Business Indicators: Quarter/Quarter
| Business Indicators: All Firms Current Quarter (versus previous quarter) | |||||
| Indicator | Current Index | Previous Index | % Reporting Increase | % Reporting No Change | % Reporting Decrease |
Level of Business Activity | 57.7 | 56.0 | 62.8 | 32.1 | 5.1 |
Capital Expenditures | 52.5 | 46.3 | 56.9 | 38.7 | 4.4 |
Supplier Delivery Time | 31.9 | 30.6 | 51.9 | 28.1 | 20.0 |
Employment | 22.6 | 28.0 | 27.7 | 67.2 | 5.1 |
Employee Hours | 31.4 | 36.0 | 35.0 | 61.3 | 3.6 |
Wages and Benefits | 48.6 | 54.0 | 51.5 | 45.6 | 2.9 |
| Indicator | Current Index | Previous Index | % Reporting Improved | % Reporting No Change | % Reporting Worsened |
Company Outlook | 65.9 | 76.3 | 72.9 | 20.2 | 7.0 |
| Indicator | Current Index | Previous Index | % Reporting Increase | % Reporting No Change | % Reporting Decrease |
Uncertainty | 12.4 | 31.9 | 35.0 | 42.3 | 22.6 |
| Business Indicators: E&P Firms Current Quarter (versus previous quarter) | |||||
| Indicator | Current Index | Previous Index | % Reporting Increase | % Reporting No Change | % Reporting Decrease |
Level of Business Activity | 49.4 | 50.5 | 55.3 | 38.8 | 5.9 |
Oil Production | 32.6 | 45.0 | 42.2 | 48.2 | 9.6 |
Natural Gas Wellhead Production | 35.3 | 40.0 | 45.1 | 45.1 | 9.8 |
Capital Expenditures | 48.2 | 44.5 | 54.1 | 40.0 | 5.9 |
Expected Level of Capital Expenditures Next Year | 54.2 | 51.6 | 62.4 | 29.4 | 8.2 |
Supplier Delivery Time | 26.2 | 28.9 | 51.2 | 23.8 | 25.0 |
Employment | 13.0 | 24.5 | 16.5 | 80.0 | 3.5 |
Employee Hours | 20.0 | 27.8 | 21.2 | 77.6 | 1.2 |
Wages and Benefits | 36.9 | 52.3 | 40.5 | 56.0 | 3.6 |
Finding and Development Costs | 70.6 | 56.0 | 71.8 | 27.1 | 1.2 |
Lease Operating Expenses | 74.1 | 58.9 | 75.3 | 23.5 | 1.2 |
| Indicator | Current Index | Previous Index | % Reporting Improved | % Reporting No Change | % Reporting Worsened |
Company Outlook | 63.3 | 79.3 | 72.2 | 19.0 | 8.9 |
| Indicator | Current Index | Previous Index | % Reporting Increase | % Reporting No Change | % Reporting Decrease |
Uncertainty | 21.2 | 29.6 | 40.0 | 41.2 | 18.8 |
| Business Indicators: O&G Support Services Firms Current Quarter (versus previous quarter) | |||||
| Indicator | Current Index | Previous Index | % Reporting Increase | % Reporting No Change | % Reporting Decrease |
Level of Business Activity | 71.2 | 66.0 | 75.0 | 21.2 | 3.8 |
Utilization of Equipment | 66.7 | 50.0 | 70.6 | 25.5 | 3.9 |
Capital Expenditures | 59.6 | 50.0 | 61.5 | 36.5 | 1.9 |
Supplier Delivery Time | 41.1 | 34.0 | 52.9 | 35.3 | 11.8 |
Lag Time in Delivery of Firm's Services | 36.0 | 25.5 | 36.0 | 64.0 | 0.0 |
Employment | 38.5 | 34.7 | 46.2 | 46.2 | 7.7 |
Employment Hours | 50.0 | 51.0 | 57.7 | 34.6 | 7.7 |
Wages and Benefits | 67.3 | 57.1 | 69.2 | 28.8 | 1.9 |
Input Costs | 88.0 | 77.1 | 88.0 | 12.0 | 0.0 |
Prices Received for Services | 62.7 | 53.2 | 62.7 | 37.3 | 0.0 |
Operating Margin | 32.7 | 21.3 | 48.1 | 36.5 | 15.4 |
| Indicator | Current Index | Previous Index | % Reporting Improved | % Reporting No Change | % Reporting Worsened |
Company Outlook | 70.0 | 70.8 | 74.0 | 22.0 | 4.0 |
| Indicator | Current Index | Previous Index | % Reporting Increase | % Reporting No Change | % Reporting Decrease |
Uncertainty | –1.9 | 36.0 | 26.9 | 44.2 | 28.8 |
Business Indicators: Year/Year
| Business Indicators: All Firms Current Quarter (versus same quarter a year ago) | |||||
| Indicator | Current Index | Previous Index | % Reporting Increase | % Reporting No Change | % Reporting Decrease |
Level of Business Activity | 66.2 | 66.7 | 75.6 | 15.0 | 9.4 |
Capital Expenditures | 64.3 | 66.2 | 73.0 | 18.3 | 8.7 |
Supplier Delivery Time | 49.2 | 43.0 | 66.7 | 15.9 | 17.5 |
Employment | 27.9 | 28.1 | 38.0 | 51.9 | 10.1 |
Employee Hours | 38.2 | 40.9 | 44.5 | 49.2 | 6.3 |
Wages and Benefits | 65.7 | 70.3 | 68.8 | 28.1 | 3.1 |
| Indicator | Current Index | Previous Index | % Reporting Improved | % Reporting No Change | % Reporting Worsened |
Company Outlook | 80.9 | 82.0 | 85.2 | 10.4 | 4.3 |
| Business Indicators: E&P Firms Current Quarter (versus same quarter a year ago) | |||||
| Indicator | Current Index | Previous Index | % Reporting Increase | % Reporting No Change | % Reporting Decrease |
Level of Business Activity | 55.3 | 59.8 | 67.1 | 21.1 | 11.8 |
Oil Production | 48.7 | 46.0 | 59.2 | 30.3 | 10.5 |
Natural Gas Wellhead Production | 45.4 | 41.2 | 59.7 | 26.0 | 14.3 |
Capital Expenditures | 62.3 | 63.9 | 71.4 | 19.5 | 9.1 |
Expected Level of Capital Expenditures Next Year | 63.6 | 63.1 | 71.4 | 20.8 | 7.8 |
Supplier Delivery Time | 50.0 | 41.6 | 68.4 | 13.2 | 18.4 |
Employment | 16.7 | 16.5 | 24.4 | 67.9 | 7.7 |
Employee Hours | 25.6 | 30.6 | 28.2 | 69.2 | 2.6 |
Wages and Benefits | 58.4 | 65.9 | 62.3 | 33.8 | 3.9 |
Finding and Development Costs | 79.5 | 73.3 | 79.5 | 20.5 | 0.0 |
Lease Operating Expenses | 77.3 | 69.0 | 81.3 | 14.7 | 4.0 |
| Indicator | Current Index | Previous Index | % Reporting Improved | % Reporting No Change | % Reporting Worsened |
Company Outlook | 82.7 | 86.4 | 87.0 | 8.7 | 4.3 |
| Business Indicators: O&G Support Services Firms Current Quarter (versus same quarter a year ago) | |||||
| Indicator | Current Index | Previous Index | % Reporting Increase | % Reporting No Change | % Reporting Decrease |
Level of Business Activity | 82.3 | 79.1 | 88.2 | 5.9 | 5.9 |
Utilization of Equipment | 73.5 | 74.0 | 75.5 | 22.4 | 2.0 |
Capital Expenditures | 67.3 | 70.2 | 75.5 | 16.3 | 8.2 |
Supplier Delivery Time | 48.0 | 45.4 | 64.0 | 20.0 | 16.0 |
Lag Time in Delivery of Firm's Services | 40.8 | 37.8 | 44.9 | 51.0 | 4.1 |
Employment | 45.1 | 48.9 | 58.8 | 27.5 | 13.7 |
Employment Hours | 58.0 | 59.6 | 70.0 | 18.0 | 12.0 |
Wages and Benefits | 76.4 | 78.3 | 78.4 | 19.6 | 2.0 |
Input Costs | 89.8 | 86.9 | 89.8 | 10.2 | 0.0 |
Prices Received for Services | 76.0 | 65.9 | 76.0 | 24.0 | 0.0 |
Operating Margin | 50.0 | 41.9 | 62.5 | 25.0 | 12.5 |
| Indicator | Current Index | Previous Index | % Reporting Improved | % Reporting No Change | % Reporting Worsened |
Company Outlook | 78.3 | 73.1 | 82.6 | 13.0 | 4.3 |
Activity Chart
Comments from Survey Respondents
These comments are from respondents’ completed surveys and have been edited for publication. Comments from the Special Questions survey can be found below the special questions.
Exploration and Production (E&P) Firms
- We are experiencing significant delays in obtaining materials and services, and costs are substantially increasing. We will shortly be ceasing investment in any new operations owing to the combination of rising costs, supply-chain slowness and our view that a recession is coming that will drop oil and natural gas prices significantly.
- The country’s energy policy is on the wrong path. Picking wind and solar and going faster in this direction is a mistake. The country should embrace domestic oil and gas. It can be done safely and cleanly. Oil and gas infrastructure should be approved and fast tracked. This should include pipelines, refineries and liquefied natural gas export facilities. This will help U.S. consumers [and] businesses, create jobs, create energy security, improve the supply chain, help our trade balance, help our allies, help the geopolitical situation and bring down inflation. More natural gas utilization will also help improve the environment. Natural gas displacing the use of coal has allowed the U.S. to lead the world in emissions reduction.
- The [federal] government's anti-oil, anti-gas and anti-pipeline stance has caused us to not pursue expansive projects.
- Investors are still not coming back to the well, so to speak. Private investors like endowments and foundations are structurally gone for good, and it is actually different this time. Pension plans are also hesitant to commit capital despite high prices. Public equity investors are still demanding too much, which has caused firms to go public via a special-purpose acquisition company and reverse merger transactions, indicating the discount demanded by traditional initial public offering investors is too high to stomach. The administration may be getting blamed, but it is the investors’ fault.
- Supply-chain issues are materially impacting capital allocation decisions. Hyperinflation is influencing all lines provided in authorization-for-expenditure budgetary documents for new oil and gas wells.
- The highest uncertainties are no longer below ground (ultimate recoveries, initial production rates, gas–oil ratios, operating expenses), as we’ve gotten very good at forecasting, estimating and predicting those. No, the highest uncertainties now are all above ground (politics, windfall profits tax, surtaxes, leasing bans, product prices, inflation, supply times, material availabilities, contractor availabilities and capital availability). We have an expansion project and another new project in West Texas but are stymied by rig availability, electrical submersible pump and other motor availabilities, driller availability, and casing and tubing availabilities. By the time we get our first well producing in our new project, we’ll probably miss the higher oil prices.
- Huge service cost increases, regulatory uncertainty and mixed messages from Washington are keeping me on the sidelines. After seven years of depressed oil prices, it is nice to have the capital to drill, but with a recession looming and the possibility that the war in Ukraine will end in the next few months, the price of oil could significantly decrease. I do not want to get caught again making obligations based on high prices that I must fulfill when low prices come back. This is what nearly sunk me in 2015 and 2016, and I never want to experience that again. Inflation in oilfield services, supplies and equipment have far outstripped the 8.5 percent inflation seen in other areas of the economy. The quality and availability of service providers is horrible. It may take weeks to get the simplest things done. Experienced employees left the oilfield, and our government is telling us they are not needed or wanted because we are transitioning to clean energy and oil and gas are no longer needed. Preparing for a lease sale and having it canceled, shutting down a major pipeline project, watching as our government negotiates with foreign despots to increase oil supplies and begging OPEC to increase production are so illogical that they have created a huge feeling of uncertainty and a perception of instability in the demand for oil. It is extremely difficult to make business decisions in such a hostile and irrational environment. So I am sitting on the sidelines trying to not get caught “holding the bag” once again.
- Uncertainty has increased dramatically.
- A shortage of truck drivers will impact all components of the supply chain and result in decreased production growth and less finished fuels. Increased regulatory hurdles are causing less capital [to flow] into the sector and, therefore, less production and finished fuel supply.
- It is getting increasingly hard to find rigs, steel pipe and fuel to run the rigs.
- The labor shortage is the biggest factor affecting services. There is no labor to man the equipment that is available. Work ethic has been destroyed by government handouts. We will not see a huge drilling upturn due to lack of labor and staff. The new generation hates fossil fuels due to all the propaganda distributed by the climate change agenda. They do not realize that electricity cannot be provided by renewables alone.
- Politics are affecting our business, with both sides pushing ridiculous agendas with no management or understanding at all. Wall Street is suddenly on the new fad of the day, which is everything green and environmental, social and governance. Money for small developers is virtually impossible to arrange these days.
- Supply-chain and labor-shortage issues persist. Certain materials are difficult to access, which is hampering our ability to plan, absent a willingness to depart from certain historical practices relating to quality standards.
- Oilfield tubular goods are in very short supply. Suppliers are giving longtime large customers first purchasing priority, resulting in shortages for small players. The shortage of frac [fracking] crews extends the time for establishing cash flow from new wells. Regulations and monitoring of gaseous emissions are very concerning and expensive for small stripper-well operators. Rhetoric from Washington expressing opposition to fossil fuels is very ill advised and discouraging.
- Inflation, supply-chain delays and access to skilled labor through our vendors and contractors are our major concerns. We were successful in extending our credit for four years and adding four new banks to our credit syndicate on favorable terms. The improved commodity price outlook aided the successful syndication, which closed in early May.
- Our industry is praying for a shift in the mid-term elections so we can prevent the administration [in Washington] from destroying our economy any further. I love high oil and natural gas prices, but they are really hurting the economy, and citizens are paying the price.
- We are focused on and growing more concerned about the impact of inflation on the overall economy.
- Significant increases in commodity prices have resulted in large financial hedge settlements each month. The lag between receipt of physical sales and paying hedge settlements creates a liquidity drag lasting several weeks.
Oil and Gas Support Services Firms
- Local and global supply chains of goods continue to hamper business. The industry is in the position to expand; however, supply-chain issues and employee-hiring issues will dampen the overall ability to expand.
- The supply chain seems stretched to the max in the Permian Basin. There really is not much ability to increase drilling activity.
- The oilfield service sector is improving; pricing levels are still under pre-COVID-19 levels but improving. Oilfield activity has not tracked the usual response to the rise in the price of oil due to capital discipline by E&P clients, and that discipline is not going to change as the industry still feels threatened by the green agenda promoted by the administration [in Washington]. As an example, pipeline capacity needs to expand in order for there to be more natural gas production.
- The administration’s lackluster support of domestic energy independence is undermining our industry’s ability to take the gloves off and tackle fuel-driven inflation creep. The American oil and gas industry is the most environmentally compliant producer in the world. If you truly care about the environment, let us help you.
- The limited labor supply is affecting every facet of our business. Supplier factories in Ohio are short staffed and underutilized. There is a significant shortage of technical labor to support oil and gas operations in the field. Seemingly all business activity in West Texas is at capacity, and there is limited room for further growth.
- Margins for our business are slim due to all the inflation issues.
- Hiring challenges continue, particularly in the more remote oilfield towns where labor left the region and industry permanently between 2015 and 2020. E&P companies are doing themselves and the industry a disservice when they react negatively, or punishingly, to necessary price increases from oilfield services companies.
- Our overall outlook has decreased substantially over the past few months. At the top is the continuing uncertainty regarding the administration and its policies and stances. This unease filters throughout our areas of operation. Projects have been approved by our customers [but] budgets are not being released because nobody wants to get caught short by a policy change. This is especially true in the longer time-frame jobs.
- The idea of general inflation, higher oil and gas prices and Federal Reserve rate hikes leading to a recession is being discussed among my peers. This is tempering enthusiasm and increasing concern about a whipsaw crash in prices for oil and natural gas.
- The access and retention of human capital remains challenging.
- It is almost impossible to hire drivers with a commercial driver’s license. New regulations have made it more difficult to hire drivers with a commercial driver’s license, and the demand for drivers is high everywhere. We need drivers with a commercial driver’s license to move equipment.
- Significant labor and supply-chain challenges have continued to impact business.
- We continue to see our customers be very deliberate and cost aware. I am regularly amazed at how cautious the business is, even with the dramatic improvement in commodity prices.
- Customers seem to be more active, but we have had no new contracts.
Questions regarding the Dallas Fed Energy Survey can be addressed to Michael Plante at Michael.Plante@dal.frb.org or Kunal Patel at Kunal.Patel@dal.frb.org.
Sign up for our email alert to be automatically notified as soon as the latest Dallas Fed Energy Survey is released on the web.