Texas Economic Indicators
June 26, 2023
| Texas economy dashboard (May 2023) | |||
| Job growth (annualized) Feb.–May '23 |
Unemployment rate |
Avg. hourly earnings |
Avg. hourly earnings growth y/y |
| 3.1% | 4.1% | $31.13 | 4.2% |
The Texas economy expanded further in May. Payrolls rose in most sectors, and jobless claims fell in mid-June. Consumer prices increased in April. Growth in the Texas Business-Cycle Index picked up slightly in May and was above its long-term average. The Dallas Fed’s Texas Manufacturing Outlook Survey suggested selling prices dipped in June, and the Dallas Fed’s Banking Conditions Survey reported a relatively broad-based decline in loan volumes in June.
Labor market
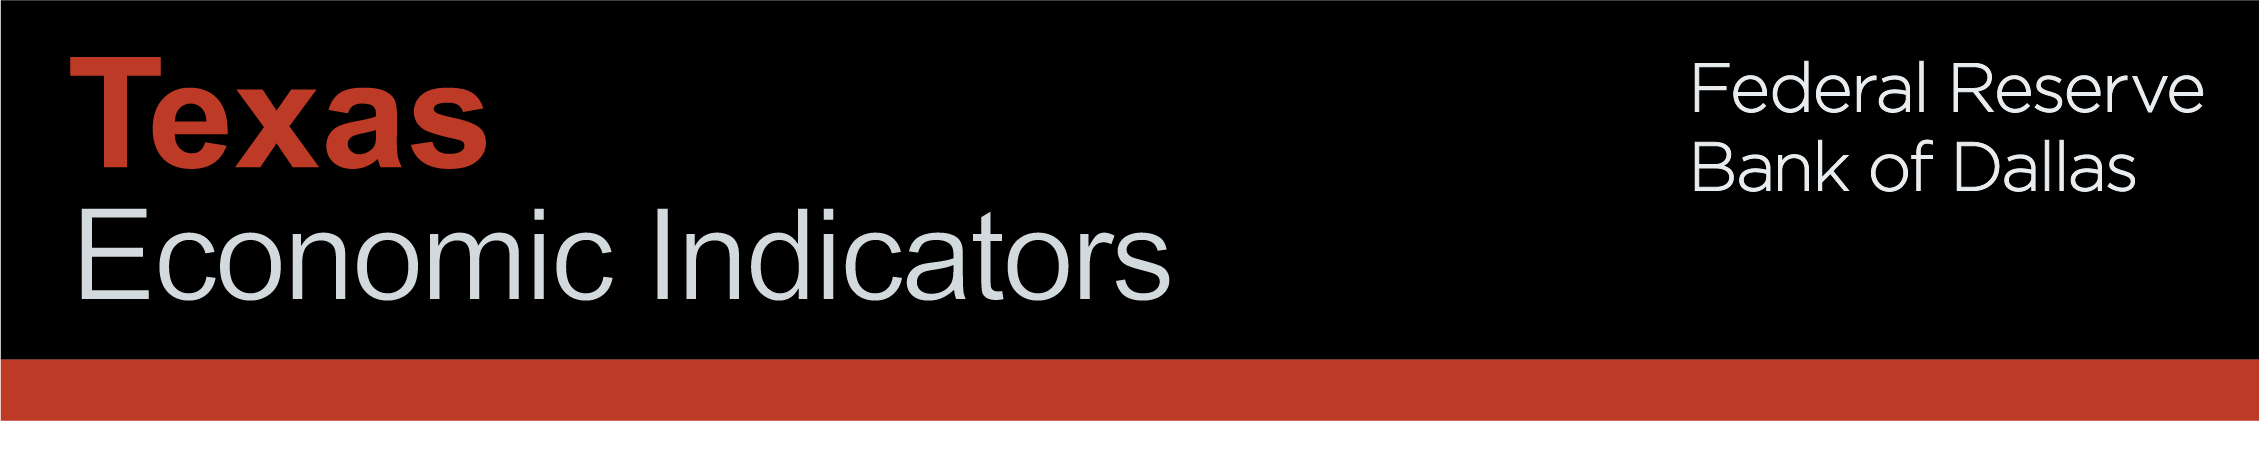
Texas experiences strong job growth
Texas employment grew an annualized 3.6 percent in May after rising a downwardly revised 2.5 percent in April. Employment in manufacturing and leisure and hospitality contracted in May, while every other sector expanded. Through May, Texas’ employment is up 3.6 percent (annualized), surpassing the nation’s 2.5 percent increase (Chart 1). Payroll gains were widespread across sectors, except for manufacturing where employment was largely flat. Job growth of 12.3 percent in the oil and gas sector outpaced all other major sectors, and both information and other services and professional and business services saw robust gains. The Dallas Fed’s Texas Employment Forecast released on June 16 estimated 2.8 percent job growth this year (December/December)—a slight uptick from its previous estimate.
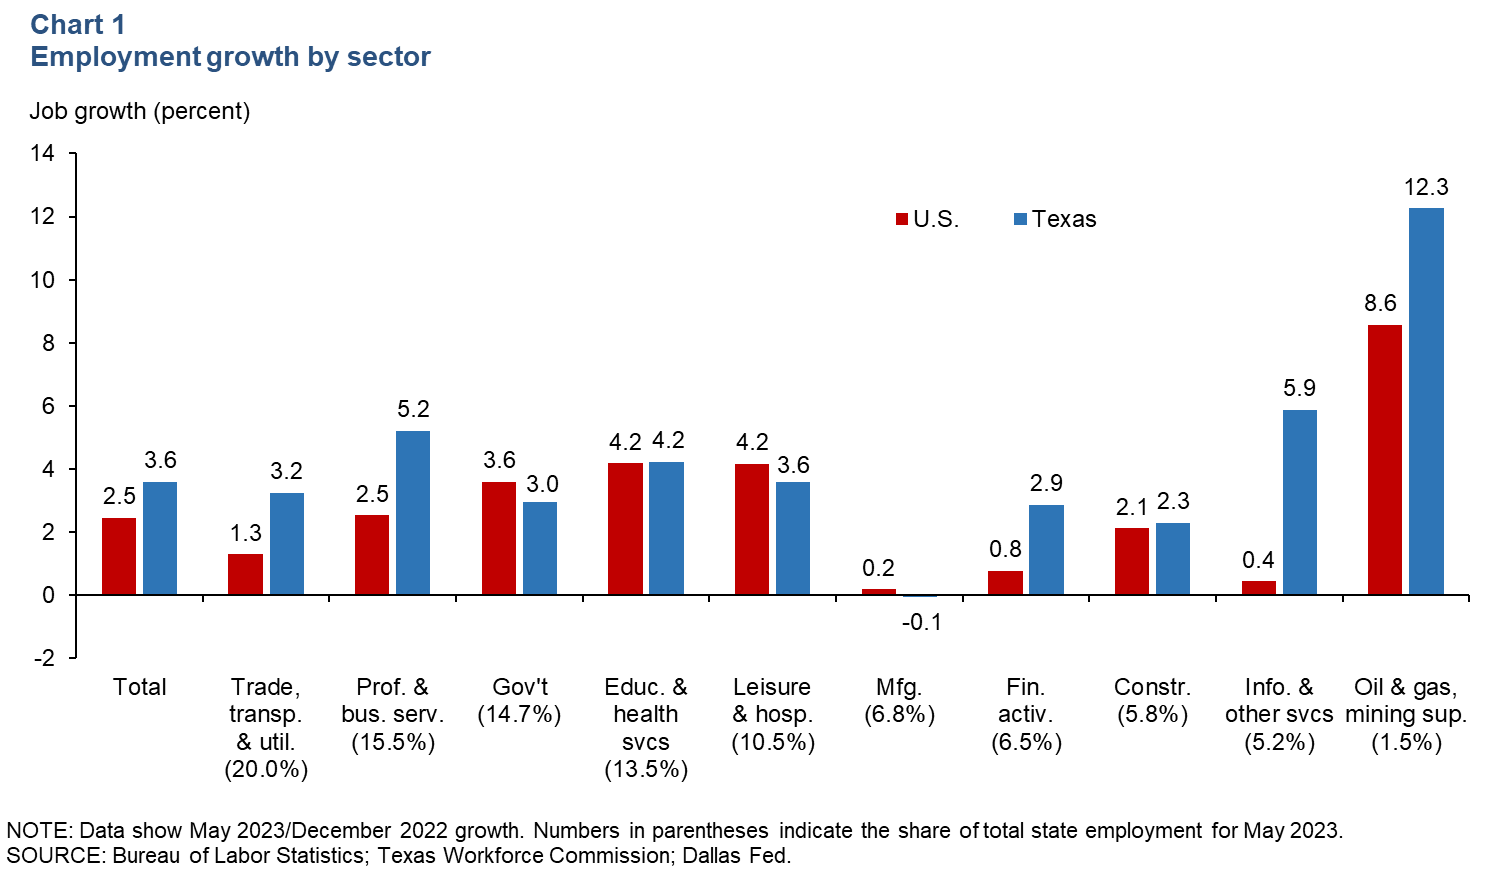
Initial unemployment claims dip in mid-June
Weekly initial unemployment claims decreased in Texas in mid-June (Chart 2). After rising for 11 consecutive weeks, initial jobless claims in Texas fell 3.1 percent to 26,253 claims in the week ending June 17 but remained above prepandemic levels. Meanwhile, national jobless claims were unchanged at 264,000, their highest level since late October 2021. After holding steady for three months, the Texas unemployment rate ticked up from 4.0 percent in April to 4.1 percent in May. U.S. unemployment ticked up 0.3 percentage points to 3.7 percent.
Consumer prices
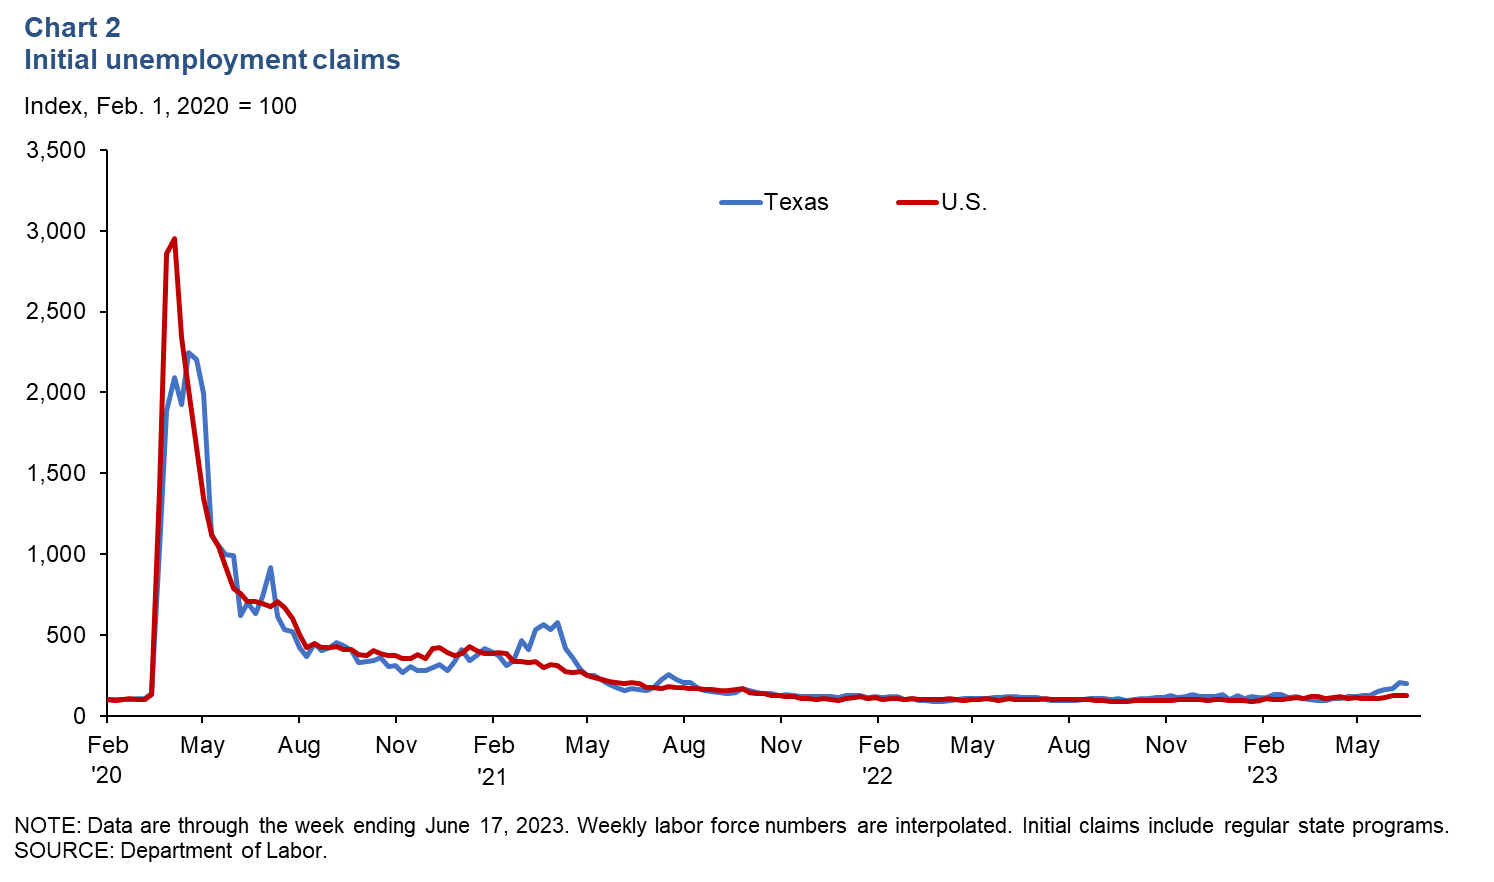
Inflation remained at elevated levels. The 12-month change in the Texas headline Consumer Price Index (CPI) moderated to 4.7 percent in April. Core CPI, which excludes food and energy prices, was up 6.4 percent in the 12 months ending in April (Chart 3). The food price index increased 8.9 percent year over year in April.
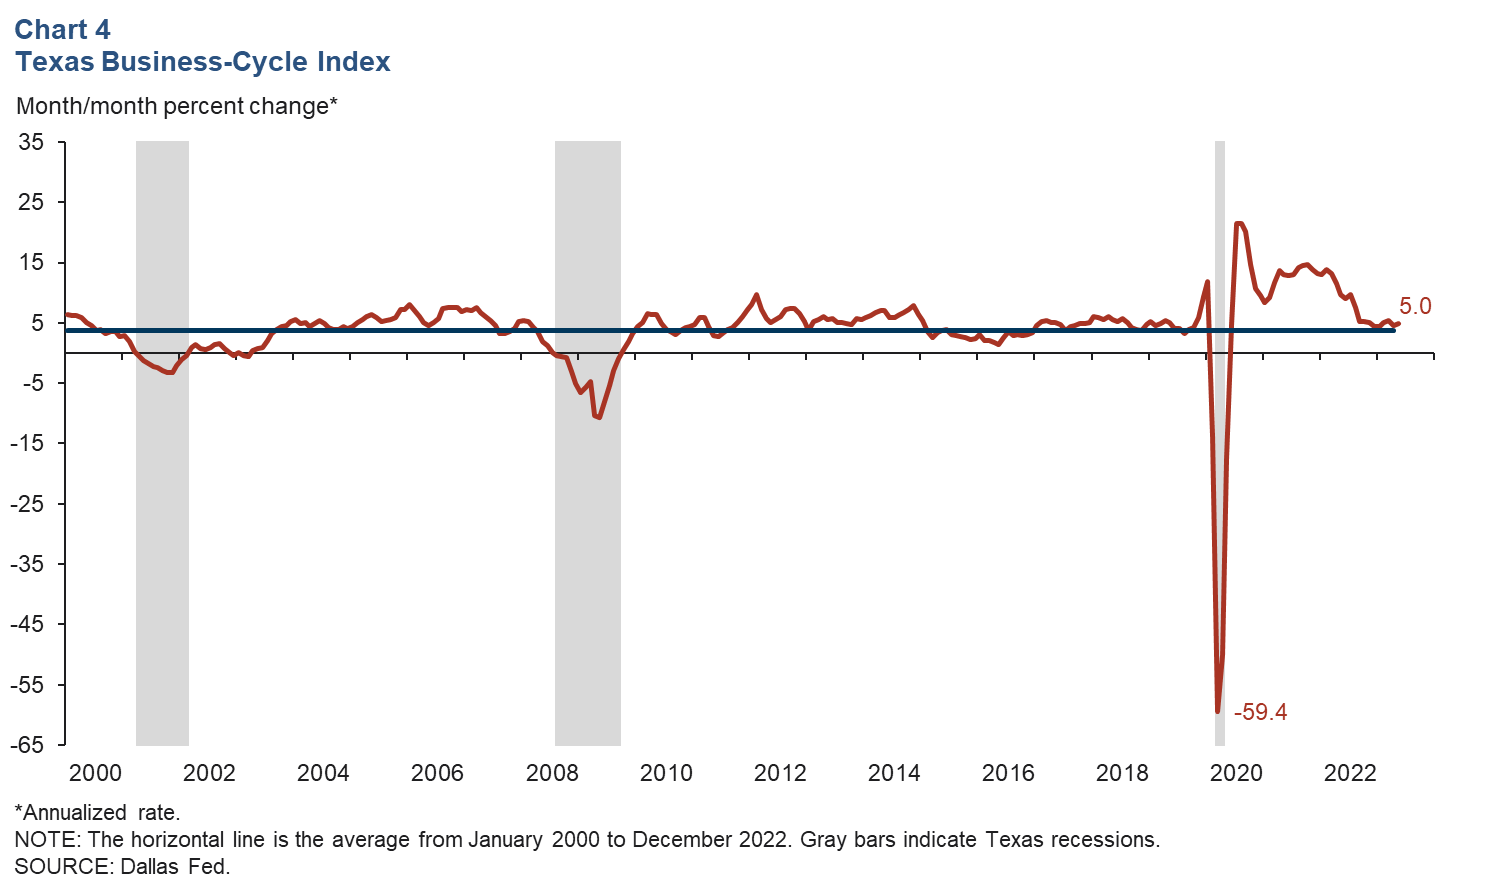
Business-cycle index
The Texas Business-Cycle Index—a composite of the unemployment rate, state payroll employment and gross state product—reflects underlying economic activity in the state. In May, the index increased at an above-average annualized pace of 5.0 percent (Chart 4). Year over year, the index was up 5.9 percent, largely due to continued strong employment growth.
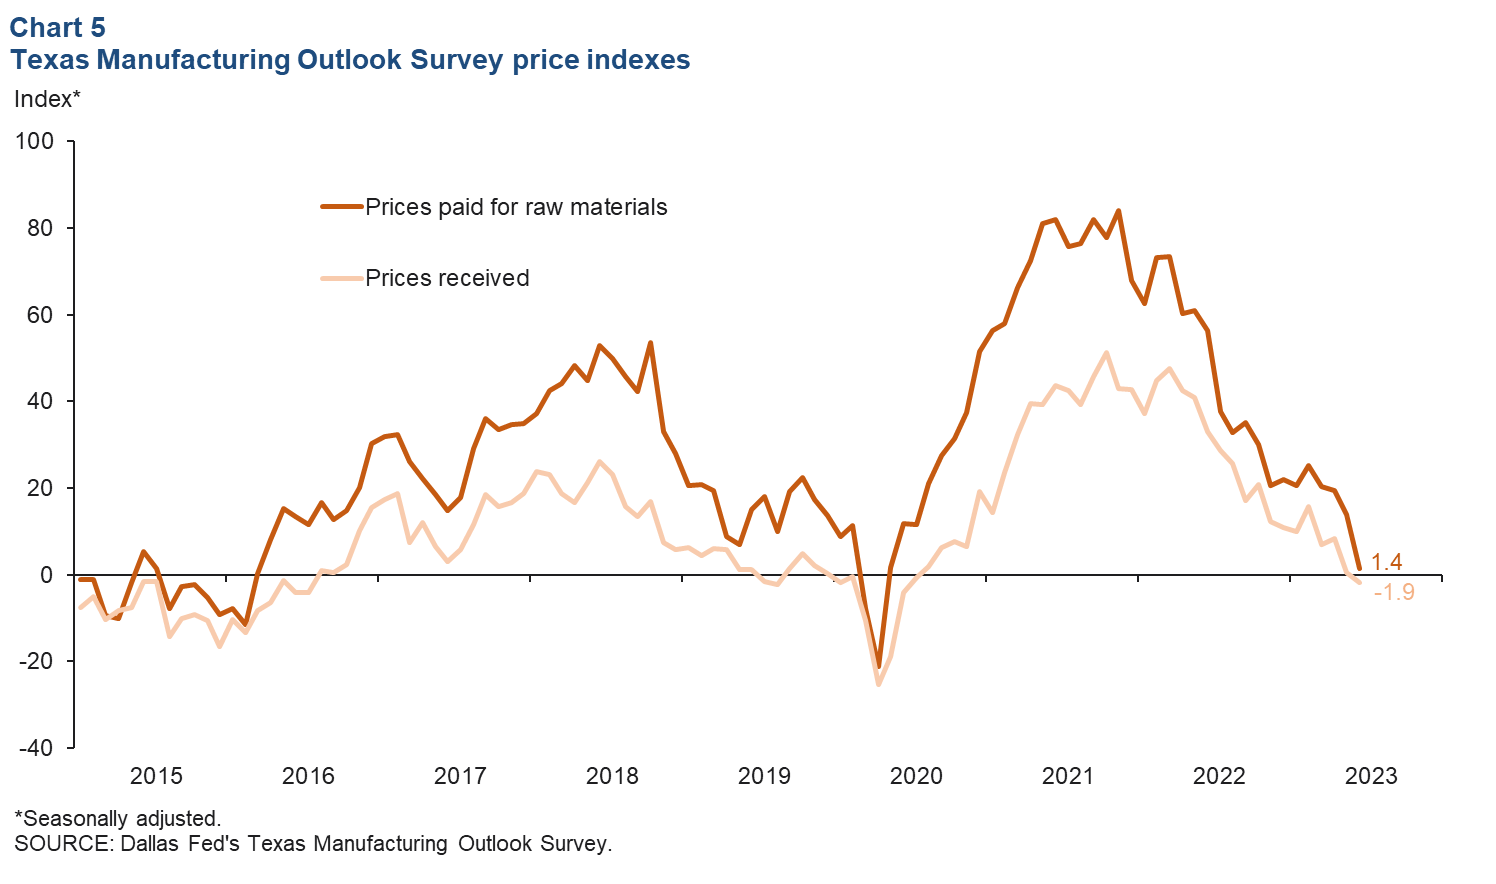
Texas Manufacturing Outlook Survey
Manufacturing price pressures eased in June, according to the Dallas Fed’s Texas Manufacturing Outlook Survey. The survey’s input and selling prices indexes fell further below their long-term averages in June (Chart 5). The raw materials prices index dropped to 1.4, suggesting no change in input costs. For the first time since July 2020, the prices received for finished goods index fell into negative territory, registering a reading of -1.9 and suggesting selling prices ticked down in June.
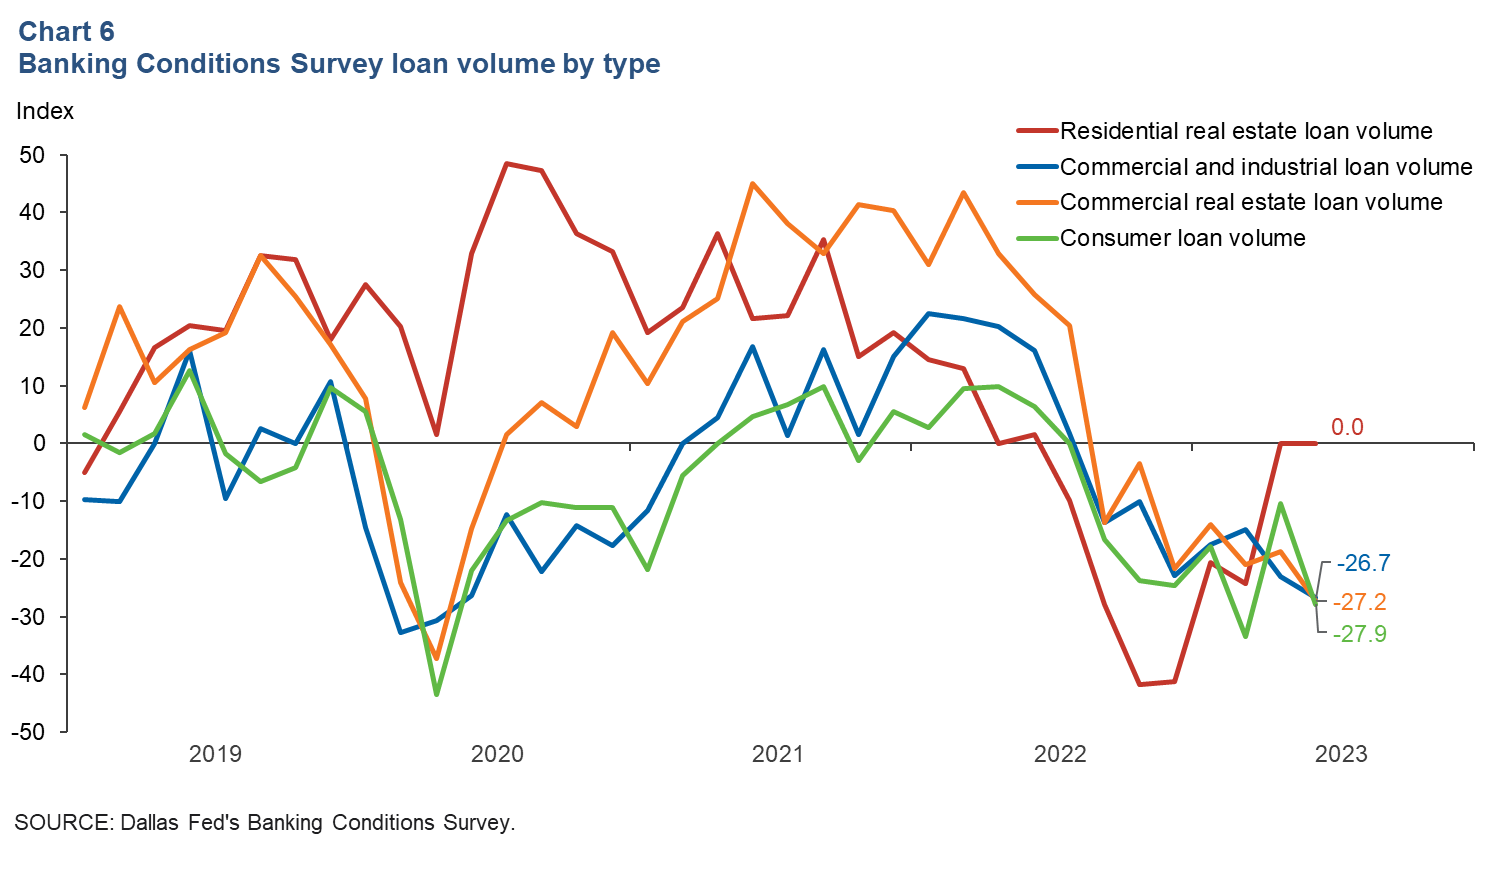
Banking Conditions Survey
The Dallas Fed's Banking Conditions Survey in June indicated continued declines in loan volumes (Chart 6). The commercial real estate loan volume index dropped to -27.2, and the commercial and industrial loan volume index fell 3.6 points to -26.7. The consumer loan volume index plunged 17.4 points to -27.9, while the residential real estate loan volume index remained at zero, indicating no growth in residential real estate lending.
NOTE: Data may not match previously published numbers due to revisions.
About Texas Economic Indicators
Questions or suggestions can be addressed to Mytiah Caldwell at Mytiah.Caldwell@dal.frb.org. Texas Economic Indicators is published every month during the week after state and metro employment data are released.