Dallas Fed Energy Survey

Oil and gas activity sees modest growth; outlook improves, but cost increases continue
Special questions this quarter focus on the energy transition’s expected impact on the price of oil, anticipated global oil consumption in 2050 relative to current levels, the short-term outlook for U.S. oil rigs, cost expectations for next year, impacts on lead times for interconnecting new well pads with the electricity grid in the Permian Basin, and competition with oil and gas support firms for hiring and retaining employees.
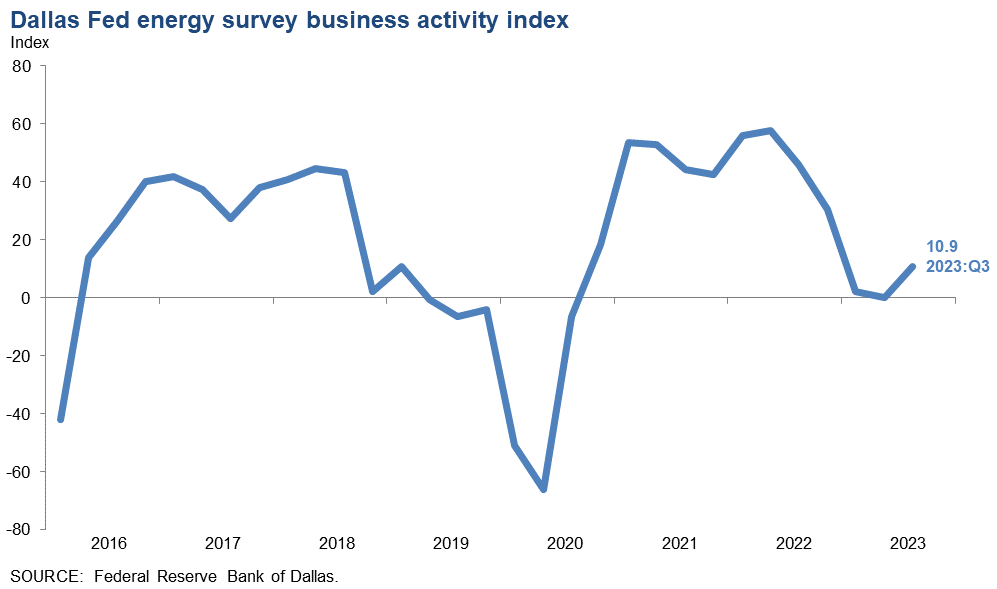
Activity in the oil and gas sector rose in third quarter 2023, according to oil and gas executives responding to the Dallas Fed Energy Survey. The business activity index, the survey’s broadest measure of conditions energy firms in the Eleventh District face, increased from 0 in the second quarter to 10.9 in the third quarter. The increase was driven by the exploration and production (E&P) side of the business. The business activity index for E&P firms jumped from 1.0 in the second quarter to 22.5 in the third quarter. However, the business activity index for oil and gas support services firms declined from -1.9 to -12.2.
Oil and natural gas production increased at a faster pace compared with the prior quarter, according to executives at E&P firms. The oil production index increased from 8.0 in the second quarter to 26.5 in the third. Meanwhile, the natural gas production index rose from 2.1 to 15.4.
Firms reported rising costs for an 11th consecutive quarter. Among oilfield services firms, the input cost index remained positive but declined from 41.2 to 33.4. Among E&P firms, the finding and development costs index edged up from 14.9 to 18.3. Additionally, the lease operating expenses index was essentially unchanged at 25.6.
Oilfield services firms reported continuing deterioration in most indicators. The equipment utilization index remained negative but edged up from -7.9 in the second quarter to -4.2 in the third. The operating margin index declined from -21.6 to -30.7. The index of prices received for services was relatively unchanged at 2.1.
The aggregate employment index posted an 11th consecutive positive reading but declined from 13.1 in the second quarter to 5.5 in the third. While the aggregate employment index was positive, the single-digit reading indicates employment was little changed from the prior quarter. The aggregate employee hours index was relatively unchanged at 9.6. Meanwhile, the aggregate wages and benefits index declined from 34.5 to 24.5.
The company outlook index moved into positive territory in the third quarter, jumping from -9.1 to 36.0. Optimism was more pronounced among E&P firms; the outlook index was 46.8 for E&P firms compared with 14.9 for services firms. The overall outlook uncertainty index remained positive but plunged 30 points to 6.8, suggesting that while uncertainty continued to increase on net, fewer firms noted a rise in the recent quarter.
On average, respondents expect a West Texas Intermediate (WTI) oil price of $88 per barrel at year-end 2023; responses ranged from $70 to $120 per barrel. Survey participants expect a Henry Hub natural gas price of $3.14 per million British thermal units (MMBtu) at year-end. For reference, WTI spot prices averaged $90.29 per barrel during the survey collection period, and Henry Hub spot prices averaged $2.68 per MMBtu.
Next release: December 20, 2023
Data were collected Sept. 13–21, and 147 energy firms responded. Of the respondents, 98 were exploration and production firms and 49 were oilfield services firms.
The Dallas Fed conducts the Dallas Fed Energy Survey quarterly to obtain a timely assessment of energy activity among oil and gas firms located or headquartered in the Eleventh District. Firms are asked whether business activity, employment, capital expenditures and other indicators increased, decreased or remained unchanged compared with the prior quarter and with the same quarter a year ago. Survey responses are used to calculate an index for each indicator. Each index is calculated by subtracting the percentage of respondents reporting a decrease from the percentage reporting an increase. When the share of firms reporting an increase exceeds the share reporting a decrease, the index will be greater than zero, suggesting the indicator has increased over the previous quarter. If the share of firms reporting a decrease exceeds the share reporting an increase, the index will be below zero, suggesting the indicator has decreased over the previous quarter.
Price Forecasts
West Texas Intermediate Crude
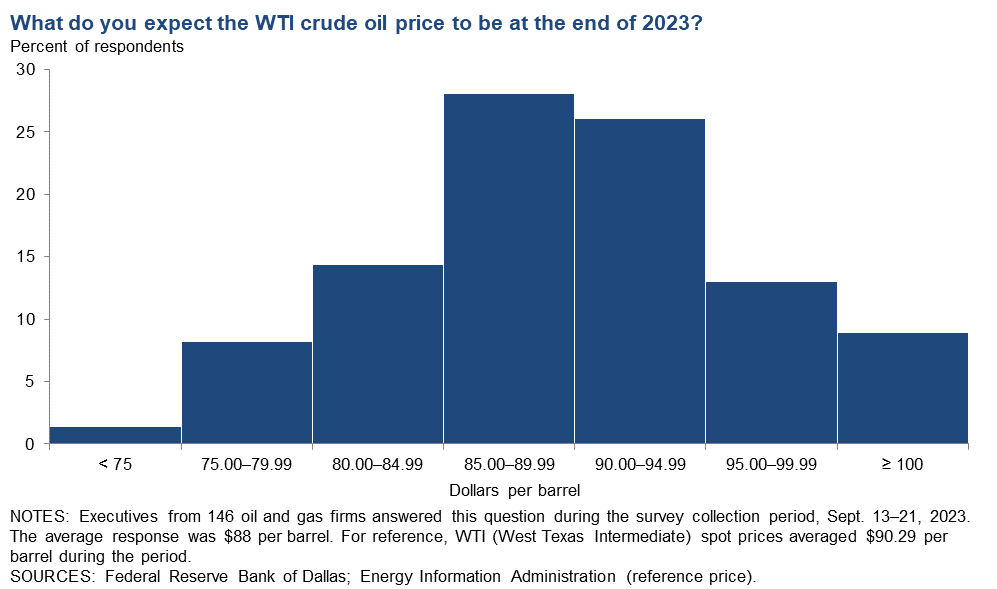
| West Texas Intermediate crude oil price (dollars per barrel), year-end 2023 | ||||
| Indicator | Survey Average | Low Forecast | High Forecast | Price During Survey |
Current quarter | $87.91 | $70.00 | $120.00 | $90.29 |
Prior quarter | $77.48 | $60.00 | $100.00 | $69.89 |
| NOTE: Price during survey is an average of daily spot prices during the survey collection period. SOURCES: Federal Reserve Bank of Dallas; Energy Information Administration. | ||||
Henry Hub Natural Gas
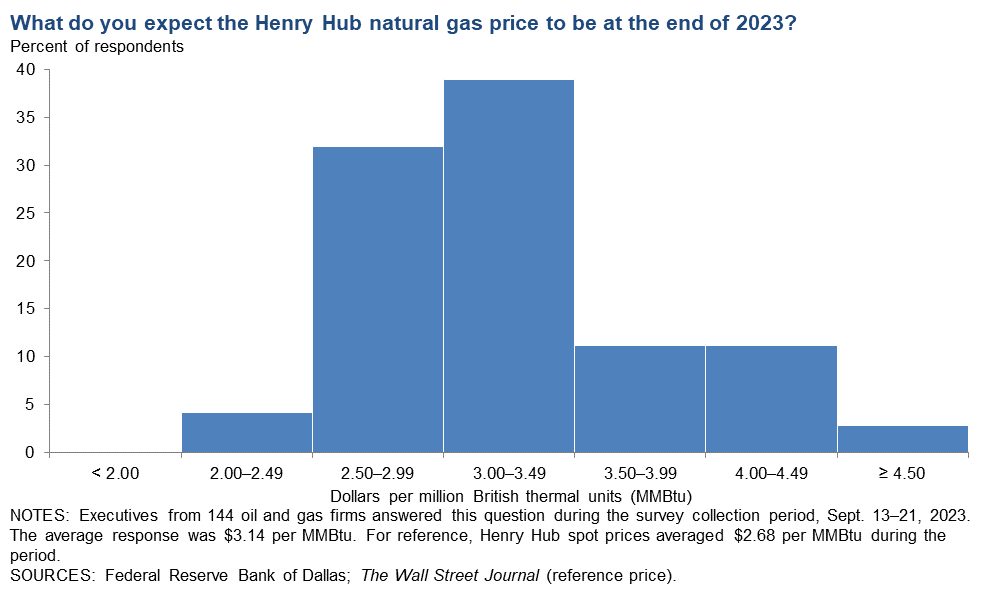
| Henry Hub natural gas price (dollars per MMBtu), year-end 2023 | ||||
| Indicator | Survey Average | Low Forecast | High Forecast | Price During Survey |
Current quarter | $3.14 | $2.00 | $7.00 | $2.68 |
Prior quarter | $2.97 | $1.80 | $6.00 | $2.03 |
| NOTE: Price during survey is an average of daily spot prices during the survey collection period. SOURCES: Federal Reserve Bank of Dallas; Energy Information Administration. | ||||
Special Questions
Data were collected Sept. 13–21; 142 oil and gas firms responded to the special questions survey.
All Firms
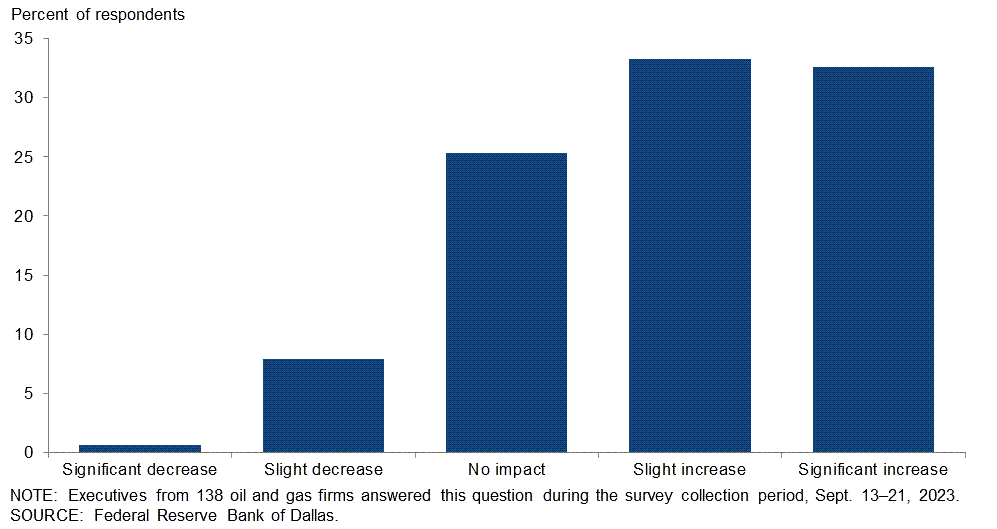
Looking five years ahead, what impact do you expect the energy transition to have on the price of oil?
The largest portion of the executives surveyed, 33.3 percent, said they expect the energy transition to slightly increase the price of oil looking five years ahead. Nearly as many respondents, 32.6 percent, anticipate a significant increase. Twenty-five percent expect no impact. Only 9 percent anticipate the energy transition to decrease the price of oil.
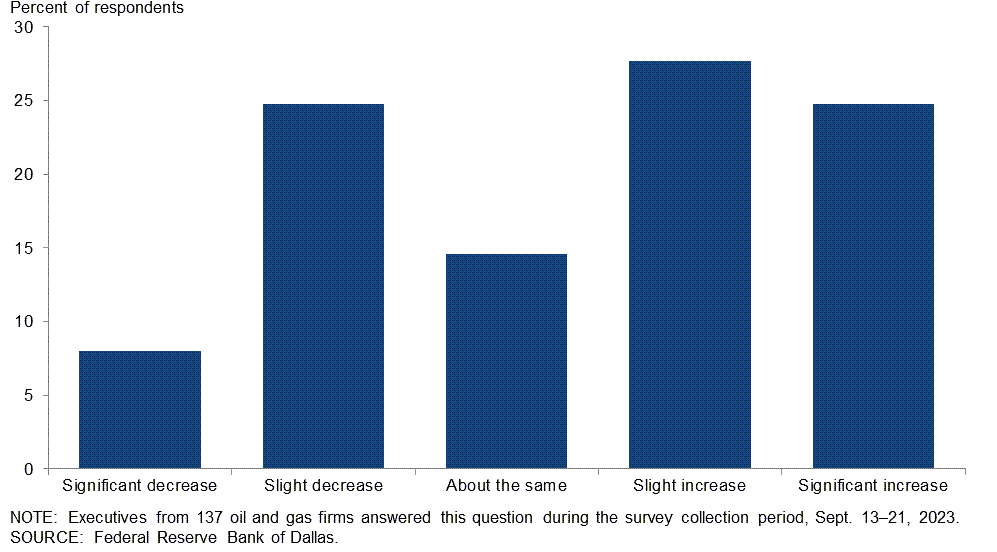
How do you expect global oil consumption in 2050 to compare with current levels?
The percentage of executives who expect global oil consumption in 2050 to be higher when compared to current levels exceeds the percentage that expects it to be lower. Of the executives surveyed, 28 percent expect global oil consumption in 2050 to be slightly higher when compared to current levels, and an additional 25 percent expect it to be significantly higher. Meanwhile, 25 percent of executives expect consumption to be slightly lower in 2050 when compared to current levels, and an additional 8 percent expect it to be significantly lower. Fifteen percent expect global oil consumption in 2050 to be close to current levels.
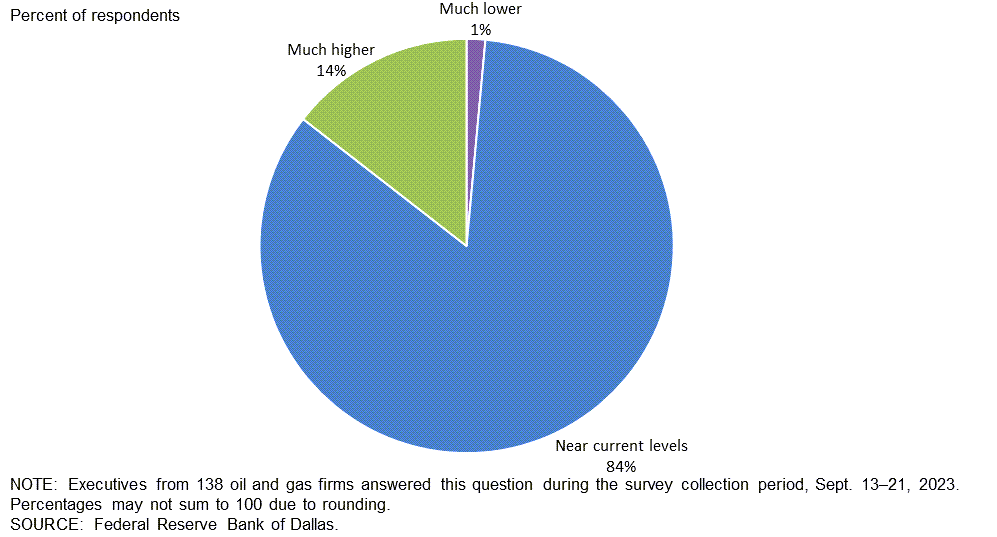
Do you expect the number of U.S. oil rigs six months from now to be much higher, much lower or near current levels?
Most executives, 84 percent, said they expect the number of U.S. oil rigs six months from now to be near current levels. Fourteen percent note they anticipate the number of U.S. oil rigs drilling six months from now to be much higher, while only 1 percent of executives said they expect it to be much lower.
A higher percentage of executives at support service firms expects the number of U.S. oil rigs to be much higher in six months compared with the percentage of E&P executives who agree. (See table for more detail.)
| Response | Percent of respondents (among each group) | ||
| All firms | E&P | Services | |
| Much lower | 1 | 1 | 2 |
| Near current levels | 84 | 88 | 76 |
| Much higher | 14 | 11 | 22 |
NOTES: Executives from 92 exploration and production firms and 46 oil and gas support services firms answered this question during the survey collection period, Sept. 13–21, 2023. The “all firms” column reports the percentage of the total 138 responses. Percentages may not sum to 100 due to rounding. |
|||
Exploration and Production (E&P) Firms
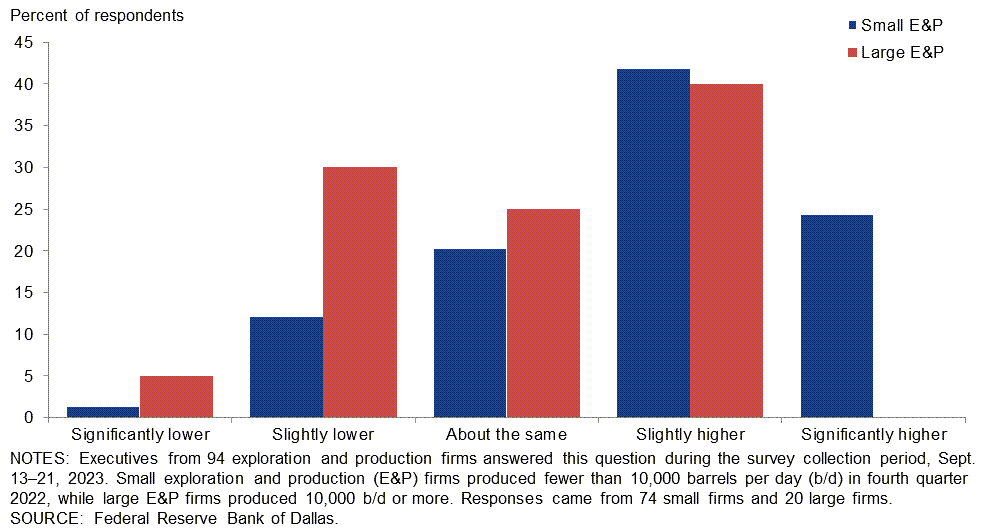
What are your expectations for your firm’s drilling and completion cost per well in 2024 versus 2023?
Firms were classified as “small” if they produced fewer than 10,000 barrels per day (b/d) and “large” if they produced 10,000 b/d or more. In the U.S., small E&P firms are greater in number, but large E&P firms represent the majority of production (more than 80 percent). A breakdown of the data is shown below.
Across all firms, 60 percent of executives expect drilling and completion costs per well in 2024 to be higher than in 2023, while 18 percent expect costs to be lower. Twenty-one percent expect no change.
A breakdown of the data for small E&P firms compared with large E&P firms is shown in the table below. Executives from small E&P firms were more likely to expect an increase in costs per well than those from large E&P firms. Meanwhile, executives from large E&P firms were more likely to expect a decrease in costs per well than those from small E&P firms.
| Response | Percent of respondents | ||
| All firms | Small E&P | Large E&P | |
| Significantly lower | 2 | 1 | 5 |
| Slightly lower | 16 | 12 | 30 |
| About the same | 21 | 20 | 25 |
| Slightly higher | 41 | 42 | 40 |
| Significantly higher | 19 | 24 | 0 |
| NOTES: Executives from 94 exploration and production firms answered this question during the survey collection period, Sept. 13–21, 2023. Small E&P firms produced fewer than 10,000 barrels per day (b/d) in fourth quarter 2022, while large E&P firms produced 10,000 b/d or more. Responses came from 74 small firms and 20 large firms. Percentages may not sum to 100 due to rounding. SOURCE: Federal Reserve Bank of Dallas. |
|||
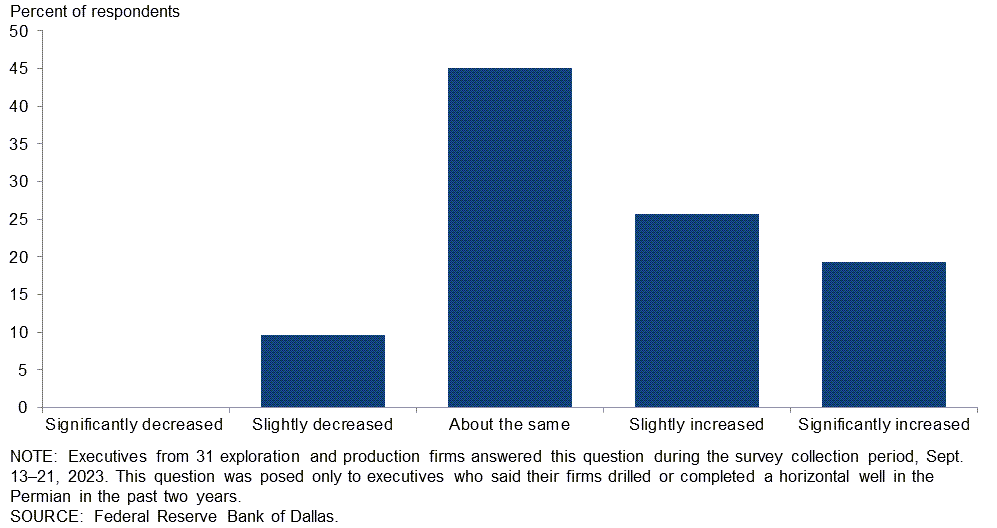
For your firm, how has the lead time to interconnect new well pads with power from the grid changed in the Permian Basin compared with one year ago?
Of the executives surveyed, 45 percent said the lead time to interconnect new well pads with power from the grid was about the same compared with one year ago. Twenty-six percent of executives said lead time slightly increased, and an additional 19 percent noted a significant increase. Only 10 percent said the lead time decreased relative to one year ago. This question was posed only to executives who said their firm drilled or completed a horizontal well in the Permian in the past two years.
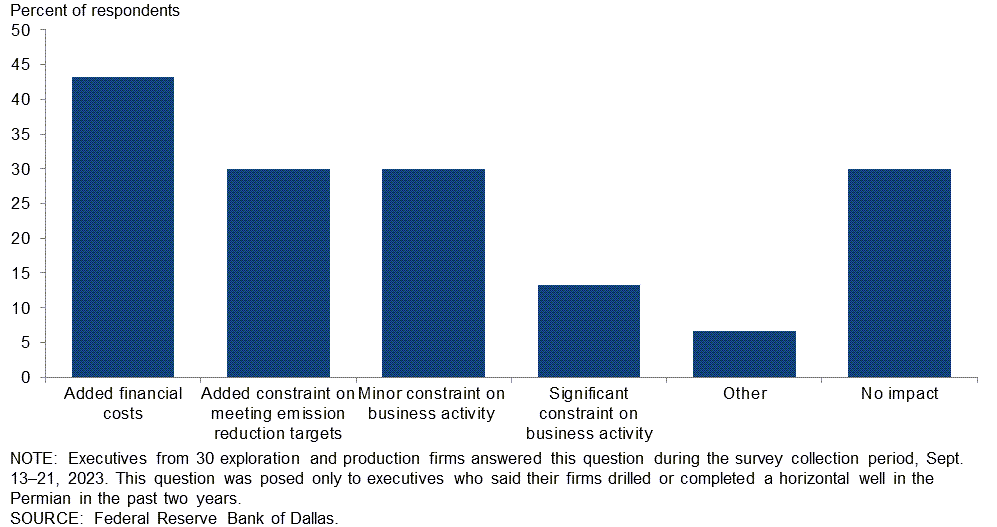
What impacts does the current lead time to interconnect new well pads with power from the grid in the Permian have on your firm? (Check all that apply.)
Forty-three percent of executives said the current lead time has added financial costs for their firms. “Added constraint on meeting emission reduction targets” and “minor constraint on business activity” were each selected by 30 percent of executives as impacts because of the current lead time. Thirty percent of executives note the current lead time has had no impact. This question was posed only to executives who said their firm drilled or completed a horizontal well in the Permian in the past two years.
Oil and Gas Support Services
Over the next five years, which sector do you believe your firm will compete with the most when it comes to hiring and retaining employees?
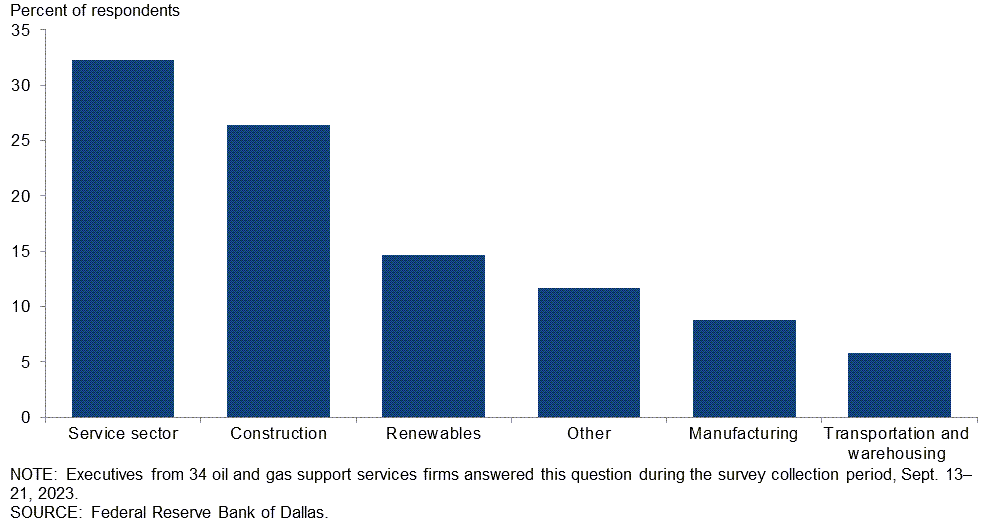
Of executives surveyed, 32 percent believe their firms will compete most with the service sector when it comes to hiring and retaining employees over the next five years. An additional 26 percent believe their firms will compete most with the construction sector for recruiting, followed by 15 percent citing the renewables sector.
Special Questions Comments
Exploration and Production (E&P) Firms
- While the development of alternative energy sources moves forward, I still believe the need for hydrocarbons in its various forms will increase over time.
- The energy transition impact on price will be hard to quantify. At first thought, one would think it would cause a decrease in prices from reduced demand. However, as we continue the transition and U.S. oil production likely declines (which will be dependent on a large array of factors, including government regulations, investors, etc.), OPEC will continue to gain a larger market share and is expected to reach levels higher than any point in history. As such, I would expect OPEC to continue holding prices above certain levels with more power to do so.
- Power interconnection issues need to be resolved to reduce emissions.
- In 18 to 24 months, oil supply from the United States will significantly disappoint and upset the global supply and demand balance. We think the forward curve is $50 to $100 light on the actual price per barrel. It will have a significant impact on the global economy.
- My firm builds and manages the overwhelming majority of its own power distribution, as we lack any trust in large distribution providers to meet our business needs on a timely basis.
- The energy transition will cause a very significant increase in overall energy costs to consumers but will have a lower impact on the price of oil, which is a worldwide commodity, manipulated by individual governments. Politicians are already carping on oil prices to try and dodge the fact that the increased electricity and gasoline costs being pushed down to the individual consumers are due to mandated taxes and subsidies funneled to political favorites.
- Wage increases have affected our lifting costs as well as our finding and development costs. This has been somewhat offset by the reduction in tubular costs in the past few months. Overall, our costs are flat to slightly lower than the past year, but we have seen a tremendous increase in costs versus three to five years ago.
- The narrative of an ''energy transition'' is completely false because this so-called transition does not exist. We are sitting on an ocean of oil and natural gas and, should we choose not to use it to its fullest, the economy in general, and the populace in particular, will be poorer for it. The standard of living is decreasing and that will continue.
- We are getting back into the Permian Basin. I was surprised at the horribly low natural gas prices for our secondary product.
Oil and Gas Support Services Firms
- Deep long wells require big rigs and full crews. Automation and artificial intelligence will not change that. No onshore rig has reduced the number of people on the rigs so far, and I don't expect that to change in the near future. Automation improves safety by moving people out of harm’s way but does not decrease the head count to run an efficient operation.
- The risk to our industry is in the outlook. If the outlook remains murky, or negative, it becomes a major headwind for hiring, financing, wealth generation, etc.
- Seismic data are now being used for carbon capture, use and storage, and saltwater disposal wells by oil and gas companies. Many of our customers are now also looking at exploration for the first time in many years, which I believe is reflecting the fact that the core of the unconventional areas is very mature, and companies are actively searching for what's next.
- After a summer of continued warnings about electricity usage from ERCOT, it feels like Texas is close to hitting an inflection point. Can residential, energy and industrial growth continue without major upgrades to our power infrastructure?
Additional Comments »
Historical data are available from first quarter 2016 to the most current release quarter.
Business Indicators: Quarter/Quarter
| Business Indicators: All Firms Current Quarter (versus previous quarter) | |||||
| Indicator | Current Index | Previous Index | % Reporting Increase | % Reporting No Change | % Reporting Decrease |
Level of Business Activity | 10.9 | 0.0 | 29.9 | 51.0 | 19.0 |
Capital Expenditures | 25.8 | 8.5 | 44.2 | 37.4 | 18.4 |
Supplier Delivery Time | 0.7 | –4.6 | 12.4 | 75.9 | 11.7 |
Employment | 5.5 | 13.1 | 17.7 | 70.1 | 12.2 |
Employee Hours | 9.6 | 10.5 | 19.2 | 71.2 | 9.6 |
Wages and Benefits | 24.5 | 34.5 | 27.9 | 68.7 | 3.4 |
| Indicator | Current Index | Previous Index | % Reporting Improved | % Reporting No Change | % Reporting Worsened |
Company Outlook | 36.0 | –9.1 | 46.8 | 42.4 | 10.8 |
| Indicator | Current Index | Previous Index | % Reporting Increase | % Reporting No Change | % Reporting Decrease |
Uncertainty | 6.8 | 36.9 | 26.7 | 53.4 | 19.9 |
| Business Indicators: E&P Firms Current Quarter (versus previous quarter) | |||||
| Indicator | Current Index | Previous Index | % Reporting Increase | % Reporting No Change | % Reporting Decrease |
Level of Business Activity | 22.5 | 1.0 | 32.7 | 57.1 | 10.2 |
Oil Production | 26.5 | 8.0 | 41.8 | 42.9 | 15.3 |
Natural Gas Wellhead Production | 15.4 | 2.1 | 34.0 | 47.4 | 18.6 |
Capital Expenditures | 30.7 | 9.9 | 48.0 | 34.7 | 17.3 |
Expected Level of Capital Expenditures Next Year | 35.7 | 1.9 | 49.0 | 37.8 | 13.3 |
Supplier Delivery Time | 0.0 | –7.0 | 12.4 | 75.3 | 12.4 |
Employment | 4.0 | 10.8 | 12.2 | 79.6 | 8.2 |
Employee Hours | 9.3 | 6.9 | 13.4 | 82.5 | 4.1 |
Wages and Benefits | 20.4 | 28.0 | 22.4 | 75.5 | 2.0 |
Finding and Development Costs | 18.3 | 14.9 | 31.6 | 55.1 | 13.3 |
Lease Operating Expenses | 25.6 | 26.0 | 32.7 | 60.2 | 7.1 |
| Indicator | Current Index | Previous Index | % Reporting Improved | % Reporting No Change | % Reporting Worsened |
Company Outlook | 46.8 | –8.4 | 53.3 | 40.2 | 6.5 |
| Indicator | Current Index | Previous Index | % Reporting Increase | % Reporting No Change | % Reporting Decrease |
Uncertainty | –1.0 | 41.6 | 20.6 | 57.7 | 21.6 |
| Business Indicators: O&G Support Services Firms Current Quarter (versus previous quarter) | |||||
| Indicator | Current Index | Previous Index | % Reporting Increase | % Reporting No Change | % Reporting Decrease |
Level of Business Activity | –12.2 | –1.9 | 24.5 | 38.8 | 36.7 |
Utilization of Equipment | –4.2 | –7.9 | 27.1 | 41.7 | 31.3 |
Capital Expenditures | 16.3 | 5.9 | 36.7 | 42.9 | 20.4 |
Supplier Delivery Time | 2.1 | 0.0 | 12.5 | 77.1 | 10.4 |
Lag Time in Delivery of Firm's Services | 2.0 | –2.0 | 10.2 | 81.6 | 8.2 |
Employment | 8.2 | 17.6 | 28.6 | 51.0 | 20.4 |
Employment Hours | 10.2 | 17.7 | 30.6 | 49.0 | 20.4 |
Wages and Benefits | 32.7 | 47.1 | 38.8 | 55.1 | 6.1 |
Input Costs | 33.4 | 41.2 | 41.7 | 50.0 | 8.3 |
Prices Received for Services | 2.1 | 3.9 | 18.4 | 65.3 | 16.3 |
Operating Margin | –30.7 | –21.6 | 12.2 | 44.9 | 42.9 |
| Indicator | Current Index | Previous Index | % Reporting Improved | % Reporting No Change | % Reporting Worsened |
Company Outlook | 14.9 | –10.4 | 34.0 | 46.8 | 19.1 |
| Indicator | Current Index | Previous Index | % Reporting Increase | % Reporting No Change | % Reporting Decrease |
Uncertainty | 22.5 | 27.5 | 38.8 | 44.9 | 16.3 |
Business Indicators: Year/Year
| Business Indicators: All Firms Current Quarter (versus same quarter a year ago) | |||||
| Indicator | Current Index | Previous Index | % Reporting Increase | % Reporting No Change | % Reporting Decrease |
Level of Business Activity | 15.8 | 17.2 | 38.8 | 38.1 | 23.0 |
Capital Expenditures | 25.3 | 19.4 | 47.8 | 29.7 | 22.5 |
Supplier Delivery Time | –3.7 | –2.8 | 22.6 | 51.1 | 26.3 |
Employment | 16.6 | 26.6 | 28.1 | 60.4 | 11.5 |
Employee Hours | 15.7 | 24.0 | 24.3 | 67.1 | 8.6 |
Wages and Benefits | 55.7 | 55.5 | 59.3 | 37.1 | 3.6 |
| Indicator | Current Index | Previous Index | % Reporting Improved | % Reporting No Change | % Reporting Worsened |
Company Outlook | 28.5 | –6.5 | 50.0 | 28.5 | 21.5 |
| Business Indicators: E&P Firms Current Quarter (versus same quarter a year ago) | |||||
| Indicator | Current Index | Previous Index | % Reporting Increase | % Reporting No Change | % Reporting Decrease |
Level of Business Activity | 20.6 | 3.2 | 38.0 | 44.6 | 17.4 |
Oil Production | 29.3 | 15.5 | 48.9 | 31.5 | 19.6 |
Natural Gas Wellhead Production | 13.5 | 3.1 | 34.8 | 43.8 | 21.3 |
Capital Expenditures | 25.0 | 14.9 | 45.7 | 33.7 | 20.7 |
Expected Level of Capital Expenditures Next Year | 36.6 | 13.4 | 53.8 | 29.0 | 17.2 |
Supplier Delivery Time | –9.9 | –6.3 | 17.6 | 54.9 | 27.5 |
Employment | 16.3 | 14.5 | 22.8 | 70.7 | 6.5 |
Employee Hours | 11.9 | 10.4 | 15.1 | 81.7 | 3.2 |
Wages and Benefits | 48.4 | 52.1 | 51.6 | 45.2 | 3.2 |
Finding and Development Costs | 37.3 | 45.2 | 51.6 | 34.1 | 14.3 |
Lease Operating Expenses | 43.9 | 49.5 | 54.9 | 34.1 | 11.0 |
| Indicator | Current Index | Previous Index | % Reporting Improved | % Reporting No Change | % Reporting Worsened |
Company Outlook | 32.6 | –23.6 | 50.0 | 32.6 | 17.4 |
| Business Indicators: O&G Support Services Firms Current Quarter (versus same quarter a year ago) | |||||
| Indicator | Current Index | Previous Index | % Reporting Increase | % Reporting No Change | % Reporting Decrease |
Level of Business Activity | 6.4 | 44.0 | 40.4 | 25.5 | 34.0 |
Utilization of Equipment | 6.5 | 40.0 | 39.1 | 28.3 | 32.6 |
Capital Expenditures | 26.1 | 28.0 | 52.2 | 21.7 | 26.1 |
Supplier Delivery Time | 8.7 | 4.0 | 32.6 | 43.5 | 23.9 |
Lag Time in Delivery of Firm's Services | –2.2 | 8.0 | 17.4 | 63.0 | 19.6 |
Employment | 17.0 | 50.0 | 38.3 | 40.4 | 21.3 |
Employment Hours | 23.5 | 50.0 | 42.6 | 38.3 | 19.1 |
Wages and Benefits | 70.2 | 62.0 | 74.5 | 21.3 | 4.3 |
Input Costs | 63.1 | 65.3 | 69.6 | 23.9 | 6.5 |
Prices Received for Services | 27.7 | 42.0 | 44.7 | 38.3 | 17.0 |
Operating Margin | 0.0 | 16.0 | 38.3 | 23.4 | 38.3 |
| Indicator | Current Index | Previous Index | % Reporting Improved | % Reporting No Change | % Reporting Worsened |
Company Outlook | 20.5 | 24.5 | 50.0 | 20.5 | 29.5 |
Activity Chart
Comments from Survey Respondents
These comments are from respondents’ completed surveys and have been edited for publication. Comments from the Special Questions survey can be found below the special questions.
Exploration and Production (E&P) Firms
- The following are issues that are affecting our business. First, capital discipline will be tested among operators if the oil price remains consistently over $90 per barrel. Second, refracks may be more popular. Third, services costs have come down but need to come down further. Fourth, automation and efficiency savings are not trickling down to services costs fast enough.
- Power distribution in the West Texas region is materially behind demand, and new power distribution construction is months to years behind schedule. Power distribution companies cannot keep their commitments on schedule. Growing West Texas power demand while power supply remains stagnant could lead to moderated oil and gas investment.
- Investors still do not want oil and gas exposure despite healthy risk-adjusted returns. I don't think they are coming back. It's different this time.
- As the White House administration continues its policies to slow down exploration and hence production, it should have the effect of increasing commodity prices.
- It appears that the OPEC+ cuts are finally having an impact. What concerns me most is that the rig count in the Middle East has been down since the onset of the pandemic—down to 329 versus 430 at the start of the pandemic.
- We ramped up from zero to five rigs from July 2022 to January 2023. Right now we are maintaining five rigs. When we first added rigs (July 2022), that was the peak in service costs, and since then we have been able to renegotiate contracts lower and have seen pipe and sand costs come down.
- The current natural gas price is not sustainable for exploration or development for small operators.
- Increased regulation is affecting our business. In a business full of uncertainty, one thing is certain, and that is the administration wants to destroy the American oil and gas independent producer.
- Low natural gas prices have slowed development of new projects. Most of any increase in net oil revenue attributable to increased oil prices has been siphoned off by inflation in capital expenditures and operating expenditures and increasingly expensive debt service due to increasing interest rates. Our bank has eliminated the position of our commercial bank officer attending to independent oil companies and moved her off to some other activity. Obviously, our bank doesn’t want any oil and gas clients anymore. Our prior tax certified public accountant retired last year, so I had to interview firms and independent tax certified public accountants about taking on our account. A third of potential firms, upon asking and learning that the nature of our business is oil and gas exploration and production (E&P), refused to take my company on as a new client. Their explanation to me was uniformly, "We only want clients in reputable industries."
- Uncertainty due to the attack on the oil and gas industry by the administration is an issue affecting our business. The country cannot get to green without oil and gas for many years into the future.
- The regulatory environment continues to be challenging.
- Outside capital for small independents remains almost nonexistent, which limits investment to organic cash flow. Interest in non-shale conventional production is very limited.
- Forcing winners and losers has become a political pastime and is so nasty that small operators are being run out of business.
- Natural gas prices are low, and it is a difficult environment. The cost to drill wells has decreased but not enough. There needs to be a push to increase demand for natural gas.
- We are very bullish on the price of oil. Shale production has flatlined, and OPEC is once again in the driver's seat. Oil demand will remain north of 100 million barrels per day for decades, and worldwide, new field discoveries are not keeping up with the produced volumes. The lack of inexpensive energy in the future will curtail worldwide economic growth. At some future price point, renewables will finally become economically viable, even without massive government subsidies.
- The present administration, claiming global warming and harm done by the fossil fuel industry, will maintain higher prices. They now cannot release our strategic reserves due to a huge drawdown.
- The withdrawal or difficulty of obtaining federal lands for oil and gas leasing is discouraging, as we have from time to time bid and owned such leases.
Oil and Gas Support Services Firms
- E&P companies must make an effort to partner with their service providers to promote win-win working relationships. U.S. upstream participants must sit on the same side of the table to overcome challenges and ensure that our industry remains healthy and stable.
- I’m thankful that we are predominately operating in Texas, which continues to value the critical importance of hydrocarbon extraction as a cornerstone of a modern society.
- E&P mergers are creating a much more efficient oilfield but certainly more concentrated customer base for equipment and service providers. The barriers to entry continue to increase for new service providers. At what point do federal regulators begin to scrutinize these mergers?
- Rising interest rates are negatively impacting available free cash flow to deploy to heavy equipment capital expenditures. Lead times for major components from major manufacturers continue to increase year over year and compared with the past two quarters. The outlook is not improving, as manufacturers continue to miss recent delivery deadlines for equipment ordered a year ago. We will scale back 2024 new equipment capital expenditures due to an inability to source major components from manufacturers until 2025 and contemplation of refinancing notes—at anticipated interest rates higher than current rates—so we are focused on our balance sheet. Lack of available and trained hourly mechanics is causing problems and requires substantial increases in wages. Medical insurance cost for 2024 is approximately a 10 percent year-over-year increase. Vehicle, property and casualty insurance rates for 2024 are also increasing more than 10 percent. We are required to increase what we charge our customers for our services, which so far we have been able to do because of impending shortages of available equipment needed in our industry (natural gas compression) to provide our services. Bottom line, inflation pressures are not abating and are far from transitory.
Questions regarding the Dallas Fed Energy Survey can be addressed to Michael Plante at Michael.Plante@dal.frb.org or Kunal Patel at Kunal.Patel@dal.frb.org.
Sign up for our email alert to be automatically notified as soon as the latest Dallas Fed Energy Survey is released on the web.