
Dallas Fed Energy Survey
Oil and gas activity slips again on elevated uncertainty, higher costs
Special questions focus on the viability of shale oil drilling internationally, the impact of regulatory changes on well break-evens and production, theft in the oil field, uncertainty and investment decisions, changes in hedging activity, artificial intelligence (AI) and the lifespan of equipment, and oilfield equipment sourcing from China.
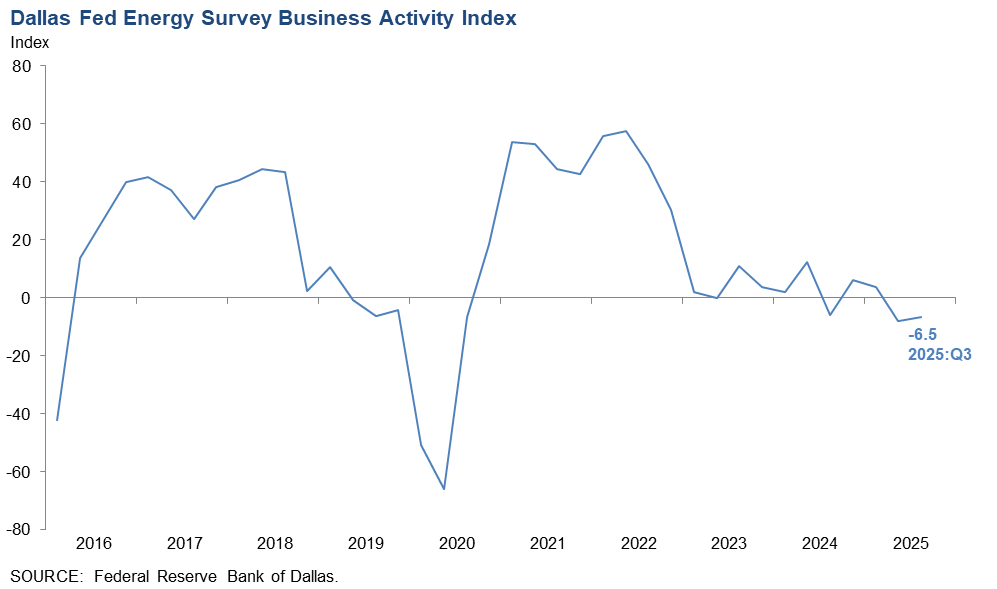
Activity in the oil and gas sector declined slightly in the third quarter of 2025, according to oil and gas executives responding to the Dallas Fed Energy Survey. The business activity index, the survey’s broadest measure of the conditions energy firms face in the Eleventh District, remained negative but edged up from -8.1 in the second quarter to -6.5 in the third quarter.
The company outlook index fell from -6.4 in the second quarter to -17.6, suggesting pessimism among firms. Meanwhile, the outlook uncertainty index remained elevated but edged down from 47.1 to 44.6.
Oil and gas production declined slightly in the third quarter, according to executives at exploration and production firms. The oil production index remained negative and was relatively unchanged at -8.6 in the third quarter. Similarly, the natural gas production index was relatively unchanged at -3.2.
Firms reported rising costs, with all series above their averages. Among oilfield services firms, input costs rose but at a slightly slower pace than the previous quarter as the input cost index declined slightly from 40.0 to 34.8. Among E&P firms, the finding and development costs index increased from 11.4 to 22.0. Also, the lease operating expenses index increased from 28.1 to 36.9.
Oilfield services firms reported modest deterioration in nearly all indicators. The equipment utilization index for oilfield services firms fell slightly from -4.6 to -13.0. The operating margin index was relatively unchanged at -31.8, indicating margins compressed at a similar rate. Meanwhile, the prices received for services index declined slightly from -17.7 to -26.1.
Overall, demand for employees was relatively unchanged and hours worked was also little changed. The aggregate employment index advanced from -6.6 in the second quarter to -1.5 in the third. Additionally, the aggregate employee hours index was relatively unchanged at -3.7. Meanwhile, the aggregate wages and benefits index was relatively unchanged at 11.5.
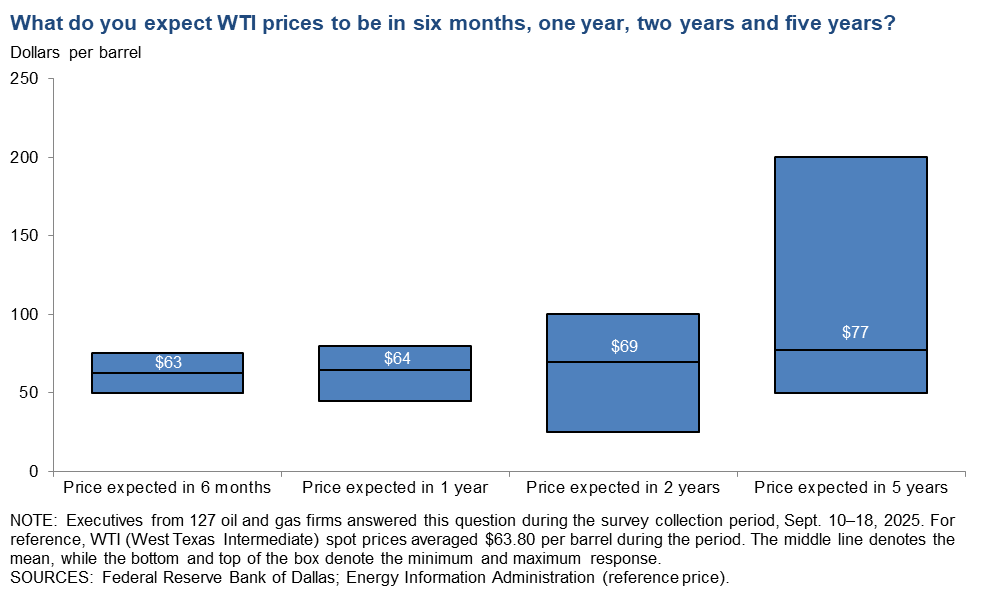
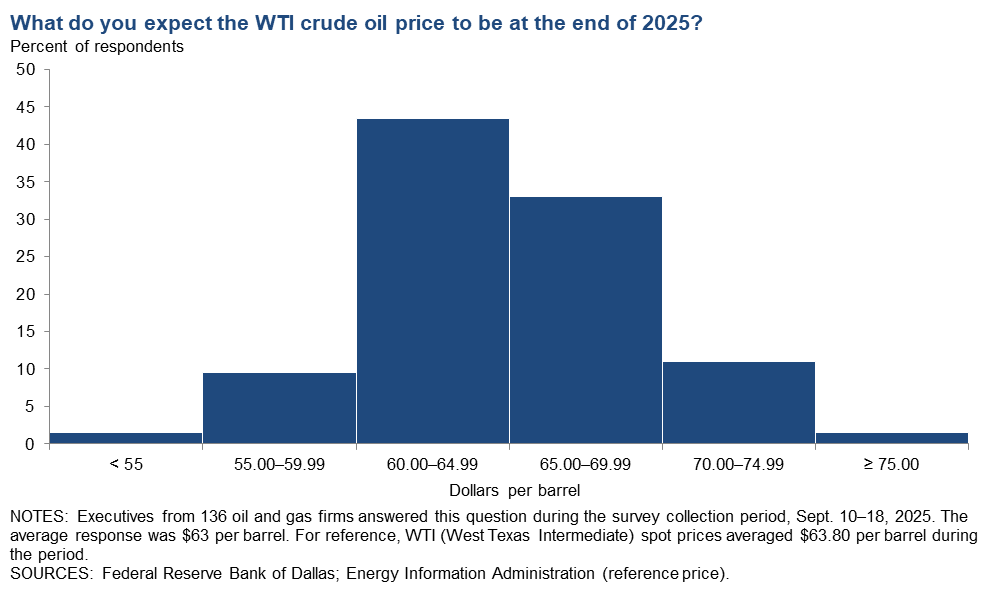
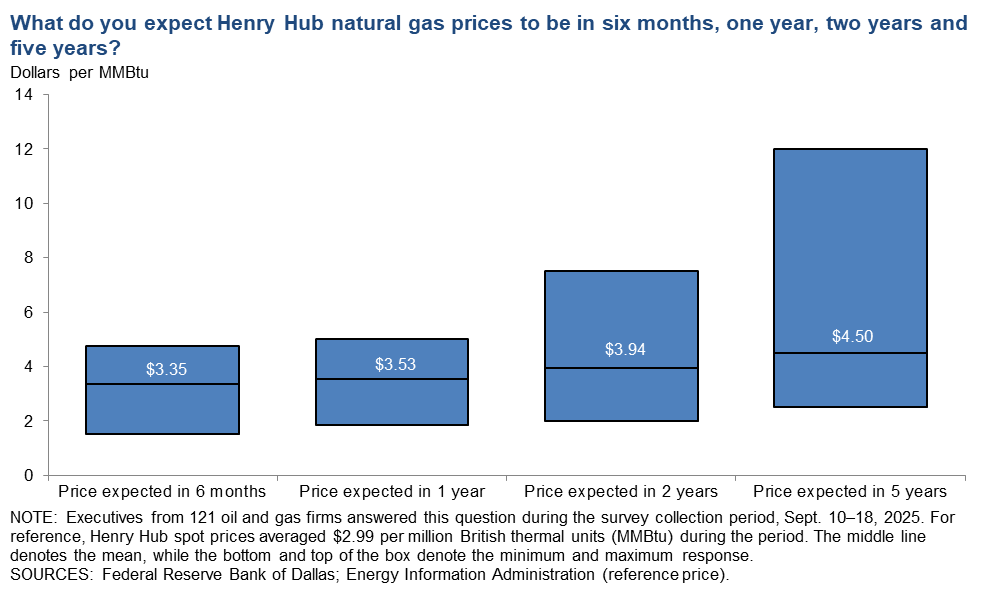
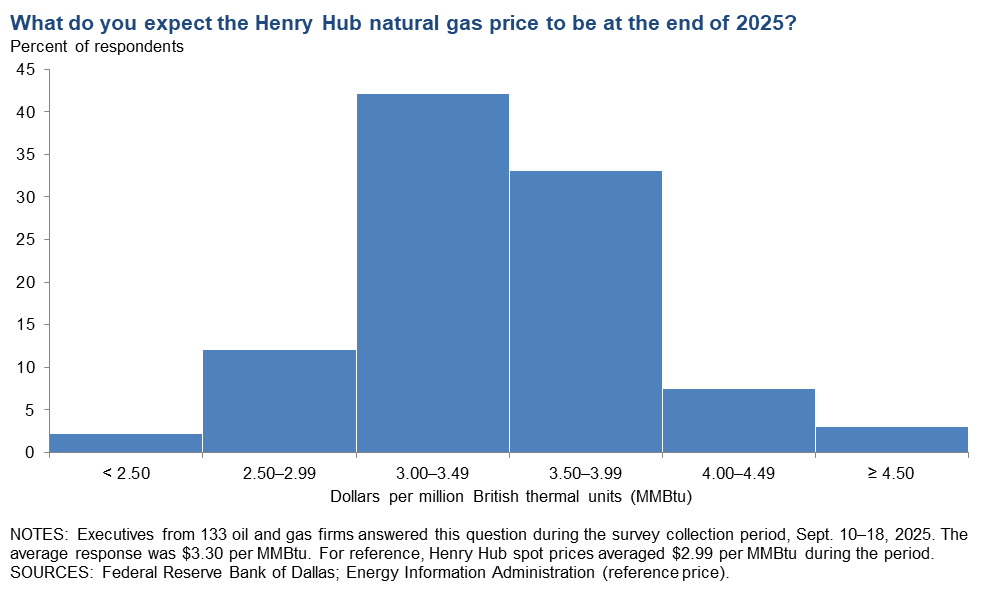
On average, respondents expect a West Texas Intermediate (WTI) oil price of $63 per barrel at year-end 2025; responses ranged from $50 to $80 per barrel. When asked about longer-term expectations, respondents on average said they expect a WTI oil price of $69 per barrel two years from now and $77 per barrel five years from now. Survey participants foresee a Henry Hub natural gas price of $3.30 per million British thermal units (MMBtu) at year-end 2025. When asked about longer-term expectations, respondents on average said they anticipate a Henry Hub gas price of $3.94 per MMBtu two years from now and $4.50 per MMBtu five years from now. For reference, WTI spot prices averaged $63.80 per barrel during the survey collection period, and Henry Hub spot prices averaged $2.99 per MMBtu.
Next release: December 17, 2025
Data were collected September 10–18, and 139 energy firms responded. Of the respondents, 93 were exploration and production firms and 46 were oilfield services firms.
The Dallas Fed conducts the Dallas Fed Energy Survey quarterly to obtain a timely assessment of energy activity among oil and gas firms located or headquartered in the Eleventh District. The Eleventh District encompasses Texas, northern Louisiana and southern New Mexico. Firms are asked whether business activity, employment, capital expenditures and other indicators increased, decreased or remained unchanged compared with the prior quarter and with the same quarter a year ago. Survey responses are used to calculate an index for each indicator. Each index is calculated by subtracting the percentage of respondents reporting a decrease from the percentage reporting an increase. When the share of firms reporting an increase exceeds the share reporting a decrease, the index will be greater than zero, suggesting the indicator has increased over the previous quarter. If the share of firms reporting a decrease exceeds the share reporting an increase, the index will be below zero, suggesting the indicator has decreased over the previous quarter.
Price Forecasts
West Texas Intermediate Crude
| West Texas Intermediate crude oil price, year-end 2025 | ||||
| Indicator | Survey Average | Low Forecast | High Forecast | Price During Survey |
Current quarter | $63.06 | $50.00 | $80.00 | $63.80 |
Prior quarter | $68.18 | $50.00 | $85.00 | $69.81 |
| NOTE: Price during survey is an average of daily spot prices during the survey collection period. SOURCES: Federal Reserve Bank of Dallas; Energy Information Administration. | ||||
Henry Hub Natural Gas
| Henry Hub natural gas price, year-end 2025 | ||||
| Indicator | Survey Average | Low Forecast | High Forecast | Price During Survey |
Current quarter | $3.30 | $2.20 | $4.75 | $2.99 |
Prior quarter | $3.66 | $1.75 | $5.00 | $3.30 |
| NOTE: Price during survey is an average of daily spot prices during the survey collection period. SOURCES: Federal Reserve Bank of Dallas; Energy Information Administration. | ||||
Special Questions
Data were collected September 10–18; 138 oil and gas firms responded to the special questions survey.
All firms
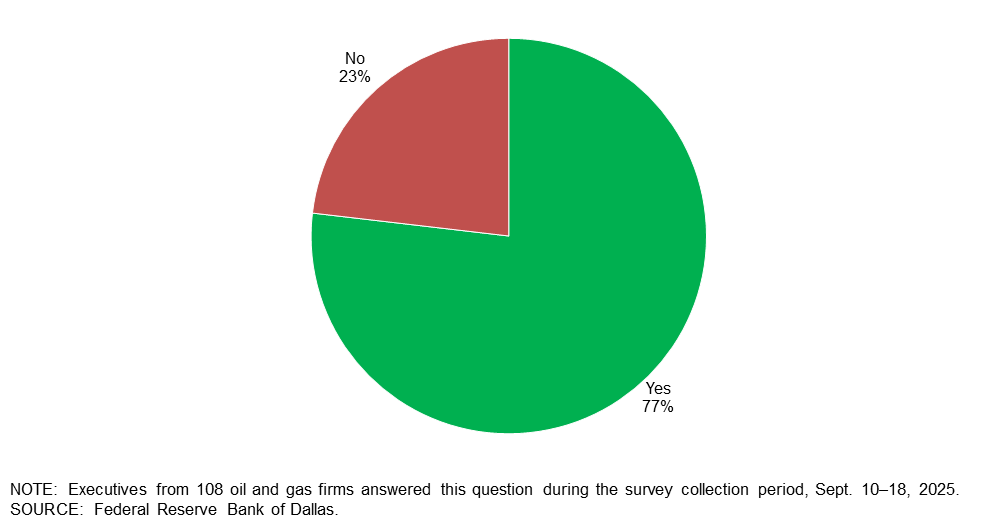
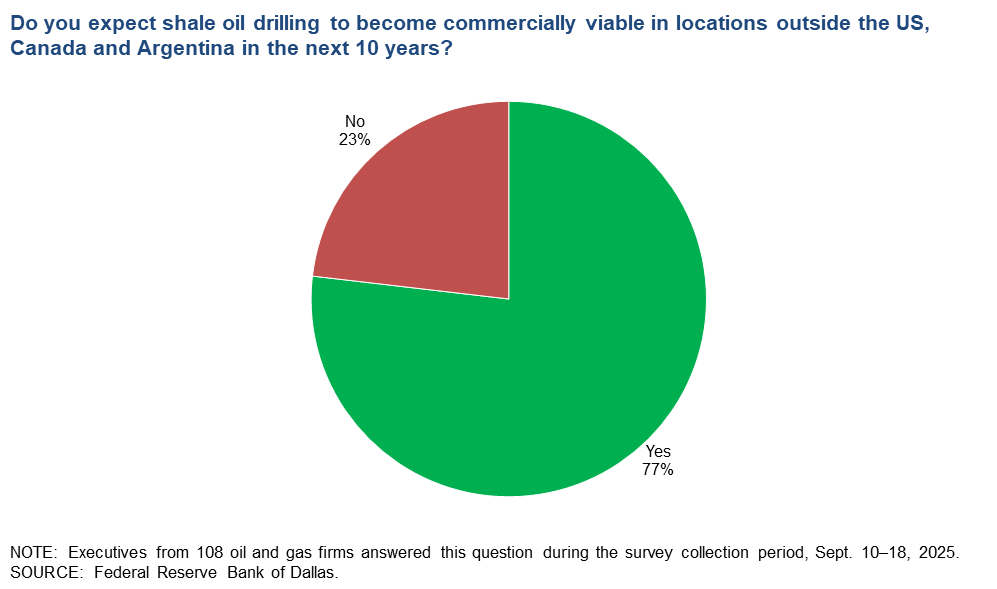
Do you expect shale oil drilling to become commercially viable in international locations outside the United States, Canada and Argentina in the next 10 years?
Seventy-seven percent of executives said they expect shale oil drilling to become commercially viable in international locations outside United States, Canada and Argentina in the next 10 years. The remaining 23 percent don’t expect so.
Exploration and production (E&P) firms
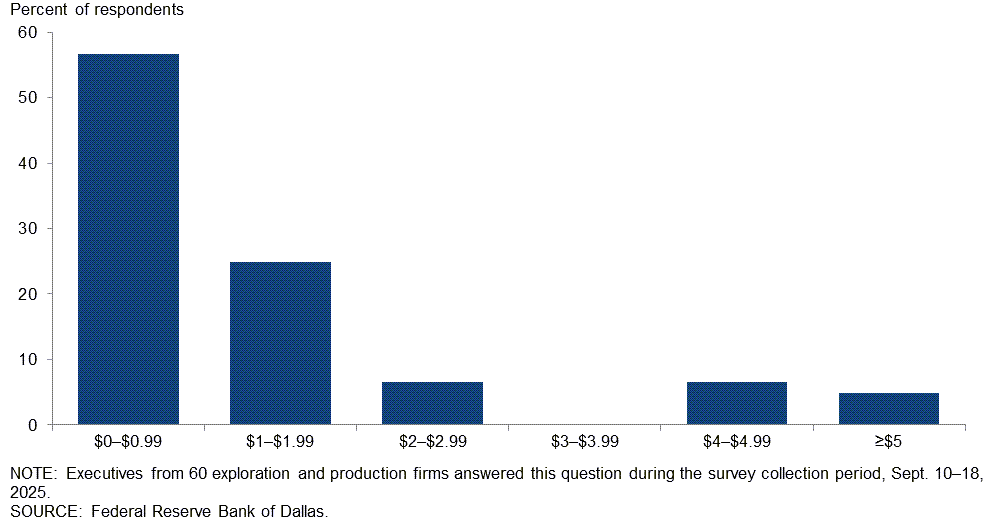
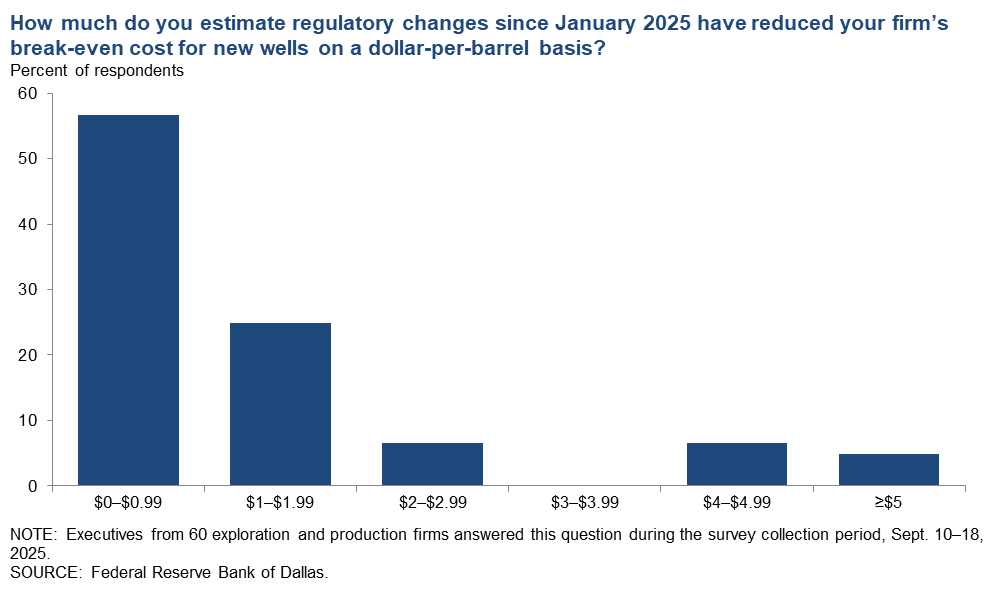
How much do you estimate regulatory changes since January 2025 have reduced your firm’s break-even cost for new wells on a dollar-per-barrel basis?
Most executives, 57 percent, estimate regulatory changes since January 2025 have reduced their firms’ break-even costs for new wells by less than $1 per barrel. An additional 25 percent estimate reductions between $1–$1.99 per barrel.
A breakdown of the data is shown below. Firms were classified as “small” if they produced fewer than 10,000 barrels per day (b/d) and “large” if they produced 10,000 b/d or more. In the U.S., small E&P firms are greater in number, but large E&P firms represent the majority of production (more than 80 percent). Executives from small E&P firms were somewhat more likely to report greater reductions compared to executives at larger E&P firms.
| Response | Percent of respondents (among each group) | ||
| All E&P | Large E&P | Small E&P | |
| $0-$0.99 | 57 | 56 | 57 |
| $1-$1.99 | 25 | 38 | 20 |
| $2-$2.99 | 7 | 0 | 9 |
| $3-$3.99 | 0 | 0 | 0 |
| $4-$4.99 | 7 | 6 | 7 |
| ≥$5 | 5 | 0 | 7 |
| NOTES: Executives from 60 exploration and production (E&P) firms answered this question during the survey collection period, Sept. 10–18, 2025. Small E&P firms produced fewer than 10,000 barrels per day (b/d) in fourth quarter 2024, while large E&P firms produced 10,000 b/d or more. Responses came from 44 small firms and 16 large firms. Percentages may not sum to 100 due to rounding. SOURCE: Federal Reserve Bank of Dallas. |
|||
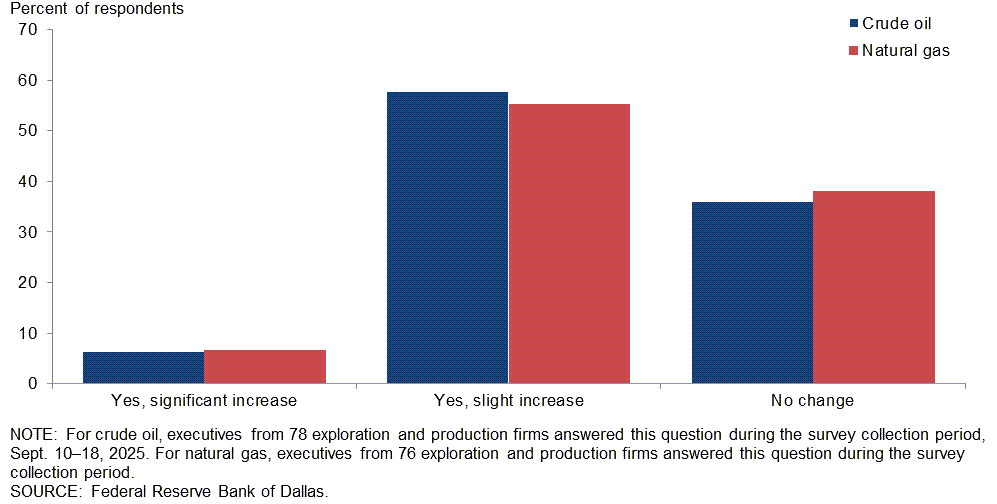
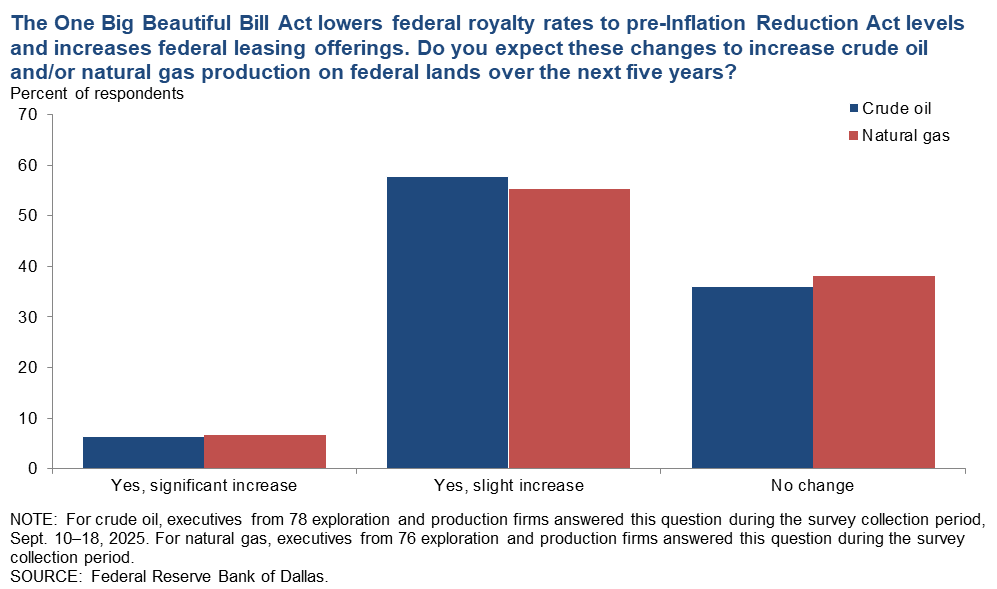
The One Big Beautiful Bill Act lowers federal royalty rates to pre-Inflation Reduction Act levels and increases federal leasing offerings. Do you expect these changes to increase crude oil and/or natural gas production on federal lands over the next five years?
The most selected response was slight increase, chosen by 58 percent of executives for crude oil and 55 percent for natural gas. The next most selected response, for both crude oil and natural gas, was no change while only a small percentage selected significant increase.
Executives at small E&P firms were more likely to expect the changes to lead to slight increases in production on federal lands, whereas the majority of executives at large E&P firms expect no change. A breakdown between firm size and product can be found in the table below.
| Response | Percent of respondents (among each group) | |||||
| Crude oil | Natural gas | |||||
| All E&P | Large E&P | Small E&P | All E&P | Large E&P | Small E&P | |
| Yes, significant increase | 6 | 6 | 7 | 7 | 0 | 8 |
| Yes, slight increase | 58 | 35 | 64 | 55 | 31 | 62 |
| No change | 36 | 59 | 30 | 38 | 69 | 30 |
| NOTES: For crude oil, executives from 78 exploration and production (E&P) firms answered this question during the survey collection period, Sept. 10–18, 2025. Small E&P firms produced fewer than 10,000 barrels per day (b/d) in fourth quarter 2024, while large E&P firms produced 10,000 b/d or more. Responses came from 61 small firms and 17 large firms. For natural gas, executives from 76 E&P firms answered this question during the survey collection period. Responses came from 60 small firms and 16 large firms. SOURCE: Federal Reserve Bank of Dallas. |
||||||
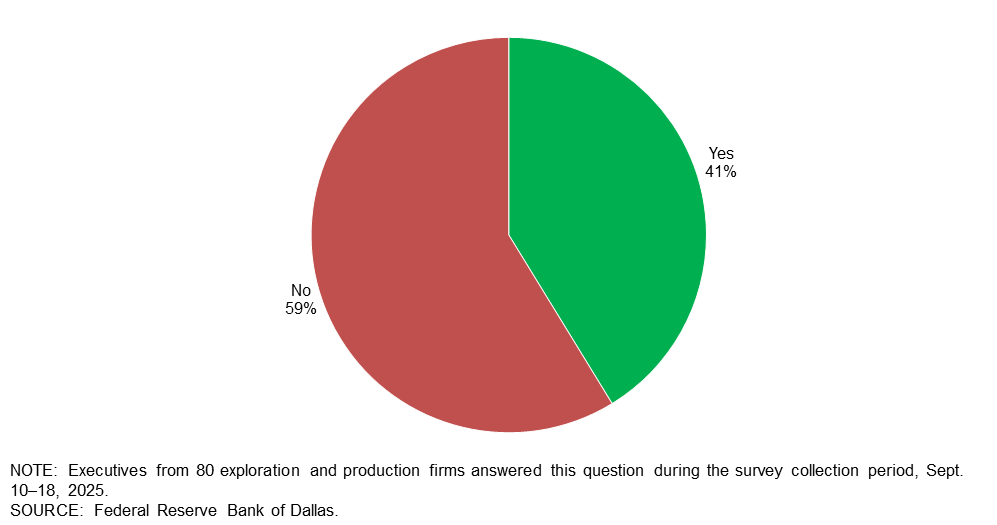
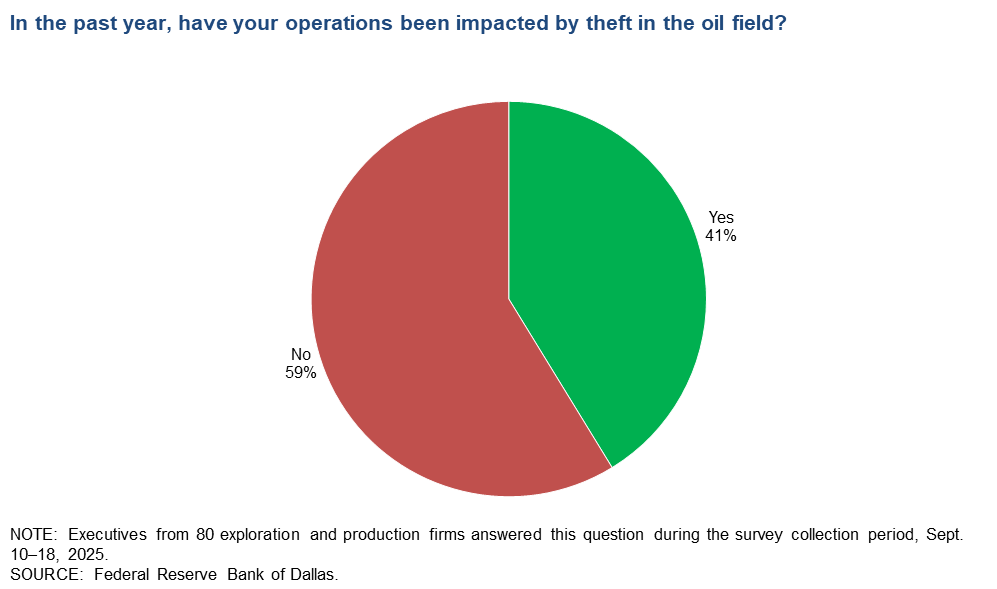
In the past year, have your operations been impacted by theft in the oil field
Forty-one percent of executives said their operations have been impacted by theft in the oil field in the past year. The remaining 59 percent said they have not been impacted.
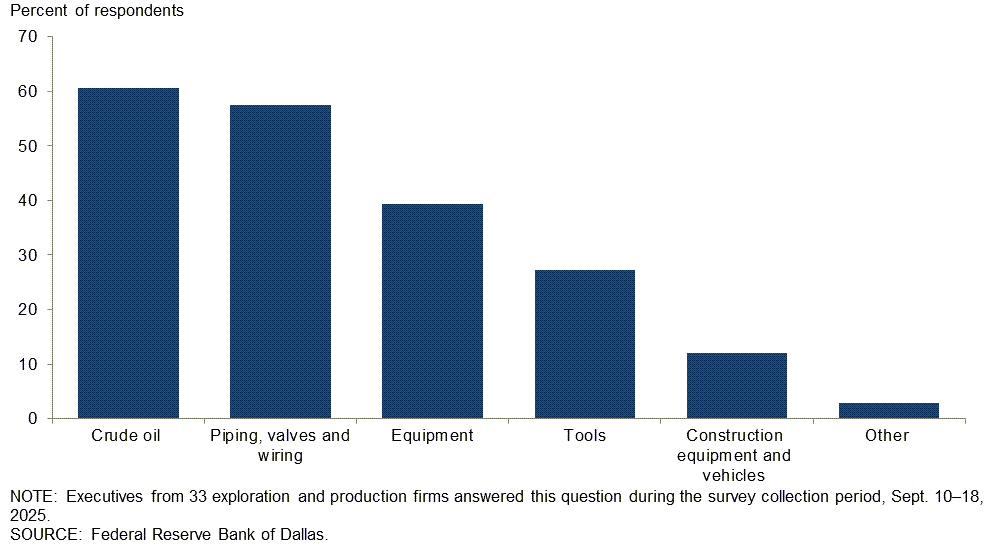
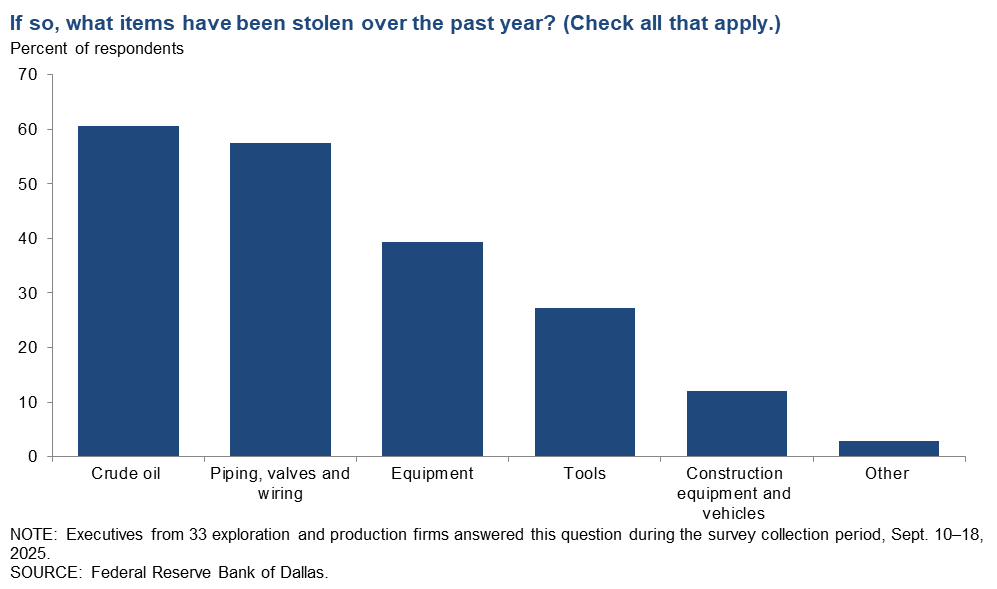
If so, what items have been stolen over the past year? (Check all that apply.)
This question was only posed to E&P executives who said their operations have been impacted by theft in the oil field in the past year. The most selected response was "crude oil" (61 percent of respondents) followed by “piping valves and wiring” (58 percent of respondents) and “equipment” (39 percent of respondents.)
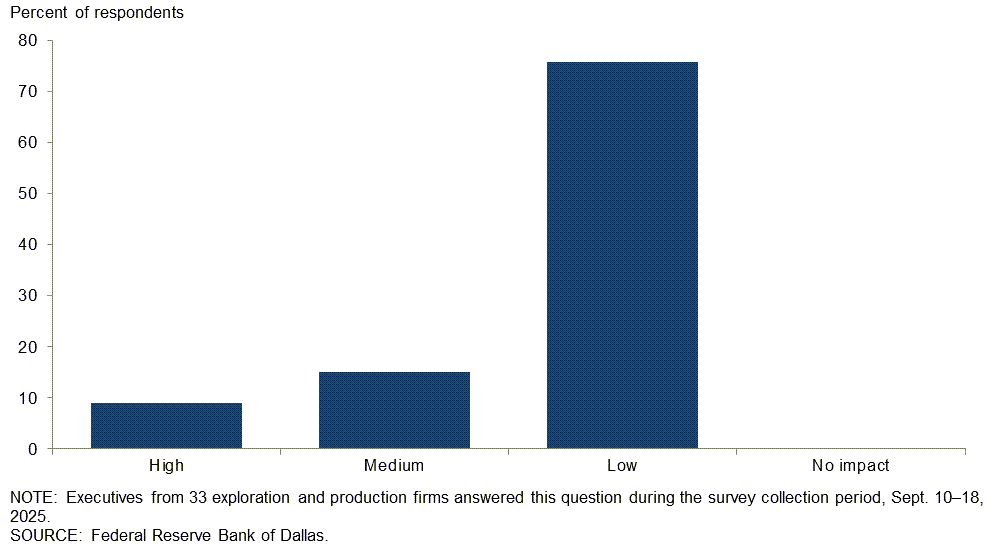
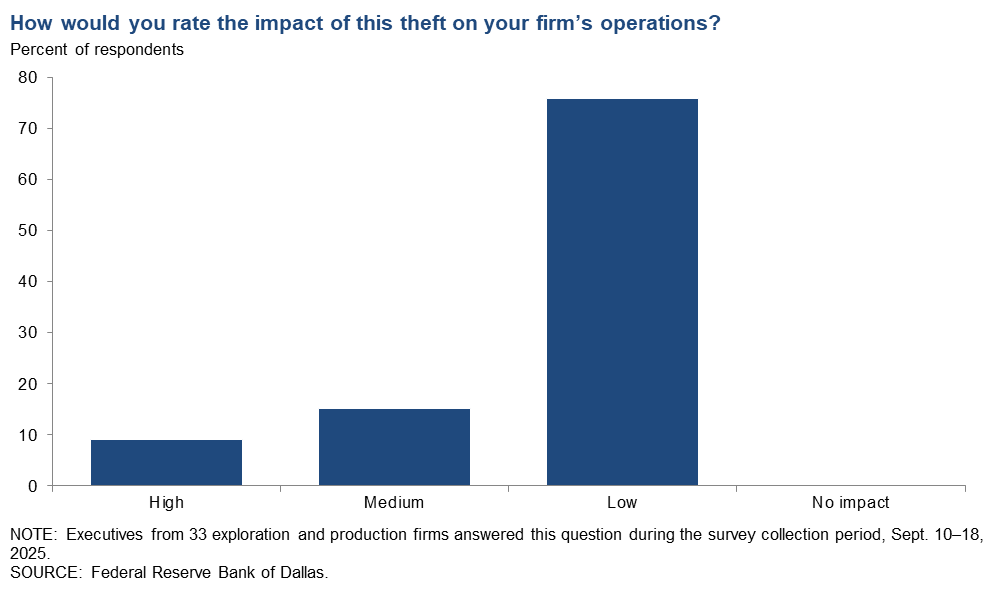
How would you rate the impact of this theft on your firm’s operations?
This question was only posed to E&P executives who said their operations have been impacted by theft in the oil field in the past year. Most executives rated the impact of theft on their firm’s operations as low.
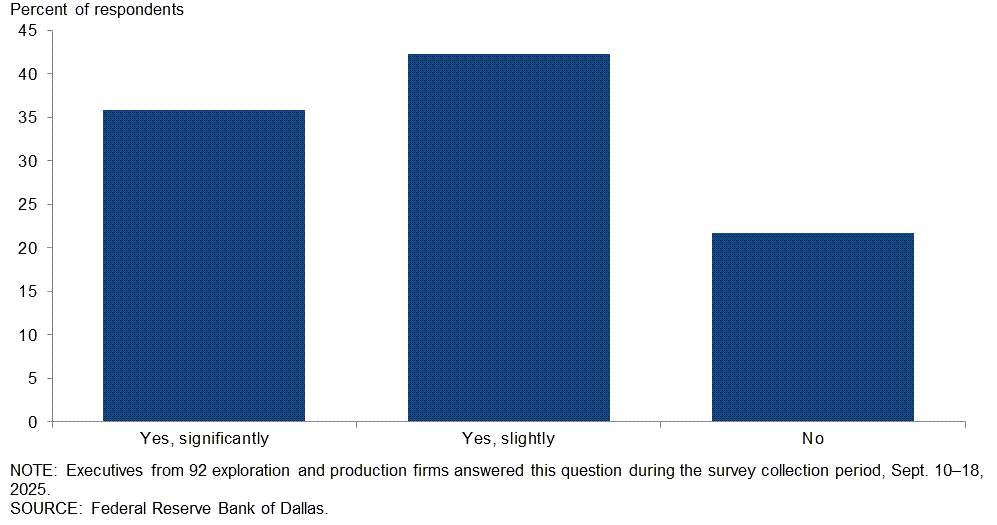
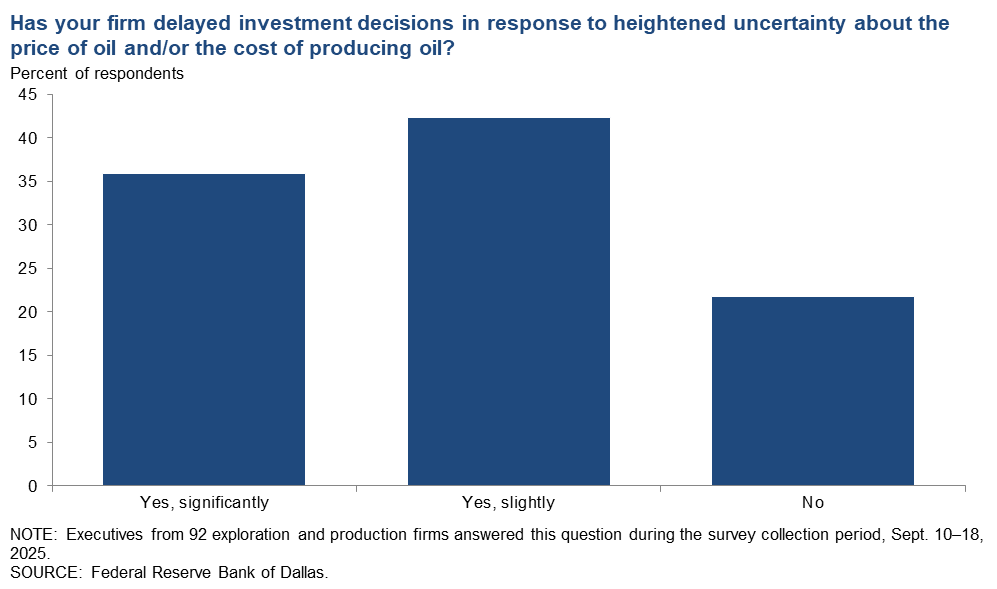
Has your firm delayed investment decisions in response to heightened uncertainty about the price of oil and/or the cost of producing oil?
Most executives report they have delayed investment decisions in response to heightened uncertainty about the price of oil and/or the cost of producing oil. Forty-two percent of executives said they have slightly delayed investment decisions, and 36 percent of executives report they have significantly delayed decisions. Executives at small E&P firms were slightly more likely to report no delay compared with executives at large E&P firms.
| Response | Percent of respondents (among each group) | ||
| All E&P | Large E&P | Small E&P | |
| Yes, significantly | 36 | 35 | 36 |
| Yes, slightly | 42 | 53 | 40 |
| No | 22 | 12 | 24 |
| NOTES: Executives from 92 exploration and production (E&P) firms answered this question during the survey collection period, Sept. 10–18, 2025. Small E&P firms produced fewer than 10,000 barrels per day (b/d) in fourth quarter 2024, while large E&P firms produced 10,000 b/d or more. Responses came from 75 small firms and 17 large firms. SOURCE: Federal Reserve Bank of Dallas. |
|||
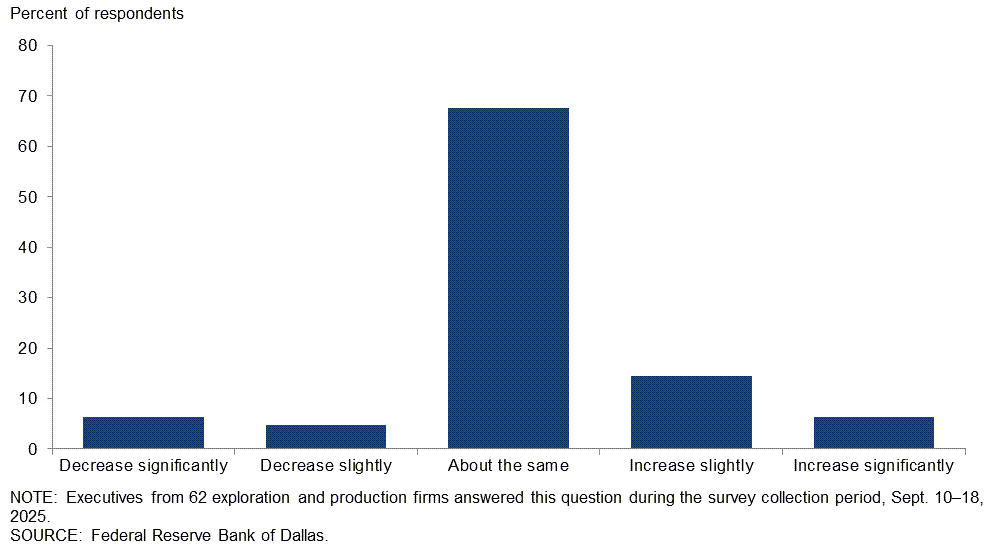
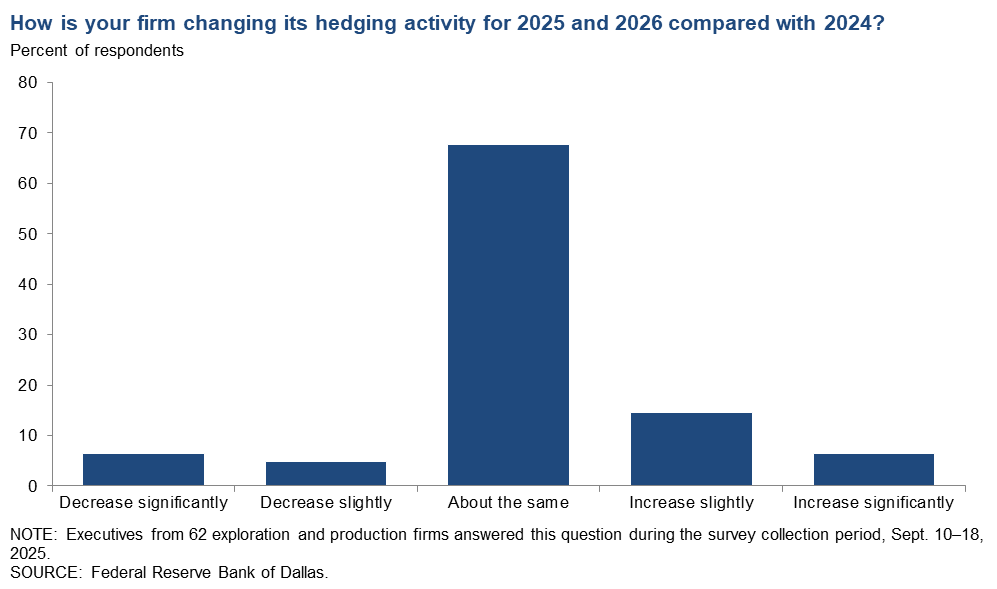
How is your firm changing its hedging activity for 2025 and 2026 compared with 2024?
Most executives said their hedging activity for 2025 and 2026 will be about the same as in 2024.
Oil and gas support services firms
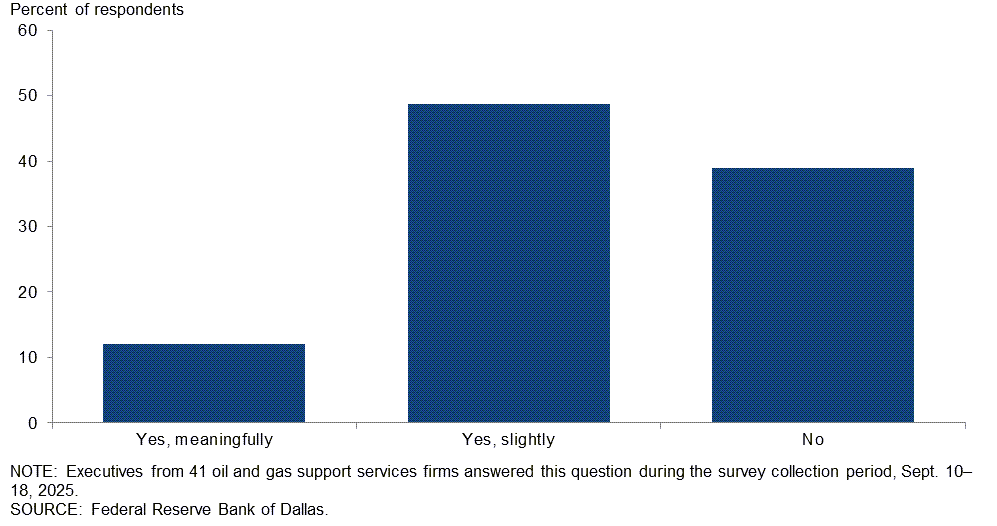
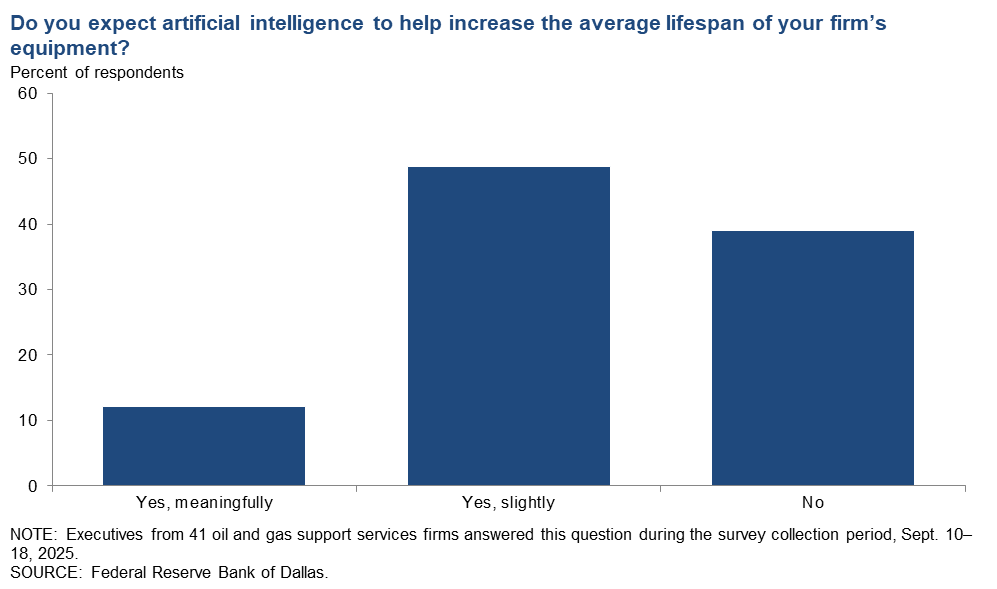
Do you expect artificial intelligence to help increase the average lifespan of your firm’s equipment?
The majority of oil and gas support services executives expect artificial intelligence to help increase the average lifespan of their equipment. A total of 49 percent of executives expect a slight increase, and an additional 12 percent anticipate a meaningful increase. On the other hand, 39 percent don’t expect artificial intelligence to increase the average lifespan of their equipment.
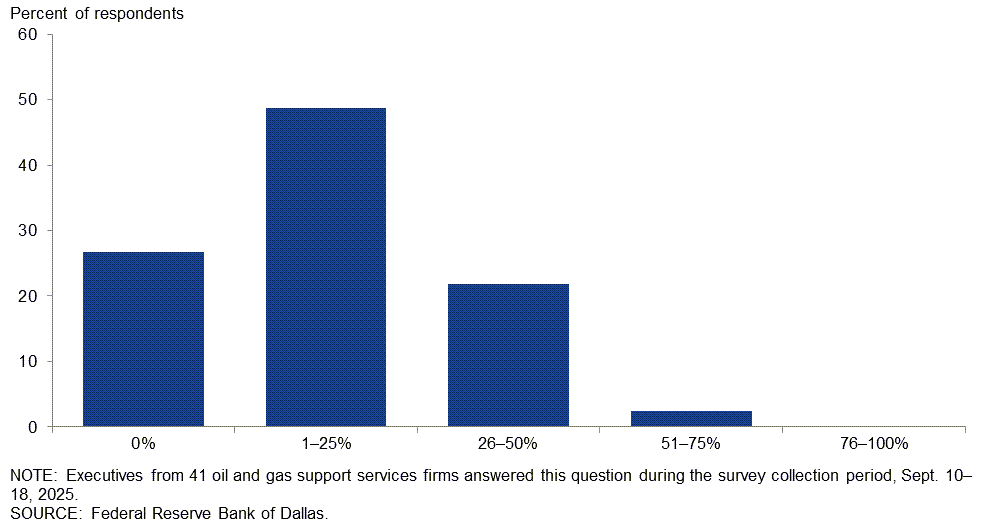
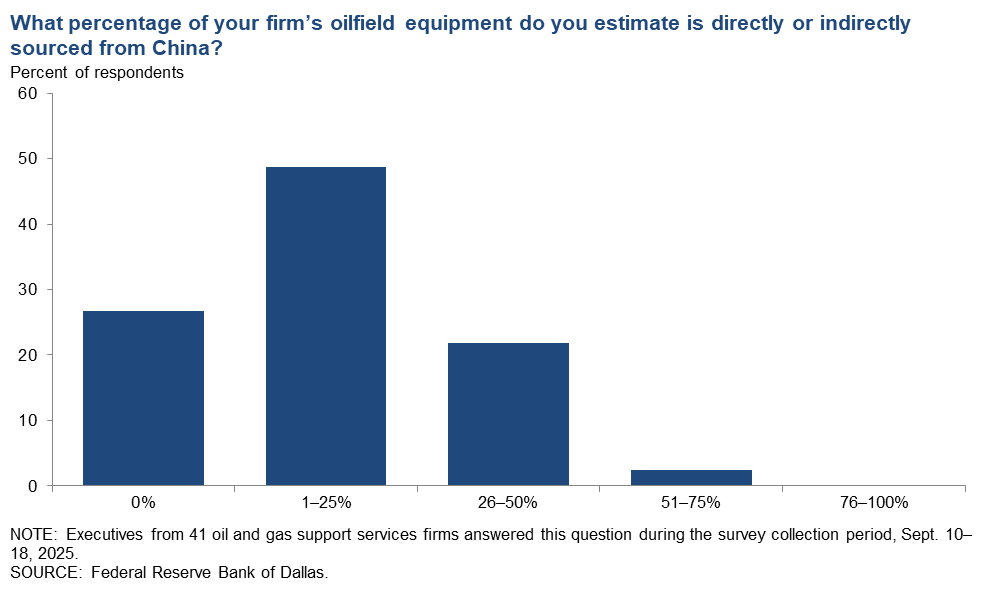
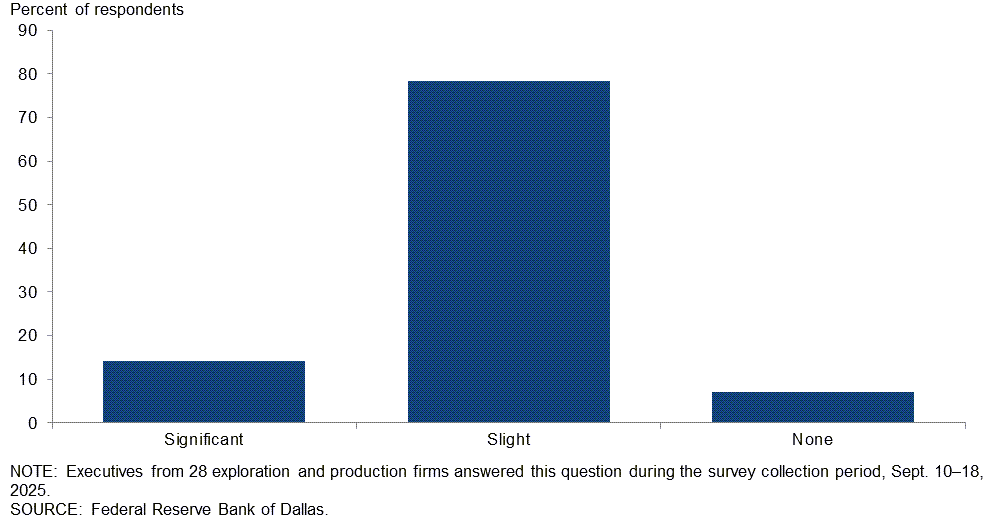
What percentage of your firm’s oilfield equipment do you estimate is directly or indirectly sourced from China?
Almost half of the executives, 49 percent, estimate that up to one-quarter of their oilfield equipment is directly or indirectly sourced from China. Another 22 percent of executives said 26–50 percent was Chinese sourced. An additional 2 percent of executives said Chinese-sourced equipment made up 51–75 percent of holdings. On the other hand, 27 percent of executives said none of their firms’ oilfield equipment is sourced from China.
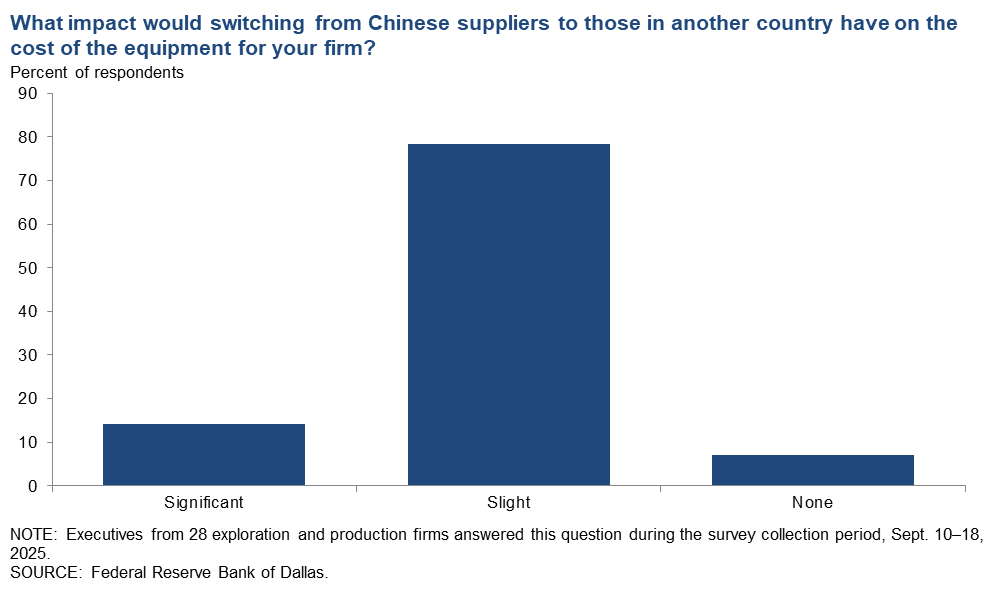
What impact would switching from Chinese suppliers to those in another country have on the cost of the equipment for your firm?
This question was only posed to oil and gas support services executives who estimate some portion of their equipment is directly or indirectly sourced from China. The majority (79 percent) said impact would be slight. An additional 14 percent of executives expect significant impact. The remaining 7 percent said there would be no impact.
Special Questions Comments
Exploration and production (E&P) firms
- We have begun the twilight of shale. Several multibillion-dollar firms that have previously been U.S.-onshore-only are making investments in foreign countries and riskier (waterborne) geologies. The writing is on the wall. Consolidation continues; 50 percent fewer public companies than 10 years ago, and employees are being cut by the tens of thousands. The U.S. isn't running out of oil, but she sure is running out of $60 per barrel oil. $100 per barrel? $150 per barrel? Price likely must cover for less-than-optimal geology over time. One must wonder—in a country with over a million orphan wells—what happens to that (expensive) plug and abandon liability from the 200,000+ horizontal shale wells over time. We already see some companies that appear to have a business plan of a "bad bank." Society will not treat us kindly unless we do our part to clean up after we are gone.
- It’s going to be a bleak 3-plus years for the oilpatch. Why would Wall Street want to invest in the worst performing sector of the S&P when artificial intelligence beckons?
- Given the U.S. Energy Information Administration's forecast for 2026 oil prices averaging $47 per barrel, we are suspending drilling indefinitely after we drill our last well starting this month. After Liberation Day, we cut our drilling budget in half from 10 wells to 5 wells.
- No opinion on hedging as we don't hedge. It will take quite a while for the "Big Beautiful Bill" to work its way into the economy. The "drill, baby, drill" return isn't going to happen! Banks, shareholders, bondholders, C-suites, and everybody realizes the prior "drill, baby, drill" boom led to financial disasters and wasted capital, natural resources and human resources. From now on, economic decisions will have to be prudent and well-founded in logic, not hyperbole.
- We are finding it difficult to hedge production at this level. Our belief is crude at $60 per barrel is below replacement cost and will not continue unabated for an extended time. We may see oil drop to the mid $50 per barrel but it should be short lived. Big risk is economic uncertainty around the globe including high debt levels for the major economies, which may crack under higher interest rates and slowing growth. If they do crack, oil prices could drop precipitously for an extended period of time. However, with the recent round of consolidations, the market should be able to adjust significant production down quickly to address the price decline.
- Overall, we feel good about the future of the industry but expect some short-term pain for the next year or so.
- I expect significant non-shale (conventional) exploration increases and expenditures in offshore and foreign frontier basins in the coming years. The recent discovery in offshore Brazil and discoveries in the Orange Basin in offshore Namibia are encouraging. Domestic shale production at the $60 per barrel price point does induce expenditures for tier 2 and tier 3 acreage, which exhibit rapid decline curves.
- Lowering interest rates will spur the economy and drive oil and gas consumption higher. LNG exports will also help our industry.
- I view oil as having far more upside potential than downside. First with the U.S. Strategic Petroleum Reserve being at the lowest it has been since roughly 1984. This could be used to set a price floor and mitigate a potential inventory glut if one does occur. Second is global conflict is not slowing down. The Russians are now actively increasing provocations of NATO Members with flights of drones into Poland, and the administration is calling for Europe to end buying Russian energy. If this shakes out, we could see a massive capital flow into energy as European countries mitigate supply shocks by increasing on-hand inventory.
- The costs for permitting in California are approaching as much as the cost of certain shallow wells, so the political and regulatory bureaucracy is literally out of control, and reforms are needed. California is using imports to undermine in-state operators which is harming the state, harming the operators and workers in the state, and restricting operations on many of the federal lands on the west coast. My improved outlook for the coming year is primarily due to work from Washington D.C. and the U.S. Bureau of Land Management easing certain roadblocks. More quick action is needed and I believe, is ongoing.
- Some upstream oil and gas companies are slashing staff. Many jobs are being replaced due to future use of artificial intelligence. Also, many jobs are not necessary without intense growth. The price of natural gas has been low for years. Only the shale gas players can produce and drill for profits. Much of those profits were based on hedges being fulfilled. Now those are ending, and prices now are far lower. Natural gas production domestically will see higher demand due to tariff issues and build out of more liquefied natural gas (LNG) capacity. Oil prices are not controlled by domestic producers. Shale oil will drop off in volume.
- We are hedging additional natural gas liquids.
Oil and gas support services firms
- A stable and predictable trade regime is critical for business planning.
- U.S. onshore drilling contractors are some of the most patriotic bunch I know. We source all American products when available and financially viable.
- We rely heavily on electrical components and automation to operate our equipment. There has been a noticeable shift in the manufacturing of these products away from China. We are seeing more of these products being assembled in Mexico, India and southeastern Asian countries. Over the course of the past year, tariffs have pushed pricing higher on these products.
- The most notable pieces from China are subcomponents of larger pieces; domestic suppliers are higher in price and lower in availability. Main items are valve and pump components. We expected significant impact on pipe prices, but have not seen impact of any policy at this time.
- Shale drilling in other countries will be controlled by the political climate in those countries.
Additional Comments »
Historical data are available from first quarter 2016 to the most current release quarter.
Business Indicators: Quarter/Quarter
| Business Indicators: All Firms Current Quarter (versus previous quarter) | |||||
| Indicator | Current Index | Previous Index | % Reporting Increase | % Reporting No Change | % Reporting Decrease |
Level of Business Activity | –6.5 | –8.1 | 22.3 | 48.9 | 28.8 |
Capital Expenditures | –11.6 | –3.0 | 26.8 | 34.8 | 38.4 |
Supplier Delivery Time | –3.6 | –0.7 | 5.8 | 84.8 | 9.4 |
Employment | –1.5 | –6.6 | 12.9 | 72.7 | 14.4 |
Employee Hours | –3.7 | –5.1 | 13.0 | 70.3 | 16.7 |
Wages and Benefits | 11.5 | 10.3 | 20.1 | 71.2 | 8.6 |
| Indicator | Current Index | Previous Index | % Reporting Improved | % Reporting No Change | % Reporting Worsened |
Company Outlook | –17.6 | –6.4 | 16.2 | 50.0 | 33.8 |
| Indicator | Current Index | Previous Index | % Reporting Increase | % Reporting No Change | % Reporting Decrease |
Uncertainty | 44.6 | 47.1 | 54.0 | 36.7 | 9.4 |
| Business Indicators: E&P Firms Current Quarter (versus previous quarter) | |||||
| Indicator | Current Index | Previous Index | % Reporting Increase | % Reporting No Change | % Reporting Decrease |
Level of Business Activity | –3.2 | –4.4 | 23.7 | 49.5 | 26.9 |
Oil Production | –8.6 | –8.9 | 19.4 | 52.7 | 28.0 |
Natural Gas Wellhead Production | –3.2 | –4.5 | 20.7 | 55.4 | 23.9 |
Capital Expenditures | –5.3 | 2.2 | 32.3 | 30.1 | 37.6 |
Expected Level of Capital Expenditures Next Year | –9.8 | 10.0 | 26.1 | 38.0 | 35.9 |
Supplier Delivery Time | –3.3 | –1.1 | 4.3 | 88.0 | 7.6 |
Employment | 1.1 | –1.1 | 10.8 | 79.6 | 9.7 |
Employee Hours | –3.2 | –1.1 | 10.9 | 75.0 | 14.1 |
Wages and Benefits | 8.6 | 8.8 | 17.2 | 74.2 | 8.6 |
Finding and Development Costs | 22.0 | 11.4 | 33.0 | 56.0 | 11.0 |
Lease Operating Expenses | 36.9 | 28.1 | 40.2 | 56.5 | 3.3 |
| Indicator | Current Index | Previous Index | % Reporting Improved | % Reporting No Change | % Reporting Worsened |
Company Outlook | –20.0 | –4.8 | 14.1 | 51.8 | 34.1 |
| Indicator | Current Index | Previous Index | % Reporting Increase | % Reporting No Change | % Reporting Decrease |
Uncertainty | 39.8 | 43.9 | 51.6 | 36.6 | 11.8 |
| Business Indicators: O&G Support Services Firms Current Quarter (versus previous quarter) | |||||
| Indicator | Current Index | Previous Index | % Reporting Increase | % Reporting No Change | % Reporting Decrease |
Level of Business Activity | –13.0 | –15.6 | 19.6 | 47.8 | 32.6 |
Utilization of Equipment | –13.0 | –4.6 | 19.6 | 47.8 | 32.6 |
Capital Expenditures | –24.4 | –13.3 | 15.6 | 44.4 | 40.0 |
Supplier Delivery Time | –4.3 | 0.0 | 8.7 | 78.3 | 13.0 |
Lag Time in Delivery of Firm's Services | –6.7 | 0.0 | 4.4 | 84.4 | 11.1 |
Employment | –6.5 | –17.7 | 17.4 | 58.7 | 23.9 |
Employment Hours | –4.3 | –13.3 | 17.4 | 60.9 | 21.7 |
Wages and Benefits | 17.4 | 13.3 | 26.1 | 65.2 | 8.7 |
Input Costs | 34.8 | 40.0 | 39.1 | 56.5 | 4.3 |
Prices Received for Services | –26.1 | –17.7 | 2.2 | 69.6 | 28.3 |
Operating Margin | –31.8 | –33.4 | 9.1 | 50.0 | 40.9 |
| Indicator | Current Index | Previous Index | % Reporting Improved | % Reporting No Change | % Reporting Worsened |
Company Outlook | –13.3 | –9.5 | 20.0 | 46.7 | 33.3 |
| Indicator | Current Index | Previous Index | % Reporting Increase | % Reporting No Change | % Reporting Decrease |
Uncertainty | 54.4 | 53.4 | 58.7 | 37.0 | 4.3 |
Business Indicators: Year/Year
| Business Indicators: All Firms Current Quarter (versus same quarter a year ago) | |||||
| Indicator | Current Index | Previous Index | % Reporting Increase | % Reporting No Change | % Reporting Decrease |
Level of Business Activity | –22.7 | –9.2 | 26.5 | 24.2 | 49.2 |
Capital Expenditures | –11.3 | –1.6 | 31.1 | 26.5 | 42.4 |
Supplier Delivery Time | 0.7 | 0.8 | 13.7 | 73.3 | 13.0 |
Employment | –5.3 | –9.3 | 21.2 | 52.3 | 26.5 |
Employee Hours | 0.8 | –7.7 | 19.1 | 62.6 | 18.3 |
Wages and Benefits | 36.1 | 29.2 | 46.9 | 42.3 | 10.8 |
| Indicator | Current Index | Previous Index | % Reporting Improved | % Reporting No Change | % Reporting Worsened |
Company Outlook | –28.9 | –8.3 | 22.3 | 26.4 | 51.2 |
| Business Indicators: E&P Firms Current Quarter (versus same quarter a year ago) | |||||
| Indicator | Current Index | Previous Index | % Reporting Increase | % Reporting No Change | % Reporting Decrease |
Level of Business Activity | –16.8 | –3.4 | 28.1 | 27.0 | 44.9 |
Oil Production | –9.0 | –8.1 | 30.3 | 30.3 | 39.3 |
Natural Gas Wellhead Production | –4.6 | –2.3 | 29.5 | 36.4 | 34.1 |
Capital Expenditures | –11.2 | 5.9 | 31.5 | 25.8 | 42.7 |
Expected Level of Capital Expenditures Next Year | –16.1 | 1.2 | 27.6 | 28.7 | 43.7 |
Supplier Delivery Time | 3.4 | 0.0 | 13.6 | 76.1 | 10.2 |
Employment | 1.1 | –1.2 | 20.2 | 60.7 | 19.1 |
Employee Hours | 3.4 | 0.0 | 15.9 | 71.6 | 12.5 |
Wages and Benefits | 39.3 | 25.3 | 47.2 | 44.9 | 7.9 |
Finding and Development Costs | 29.5 | 17.8 | 42.0 | 45.5 | 12.5 |
Lease Operating Expenses | 51.1 | 34.5 | 56.8 | 37.5 | 5.7 |
| Indicator | Current Index | Previous Index | % Reporting Improved | % Reporting No Change | % Reporting Worsened |
Company Outlook | –26.6 | –6.3 | 22.8 | 27.8 | 49.4 |
| Business Indicators: O&G Support Services Firms Current Quarter (versus same quarter a year ago) | |||||
| Indicator | Current Index | Previous Index | % Reporting Increase | % Reporting No Change | % Reporting Decrease |
Level of Business Activity | –34.8 | –21.0 | 23.3 | 18.6 | 58.1 |
Utilization of Equipment | –23.3 | –19.0 | 27.9 | 20.9 | 51.2 |
Capital Expenditures | –11.7 | –16.2 | 30.2 | 27.9 | 41.9 |
Supplier Delivery Time | –4.6 | 2.4 | 14.0 | 67.4 | 18.6 |
Lag Time in Delivery of Firm's Services | 0.0 | –2.4 | 14.3 | 71.4 | 14.3 |
Employment | –18.6 | –26.2 | 23.3 | 34.9 | 41.9 |
Employment Hours | –4.6 | –23.2 | 25.6 | 44.2 | 30.2 |
Wages and Benefits | 29.2 | 37.2 | 46.3 | 36.6 | 17.1 |
Input Costs | 47.6 | 41.9 | 57.1 | 33.3 | 9.5 |
Prices Received for Services | –28.6 | –14.0 | 11.9 | 47.6 | 40.5 |
Operating Margin | –45.2 | –38.1 | 14.3 | 26.2 | 59.5 |
| Indicator | Current Index | Previous Index | % Reporting Improved | % Reporting No Change | % Reporting Worsened |
Company Outlook | –33.4 | –12.5 | 21.4 | 23.8 | 54.8 |
Activity Chart
Comments from Survey Respondents
Survey participants are given the opportunity to submit comments on current issues that may be affecting their businesses. Some comments have been edited for grammar and clarity. Comments from the Special Questions survey can be found below the special questions.
Exploration and production (E&P) firms
- There are a variety of issues affecting our business. First, excess in the global oil market is restraining oil prices near term. Second, there is continued uncertainty from OPEC+ unwinding production cuts. Third, trade and tariff changes and the resulting geopolitical tensions.
- Day to day changes to energy policy is no way for us to win as a country. Investors (rightly) avoid investing in energy (of all types, now) because of the volatility of underlying business results as well as the "stroke of pen" risk that the federal government wields as it relates to long duration energy developments. Life is long, and the sword being wielded against the renewables industry right now will likely boomerang back in 3.5 years against traditional energy which will find itself facing harsher methane penalties, permitting restrictions, crazy environmental reviews and other lawfare tactics.
- The administration is pushing for $40 per barrel crude oil, and with tariffs on foreign tubular goods, [input] prices are up, and drilling is going to disappear. The oil industry is once again going to lose valuable employees.
- The noise and chaos is deafening! Who wants to make a business decision in this unstable environment?
- The uncertainty from the administration’s policies has put a damper on all investment in the oilpatch. Those who can are running for the exits. Tobin’s q < 1.
- The U.S. shale business is broken. What was once the world’s most dynamic energy engine has been gutted by political hostility and economic ignorance. The previous administration vilified the industry, buried it in regulation and cheered the flight of capital under the environmental, social and governance banner. Wall Street and pension funds walked away, and even private equity shifted from fueling growth to engineering exits. Now the current administration is finishing the job. Guided by a U.S. Department of Energy that tells them what they want to hear instead of hard facts, they operate with little understanding of shale economics. Instead of supporting domestic production, they’ve effectively aligned with OPEC—using supply tactics to push prices below economic thresholds, kneecapping U.S. producers in the process. The collapse of capital availability has fueled consolidation by the majors, pushing out independents and entrepreneurs who once defined the shale revolution. In their place, a handful of giants now dominate but at the cost of enormous job loss and the destruction of the innovative, risk-taking culture that made the U.S. shale industry great.
- The downward pressure on oil prices coupled with continued tightness in finding qualified labor in remote locations continues to pressure profitability and dividends.
- Commodity pricing seems impossible to predict with daily market swings over 5 percent up or down being normal for both natural gas and crude oil. We sell to spot pricing, so our near-term financial performance is unpredictable. There are too many lever movers at play at the same time in everyone's models zooming out at the macro level (inflation, tariffs, commodity oversupply both domestically and globally, domestic electricity demand growth from data center buildouts, liquefied natural gas (LNG) export demand), and it is no wonder the market is so volatile.
- Workover rigs hourly rate continue to increase, which affects all our repair and development costs.
- Because of global circumstances we think crude oil prices will stay low at the $60 per barrel level. Alternatively, because of an increase in the LNG market we feel that natural gas development and production will increase.
- Uncertainty, both domestically and offshore, have made it difficult to plan. Just in time inventory practices exacerbate planning and/or budgeting forecast processes, making it difficult to project future capital needs. Commodity pricing is extremely difficult, primarily due to geopolitical risk, and uncertainty as to whether this economy will flourish or be stagnant. Stagflation is back on horizon.
- The West Texas natural gas situation is awful! Oklahoma crude purchasers are increasingly adding additional "distribution" charges on each truckload of oil taken. Gas purchasers are increasing their current expense categories and adding new ones, creating total deducts in excess of 5x total severance taxes.
- A series of rate decreases will stimulate business activity and also consumer confidence. The cost of money hinders progress.
- California permitting issues added hundreds of thousands of dollars to new well permitting costs and dragged the ordeal out with delays amounting to years, thwarting developments. The internal state policies need drastic political and/or regulations reform. We own and operate a Federal Unit that has been in place since 1933. Our U.S. Bureau of Land Management agents have been responsive and supportive putting our project in a priority position with new permits for drilling program needs. Financing is still not readily available except for companies in the active horizontal shale developments in specific states and basins. We need more financing options to support independent operators. Costs are going up across the board.
- While crude prices have stabilized in the low-$60s per barrel, the expectation of higher prices is still present. Because of that, a stable price in the low-60s has increased uncertainty due to the expectation of low-60s well into 2026 if not beyond. Costs have been relatively flat and we're not seeing the efficiency gains that are being reported elsewhere in the Permian. With all of that, our expectation is to manage our lease expirations but not drill unnecessary wells in this price environment.
- OPEC overproduction is affecting our business. So is weak sanctions on Russia. U.S. production staying flat while non-U.S. and non-OPEC production is growing exacerbating the glut. The administration’s tariffs, particularly on steel and aluminum at fifty percent, are increasing our cost of business.
- Access to private capital remains challenging. Capital groups appear to be unsure of future pricing and profitability. Higher prices are needed to push perceived profits higher in order to engage capital groups to elect to invest at a higher level. Small operators are struggling to compete financially, and the larger corporations that have larger balance sheets to weather the current lull are better equipped to consolidate and grow their assets at a relative bargain.
- Lowering interest rates will have a positive affect on the oil and gas industry and the overall economy.
- We are confused as to effect of Saudi increases due to increases in storage. Crude oil prices are firm. Why?
- It is very tough to know where prices will go. It seems like we are opening new and larger markets with Japan, Korea, India and Europe but why aren't prices going up as a result?
- Lower commodity prices depress cash flow and make it more difficult to invest capital.
Oil and gas support services firms
- Tariffs continue to increase the cost of production. We are suffering from a combination of increased cost due to tariffs and downward pricing pressure from end users. Global geopolitical issues and U.S. foreign policy uncertainty are creating increased financial challenges for both our U.S. and international business.
- There is intense pricing pressure by customers leading to worsened margins and trade-offs to continue investing in technologies and capital.
- A vibrant oilfield services sector is critical if and when the U.S. needs to ramp up production. Right now we are bleeding.
- There is a continued drawdown in drilling activity directly impacting business. There are numerous competitors supplying quotes for breakeven projects or even at a long-term loss.
- Our manufacturer suppliers have failed to maintain quality assurance standards in their efforts to reshore certain heavy material and pipeline fabrication, which has negatively impacted our ability to meet project timelines effectively.
- The oil and gas industry has slowed dramatically due to low prices and increased cost of raw and finished material and supplies. Operators are less prone to utilize outside services and continue to reduce their own workforces.
- We are seeing a decrease in activity as mergers and acquisitions settle out but are optimistic that more small operators will engage (probably outside core Permian) as we enter first quarter 2026.
- Tariffs are increasing our supply costs.
Questions regarding the Dallas Fed Energy Survey can be addressed to Michael Plante at Michael.Plante@dal.frb.org or Kunal Patel at Kunal.Patel@dal.frb.org.
Sign up for our email alert to be automatically notified as soon as the latest Dallas Fed Energy Survey is released on the web.