
Dallas Fed Energy Survey
|
In response to recent developments in the global oil market, we surveyed energy executives in mid-April for an update to the first quarter survey. |
Oil and gas activity rises amid elevated uncertainty
Special questions this quarter include an annual update on break-even prices by basin. Questions also focus on 2026 drilling plans, expectations for further consolidation among exploration and production (E&P) firms, oil and natural gas recovery rates, production growth outlooks for U.S. basins and regions, and Venezuela oil production expectations.
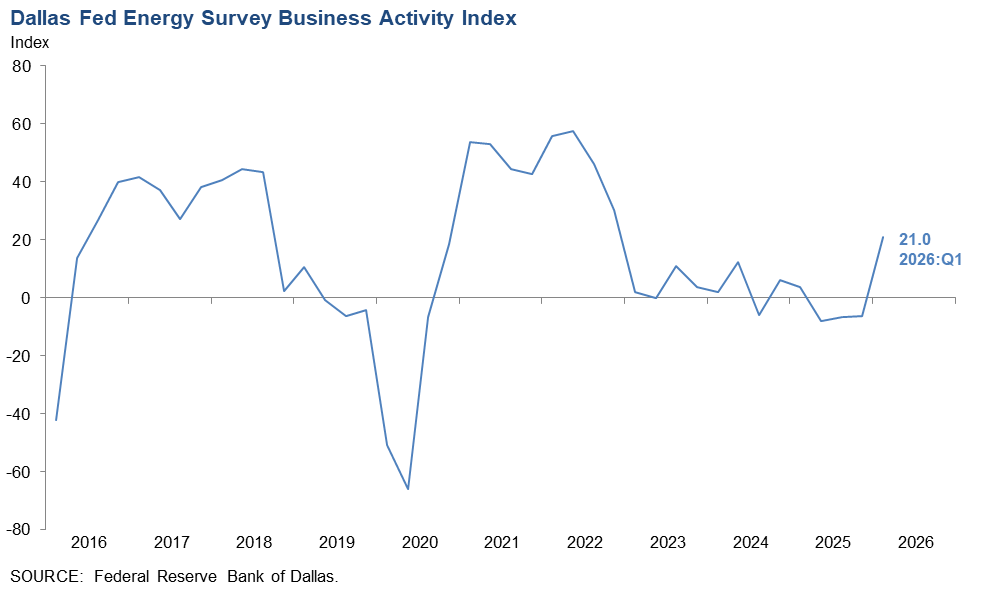
Activity in the oil and gas sector increased in first quarter 2026, according to oil and gas executives responding to the Dallas Fed Energy Survey. The business activity index, the survey’s broadest measure of the conditions energy firms face in the Eleventh District, turned positive (indicating expansion), increasing from -6.2 in the fourth quarter of 2025 to 21.0 in the first quarter of 2026.
The company outlook index also turned positive, advancing from -15.2 in the fourth quarter to 32.2 in the first quarter, suggesting improving outlooks among firms. Meanwhile, the outlook uncertainty index remained elevated and increased from 43.4 to 53.7.
Oil and gas production was little changed in the first quarter, according to executives at exploration and production firms. The oil production index increased slightly from -3.4 to 0. Similarly, the natural gas production index edged higher from 0 to 2.3.
Costs increased at a slightly faster pace when compared with the prior quarter. The input cost index for oilfield services firms increased from 24.4 to 34.9. Among exploration and production firms, the finding and development costs index jumped from 5.7 to 22.3. Meanwhile, the lease operating expenses index was relatively unchanged at 30.0.
Oilfield services firms reported modest improvement in nearly all indicators, a shift from the prior quarter. The equipment utilization index for oilfield services firms turned positive, jumping from -12.2 to 30.2. The operating margin index remained negative but increased from -31.7 to -7.0, indicating margins compressed at a slower rate. Meanwhile, the prices received for services index rose sharply from -30.0 to 9.3.
Overall, demand for employees was unchanged, although those on the job tended to work more hours than in the previous quarter. The aggregate employment index increased from -10.8 in the fourth quarter to 0.8 in the first. Additionally, the aggregate employee hours index jumped from -9.3 to 12.8. Meanwhile, the aggregate wages and benefits index increased from 6.2 to 23.5.
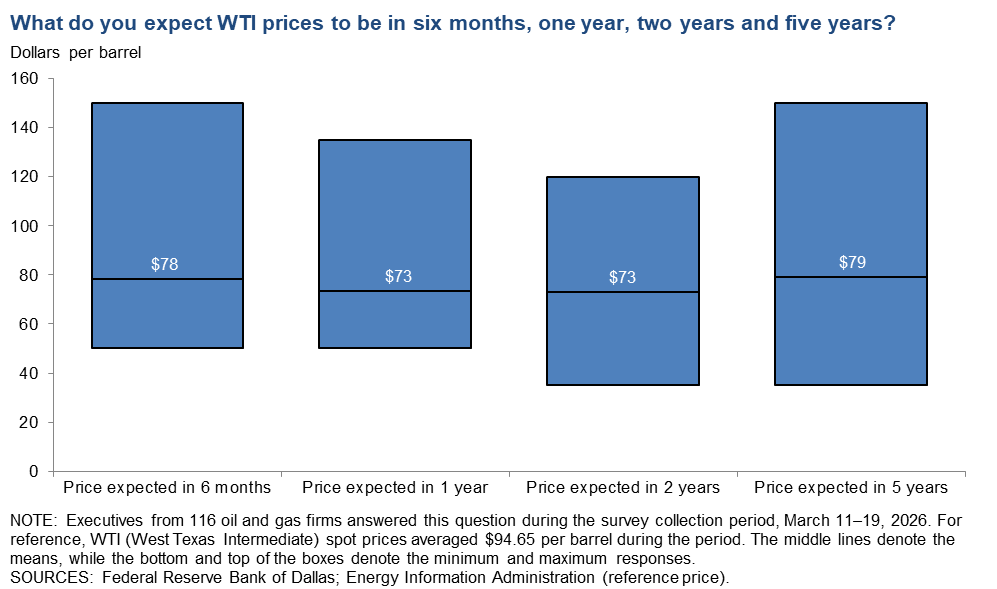
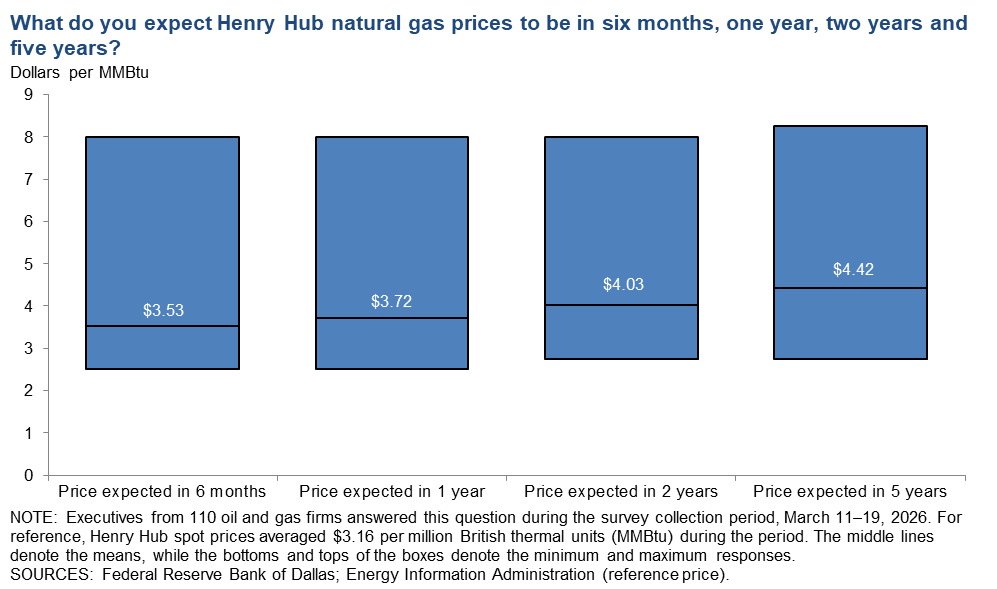
On average, respondents expect a West Texas Intermediate (WTI) oil price of $74 per barrel at year-end 2026; responses ranged from $50 to $135 per barrel. When asked about longer-term expectations, respondents on average said they expect a WTI oil price of $73 per barrel two years from now and $79 per barrel five years from now. Survey participants foresee a Henry Hub natural gas price of $3.60 per million British thermal units (MMBtu) at year-end 2026. When asked about longer-term expectations, respondents on average said they anticipate a Henry Hub gas price of $4.03 per MMBtu two years from now and $4.42 per MMBtu five years from now. For reference, WTI spot prices averaged $94.65 per barrel during the survey collection period, and Henry Hub spot prices averaged $3.16 per MMBtu.
Next release: June 24, 2026
Data were collected March 11–19, and 135 energy firms responded. Of the respondents, 92 were exploration and production firms and 43 were oilfield services firms.
The Dallas Fed conducts the Dallas Fed Energy Survey quarterly to obtain a timely assessment of energy activity among oil and gas firms located or headquartered in the Eleventh District. The Eleventh District encompasses Texas, northern Louisiana and southern New Mexico. Firms are asked whether business activity, employment, capital expenditures and other indicators increased, decreased or remained unchanged compared with the prior quarter and with the same quarter a year ago. Survey responses are used to calculate an index for each indicator. Each index is calculated by subtracting the percentage of respondents reporting a decrease from the percentage reporting an increase. When the share of firms reporting an increase exceeds the share reporting a decrease, the index will be greater than zero, suggesting the indicator has increased over the previous quarter. If the share of firms reporting a decrease exceeds the share reporting an increase, the index will be below zero, suggesting the indicator has decreased over the previous quarter.
Price forecasts
West Texas Intermediate Crude
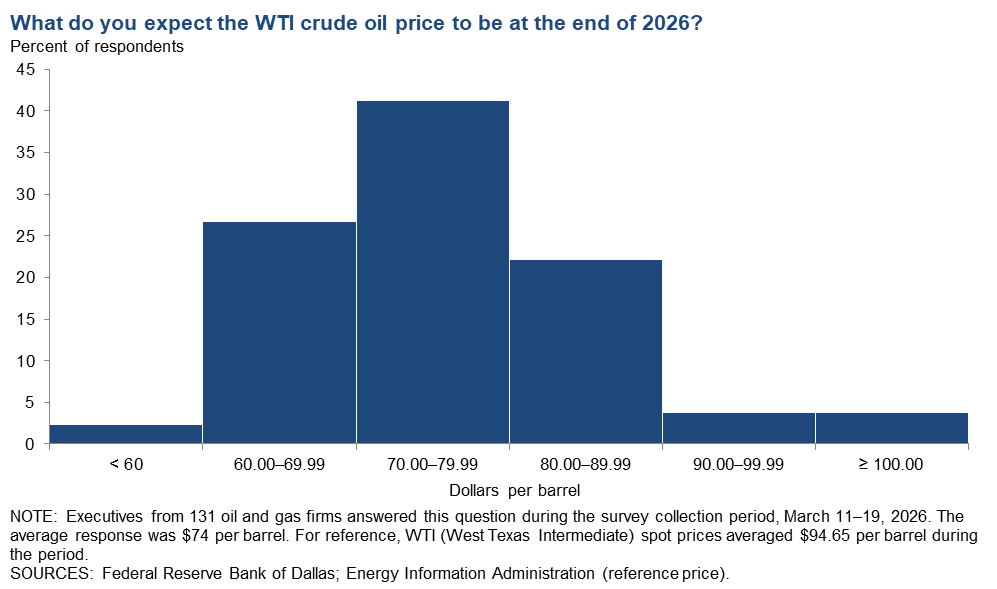
| West Texas Intermediate crude oil price, year-end 2026 | ||||
| Indicator | Survey Average | Low Forecast | High Forecast | Price During Survey |
Current quarter | $74.04 | $50.00 | $135.00 | $94.65 |
Prior quarter | $62.41 | $50.00 | $82.30 | $59.00 |
| NOTE: Price during survey is an average of daily spot prices during the survey collection period. SOURCES: Federal Reserve Bank of Dallas; Energy Information Administration. | ||||
Henry Hub Natural Gas
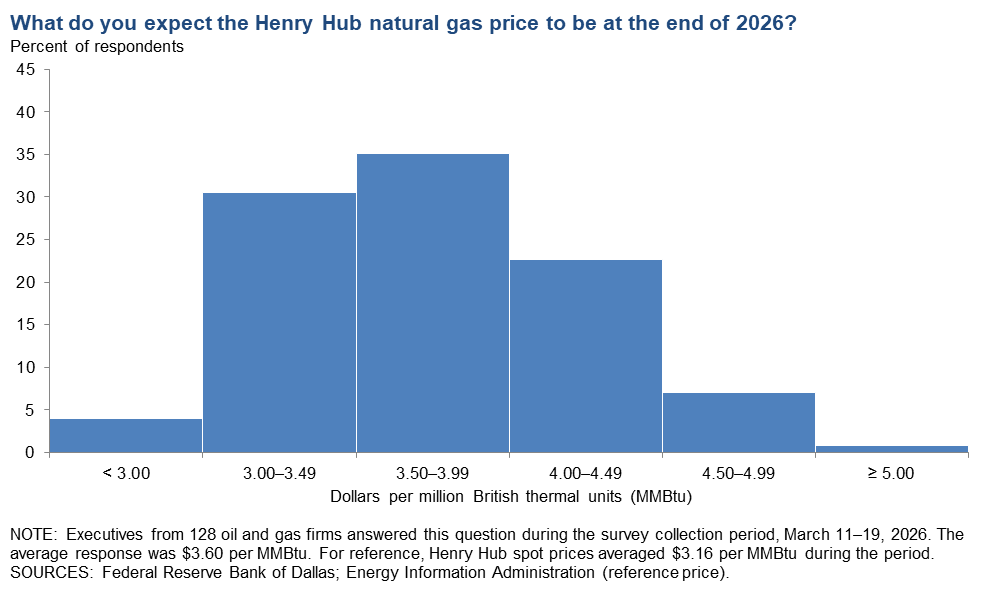
| Henry Hub natural gas price, year-end 2026 | ||||
| Indicator | Survey Average | Low Forecast | High Forecast | Price During Survey |
Current quarter | $3.60 | $2.30 | $5.25 | $3.16 |
Prior quarter | $4.19 | $1.75 | $6.50 | $4.84 |
| NOTE: Price during survey is an average of daily spot prices during the survey collection period. SOURCES: Federal Reserve Bank of Dallas; Energy Information Administration. | ||||
Special questions
Data were collected March 11–19; 130 oil and gas firms responded to the special questions survey.
Exploration and production (E&P) firms
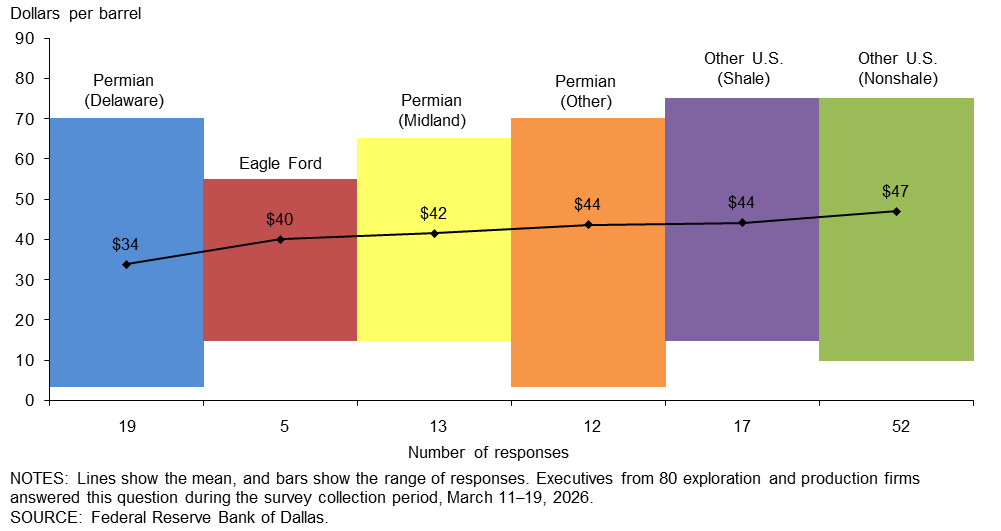
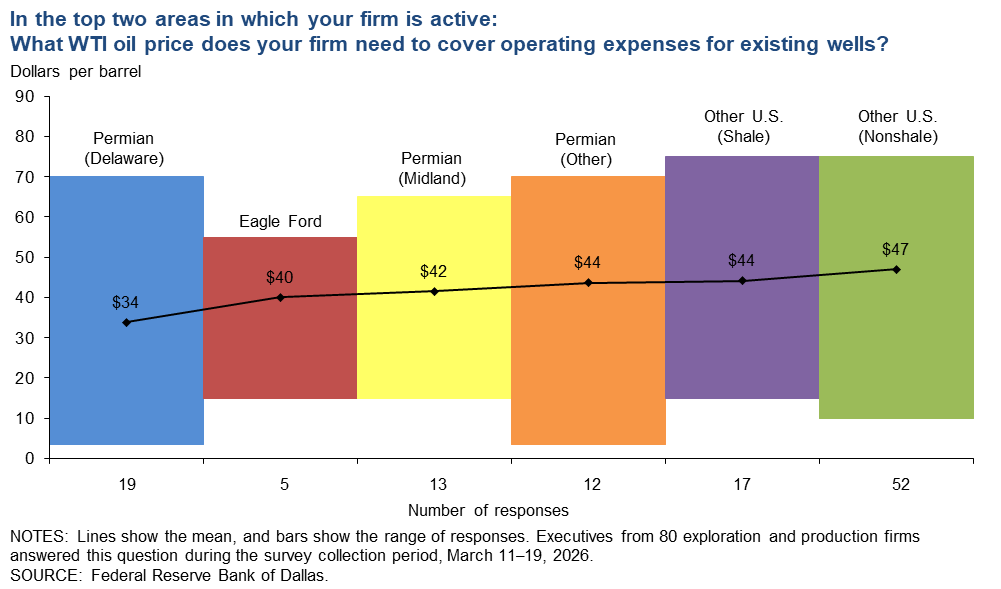
In the top two areas in which your firm is active: What West Texas Intermediate (WTI) oil price does your firm need to cover operating expenses for existing wells?
The average price across the entire sample is approximately $43 per barrel, up from $41 last year. Across regions, the average price necessary to cover operating expenses ranges from $34 to $47 per barrel. All respondents can cover operating expenses for existing wells at current prices.
Large firms (with crude oil production of 10,000 barrels per day or more as of fourth quarter 2025) require prices of $32 per barrel to cover operating expenses for existing wells, based on the average of company responses. That compares with $46 for small firms (fewer than 10,000 barrels per day).
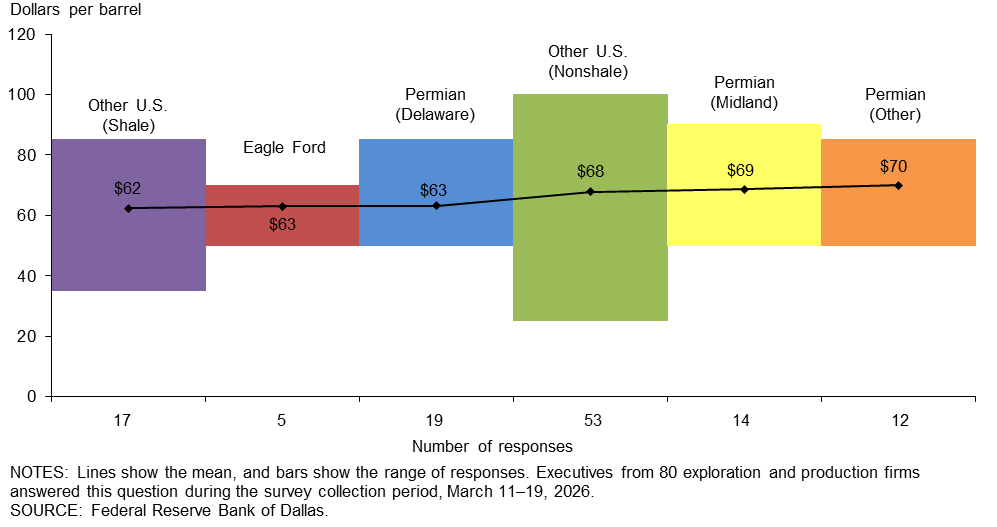
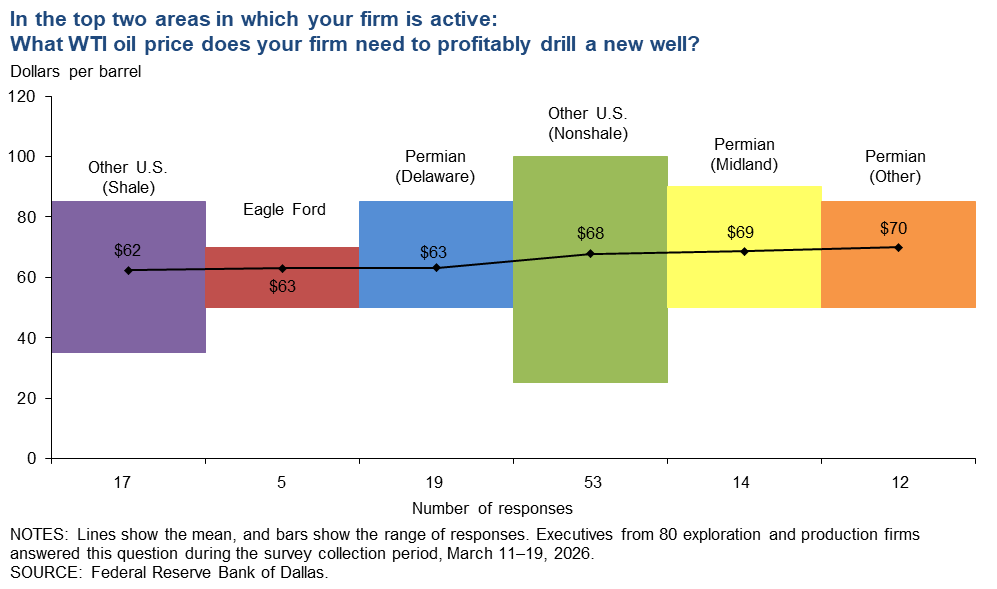
In the top two areas in which your firm is active: What WTI oil price does your firm need to profitably drill a new well?
For the entire sample, firms require $66 per barrel on average to profitably drill, higher than the $65-per-barrel price when this question was asked in last year’s first-quarter survey. Across regions, average break-even prices to profitably drill range from $62 to $70 per barrel. Break-even prices in the Permian Basin average $67 per barrel, up from $65 last year.
Large firms (with crude oil production of 10,000 barrels per day or more as of fourth quarter 2025) require a $59-per-barrel price to profitably drill, based on the average of company responses. That compares with $68 for small firms (fewer than 10,000 barrels per day). The latest historical data can be found on the break-even page.
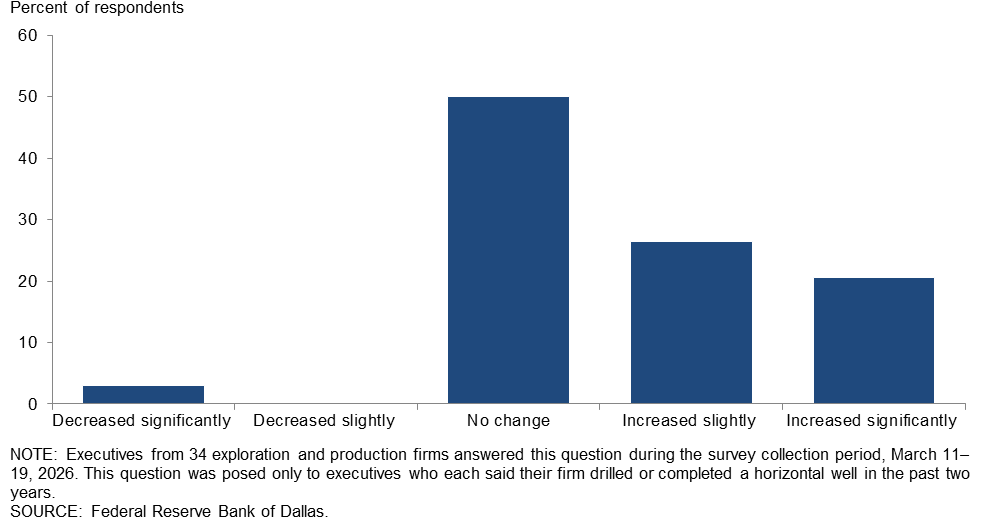
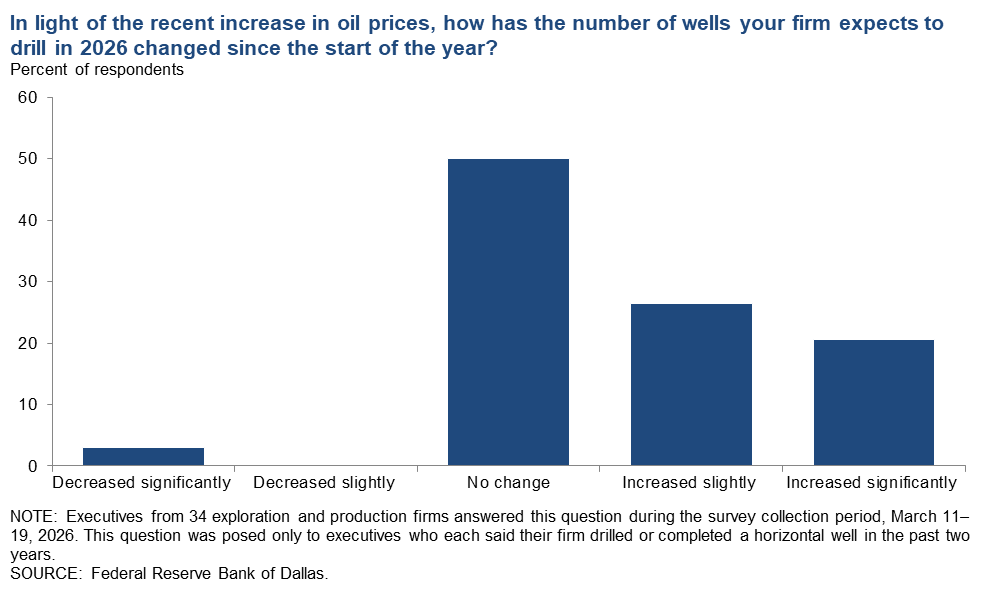
In light of the recent increase in oil prices, how has the number of wells your firm expects to drill in 2026 changed since the start of the year?
This question was posed only to E&P executives who each said their firms drilled or completed horizontal wells in the past two years. Half of the executives surveyed said the number of wells their firms expect to drill in 2026 has not changed since the start of the year. Twenty-six percent said they expect the number of wells they drill to “increase slightly,” and 21 percent said it would “increase significantly.” Conversely, 3 percent said drilling expectations “decreased significantly.”
Executives at small E&P firms were more likely than their counterparts at large firms to indicate they increased the number of wells they plan to drill since the beginning of the year. In the U.S., small E&P firms are greater in number, but large E&P firms represent the majority of production (more than 80 percent). A breakdown of the data is shown below.
| Response | Percent of respondents (among each group) | ||
| All E&P | Large E&P | Small E&P | |
| Increase significantly | 21 | 8 | 29 |
| Increase slightly | 26 | 23 | 29 |
| Remain the same | 50 | 69 | 38 |
| Decrease slightly | 0 | 0 | 0 |
| Decrease significantly | 3 | 0 | 5 |
| NOTES: Executives from 34 exploration and production (E&P) firms answered this question during the survey collection period, March 11–19, 2026. Small E&P firms produced fewer than 10,000 barrels per day (b/d) in fourth quarter 2025, while large E&P firms produced 10,000 b/d or more. Responses came from 21 small firms and 13 large firms. This question was posed only to executives who each said their firm drilled or completed a horizontal well in the past two years. SOURCE: Federal Reserve Bank of Dallas. |
|||
All firms
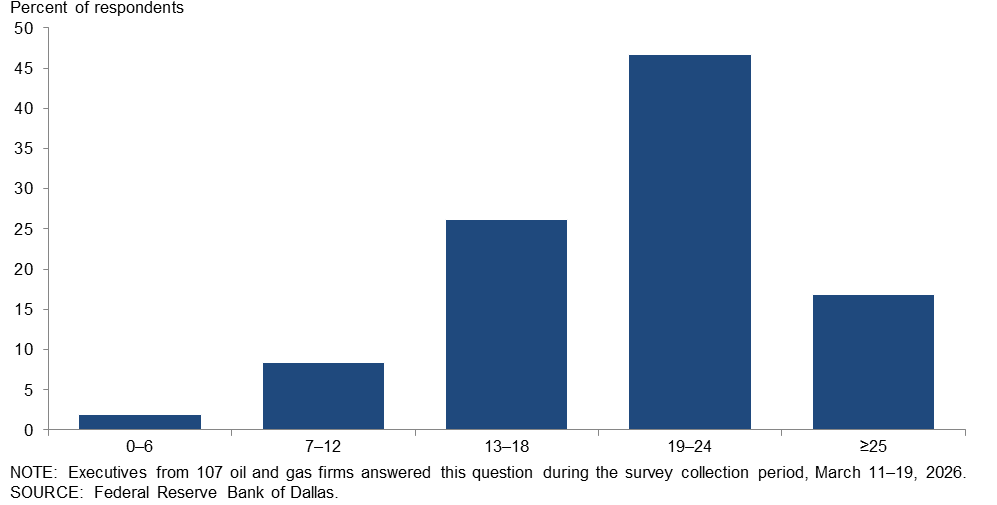
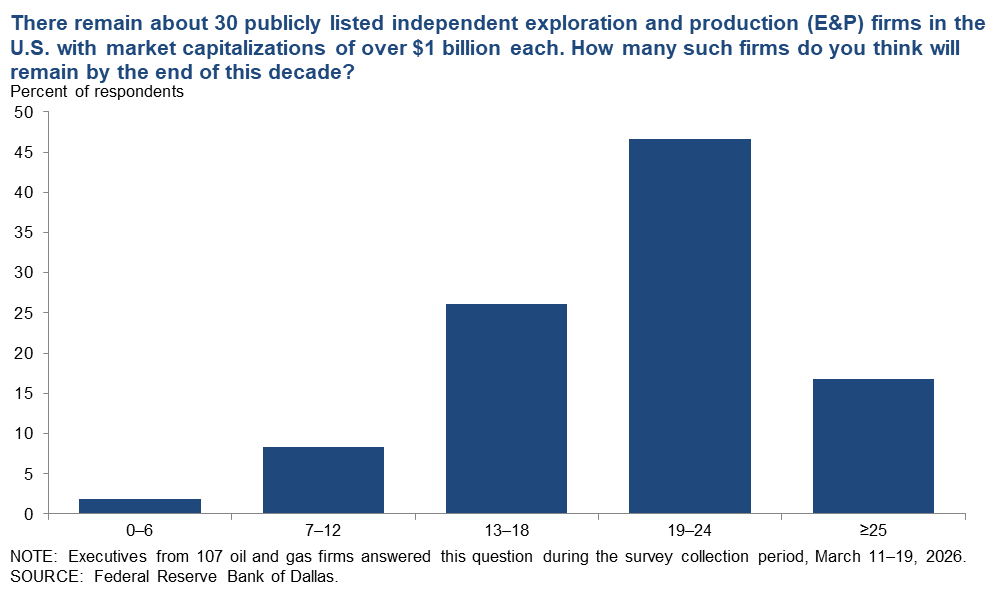
There remain about 30 publicly listed independent exploration and production (E&P) firms in the U.S. with market capitalizations of over $1 billion each. How many such firms do you think will remain by the end of this decade?
The most selected response was “19–24” (47 percent of respondents), followed by “13–18” (26 percent) and “≥25” (17 percent). A smaller percentage selected “7–12” and “0–6.”
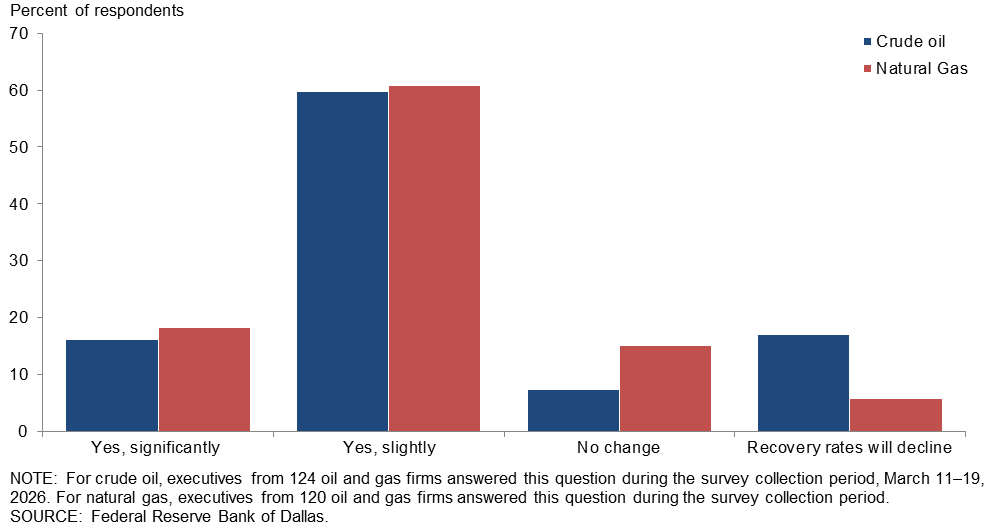
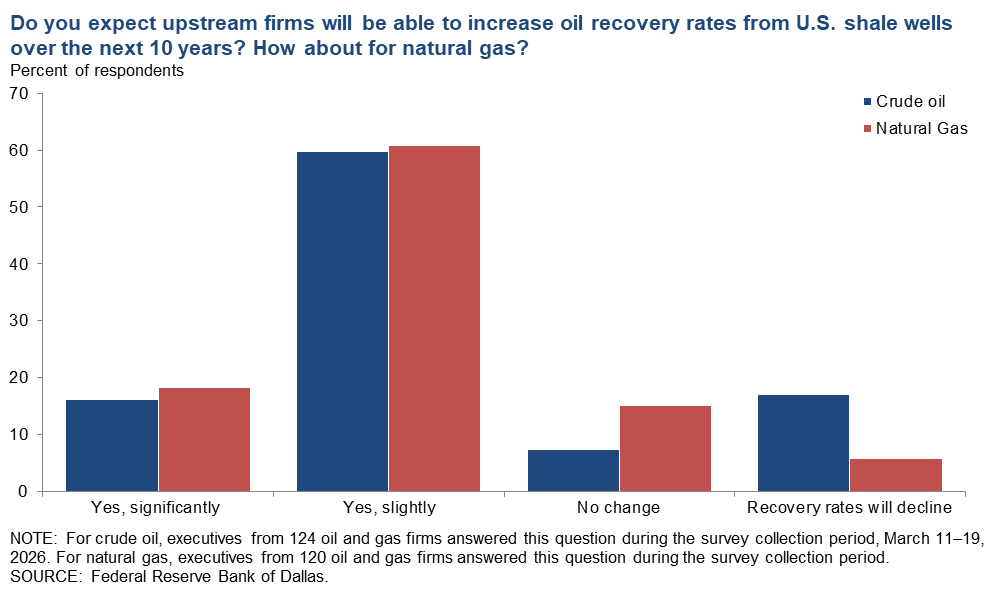
Do you expect upstream firms will be able to increase oil recovery rates from U.S. shale wells over the next 10 years? How about for natural gas?
Firms generally expect recovery rates to increase over the next 10 years. For both crude oil and natural gas, the most selected response was “yes, slightly.” Firms were slightly more optimistic about improving recovery rates for natural gas than crude oil.
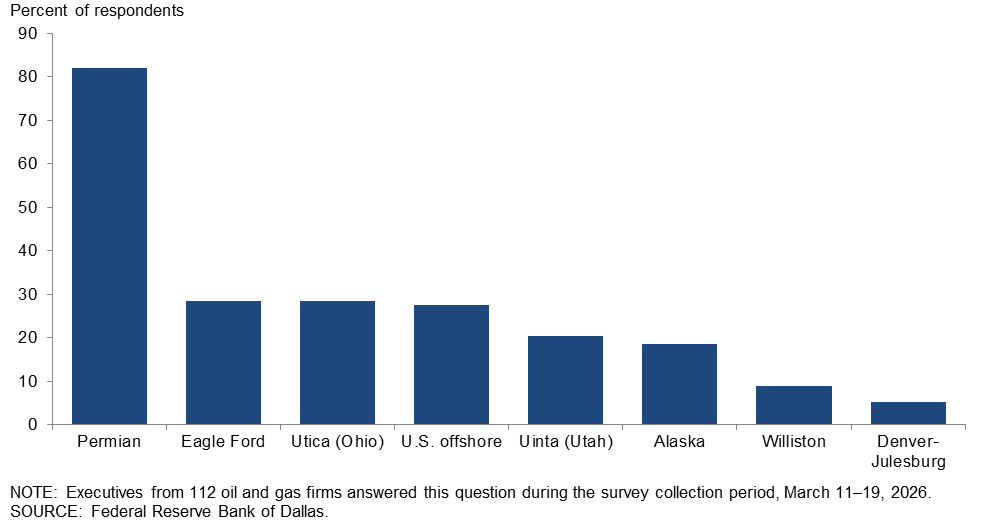
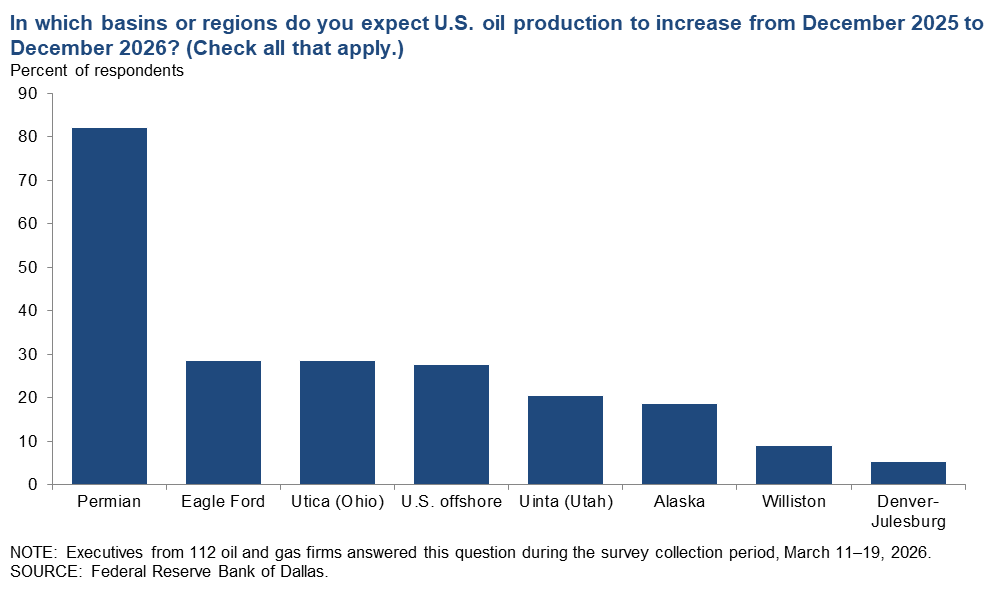
In which basins or regions do you expect U.S. oil production to increase from December 2025 to December 2026? (Check all that apply.)
Respondents could choose more than one answer for this special question. The most selected response was "Permian" (82 percent of respondents), with “Eagle Ford” and “Utica (Ohio)” each selected by 29 percent of respondents.
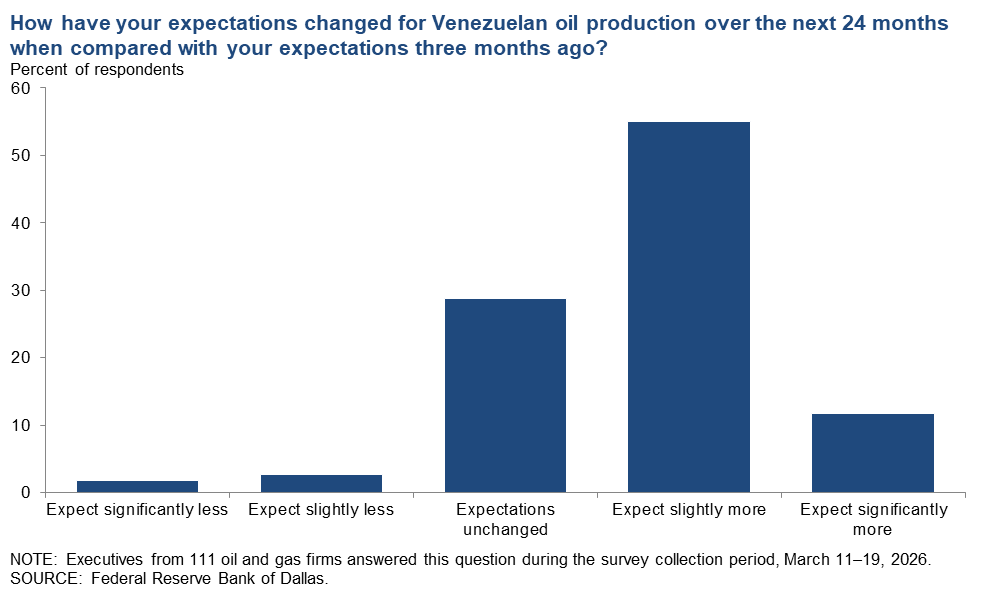
How have your expectations changed for Venezuelan oil production over the next 24 months when compared with your expectations three months ago?
The largest group, 55 percent of executives, expect slightly more Venezuelan oil production over the next 24 months when compared to expectations three months ago. Twenty-nine percent of executives have not changed their expectations, while 12 percent expect significantly more production. A smaller percentage expect either slightly less or significantly less production from Venezuela.

Special questions comments
Exploration and production (E&P) firms
- We are drilling six wells in 2026 vs. zero prior to the increase in oil prices.
- Until the conflict with Iran is stopped, the price risk of oil and natural gas increases will continue and likely exaggerate with a clear inflation rate increase.
- I think our operators are going to take a wait-and-see stance on any increased drilling plans to see how oil and gas prices fare over the next six months. We could all use what could be a short-term cash flow boost to repair balance sheets, reduce debt and get caught up on deferred but necessary capital spending, operating spending and general spending outside of drilling.
- Oil prices are high but will fall dramatically as soon as the new government in Iran is announced.
- The price spike is driven by geopolitical factors.
- Sacramento-orchestrated political roadblocks hamper operations in central California, adding burdensome costs and restrictions. The results are a crumbling infrastructure and companies, refineries and pipelines struggling.
- It is important to emphasize the phrasing “be able to.” Technically, upstream firms will always be able to increase recovery from U.S. shale wells; the real question is economic, not technical. The key consideration is how much it costs per barrel or per million cubic feet to achieve additional recovery and whether that cost justifies further drilling or development.
- The geopolitical aspect of our industry cannot be ignored. Today there is Iran’s efforts to close the Strait of Hormuz and the continued Ukrainian war with Russia. Technology changes in how wars are fought. China and Taiwan are brewing. One has to expect wild swings based on world conflict. U.S. reserves are about half of what full can be. Our consumption rate of about 8 million barrels per day of oil from overseas is due to the type of oil we are harvesting from West Texas and other shale regions. Light oil does not make asphalt and other things. Venezuelan oil was perfectly timed by the current administration to gain access to it for the Iran War.
- Overall, the future of the oil and gas industry looks good.
- I don't like profiting from a war. I didn't choose this, and it feels awful. I hope a better Iran comes from the ashes, but we don't have a good track record there.
- We do not agree with expectations that the price of oil will retreat to the $50s.
Oil and gas support services firms
- Venezuela production will eventually rise significantly. However, it will take significant investment, which will be driven by political stability.
- There will be great opportunity for private independent exploration and production firms to pick up surplus acreage from large public E&P firms as they focus on their key acreage.
Additional comments »
Historical data are available from first quarter 2016 to the most current release quarter.
Business indicators: quarter/quarter
| Business Indicators: All Firms Current Quarter (versus previous quarter) | |||||
| Indicator | Current Index | Previous Index | % Reporting Increase | % Reporting No Change | % Reporting Decrease |
Level of Business Activity | 21.0 | –6.2 | 38.3 | 44.4 | 17.3 |
Capital Expenditures | 21.2 | –11.6 | 39.4 | 42.4 | 18.2 |
Supplier Delivery Time | 4.5 | 0.8 | 9.8 | 84.8 | 5.3 |
Employment | 0.8 | –10.8 | 14.4 | 72.0 | 13.6 |
Employee Hours | 12.8 | –9.3 | 21.1 | 70.7 | 8.3 |
Wages and Benefits | 23.5 | 6.2 | 28.0 | 67.4 | 4.5 |
| Indicator | Current Index | Previous Index | % Reporting Improved | % Reporting No Change | % Reporting Worsened |
Company Outlook | 32.2 | –15.2 | 47.1 | 38.0 | 14.9 |
| Indicator | Current Index | Previous Index | % Reporting Increase | % Reporting No Change | % Reporting Decrease |
Uncertainty | 53.7 | 43.4 | 59.7 | 34.3 | 6.0 |
| Business Indicators: E&P Firms Current Quarter (versus previous quarter) | |||||
| Indicator | Current Index | Previous Index | % Reporting Increase | % Reporting No Change | % Reporting Decrease |
Level of Business Activity | 16.6 | –5.6 | 32.2 | 52.2 | 15.6 |
Oil Production | 0.0 | –3.4 | 24.4 | 51.1 | 24.4 |
Natural Gas Wellhead Production | 2.3 | 0.0 | 27.0 | 48.3 | 24.7 |
Capital Expenditures | 18.0 | –15.9 | 39.3 | 39.3 | 21.3 |
Expected Level of Capital Expenditures Next Year | 31.5 | –13.9 | 42.7 | 46.1 | 11.2 |
Supplier Delivery Time | 0.0 | –2.3 | 5.6 | 88.9 | 5.6 |
Employment | –4.5 | –9.0 | 7.9 | 79.8 | 12.4 |
Employee Hours | 8.8 | –5.6 | 14.4 | 80.0 | 5.6 |
Wages and Benefits | 22.5 | 7.9 | 27.0 | 68.5 | 4.5 |
Finding and Development Costs | 22.3 | 5.7 | 25.6 | 71.1 | 3.3 |
Lease Operating Expenses | 30.0 | 28.4 | 37.8 | 54.4 | 7.8 |
| Indicator | Current Index | Previous Index | % Reporting Improved | % Reporting No Change | % Reporting Worsened |
Company Outlook | 33.3 | –15.2 | 46.9 | 39.5 | 13.6 |
| Indicator | Current Index | Previous Index | % Reporting Increase | % Reporting No Change | % Reporting Decrease |
Uncertainty | 60.4 | 41.6 | 63.7 | 33.0 | 3.3 |
| Business Indicators: O&G Support Services Firms Current Quarter (versus previous quarter) | |||||
| Indicator | Current Index | Previous Index | % Reporting Increase | % Reporting No Change | % Reporting Decrease |
Level of Business Activity | 30.3 | –7.3 | 51.2 | 27.9 | 20.9 |
Utilization of Equipment | 30.2 | –12.2 | 48.8 | 32.6 | 18.6 |
Capital Expenditures | 27.9 | –2.4 | 39.5 | 48.8 | 11.6 |
Supplier Delivery Time | 14.2 | 7.3 | 19.0 | 76.2 | 4.8 |
Lag Time in Delivery of Firm's Services | 9.5 | 9.7 | 11.9 | 85.7 | 2.4 |
Employment | 11.6 | –14.6 | 27.9 | 55.8 | 16.3 |
Employment Hours | 20.9 | –17.1 | 34.9 | 51.2 | 14.0 |
Wages and Benefits | 25.5 | 2.4 | 30.2 | 65.1 | 4.7 |
Input Costs | 34.9 | 24.4 | 34.9 | 65.1 | 0.0 |
Prices Received for Services | 9.3 | –30.0 | 18.6 | 72.1 | 9.3 |
Operating Margin | –7.0 | –31.7 | 16.3 | 60.5 | 23.3 |
| Indicator | Current Index | Previous Index | % Reporting Improved | % Reporting No Change | % Reporting Worsened |
Company Outlook | 30.0 | –15.4 | 47.5 | 35.0 | 17.5 |
| Indicator | Current Index | Previous Index | % Reporting Increase | % Reporting No Change | % Reporting Decrease |
Uncertainty | 39.6 | 47.5 | 51.2 | 37.2 | 11.6 |
Business indicators: year/year
| Business Indicators: All Firms Current Quarter (versus same quarter a year ago) | |||||
| Indicator | Current Index | Previous Index | % Reporting Increase | % Reporting No Change | % Reporting Decrease |
Level of Business Activity | 17.7 | –18.7 | 42.3 | 33.1 | 24.6 |
Capital Expenditures | 14.8 | –10.8 | 41.9 | 31.0 | 27.1 |
Supplier Delivery Time | 5.5 | 1.6 | 14.1 | 77.3 | 8.6 |
Employment | 5.3 | –11.3 | 23.8 | 57.7 | 18.5 |
Employee Hours | 8.4 | –12.9 | 21.5 | 65.4 | 13.1 |
Wages and Benefits | 41.6 | 22.8 | 48.5 | 44.6 | 6.9 |
| Indicator | Current Index | Previous Index | % Reporting Improved | % Reporting No Change | % Reporting Worsened |
Company Outlook | 26.5 | –28.8 | 46.0 | 34.5 | 19.5 |
| Business Indicators: E&P Firms Current Quarter (versus same quarter a year ago) | |||||
| Indicator | Current Index | Previous Index | % Reporting Increase | % Reporting No Change | % Reporting Decrease |
Level of Business Activity | 19.6 | –19.7 | 41.4 | 36.8 | 21.8 |
Oil Production | 4.6 | –3.5 | 37.9 | 28.7 | 33.3 |
Natural Gas Wellhead Production | 3.6 | –5.9 | 36.9 | 29.8 | 33.3 |
Capital Expenditures | 11.7 | –10.4 | 41.9 | 27.9 | 30.2 |
Expected Level of Capital Expenditures Next Year | 28.5 | –16.9 | 45.2 | 38.1 | 16.7 |
Supplier Delivery Time | 4.6 | 1.2 | 11.6 | 81.4 | 7.0 |
Employment | 1.1 | –3.4 | 17.2 | 66.7 | 16.1 |
Employee Hours | 3.4 | –4.6 | 14.9 | 73.6 | 11.5 |
Wages and Benefits | 40.2 | 25.3 | 47.1 | 46.0 | 6.9 |
Finding and Development Costs | 27.9 | 5.8 | 36.0 | 55.8 | 8.1 |
Lease Operating Expenses | 48.8 | 32.2 | 55.8 | 37.2 | 7.0 |
| Indicator | Current Index | Previous Index | % Reporting Improved | % Reporting No Change | % Reporting Worsened |
Company Outlook | 27.7 | –26.3 | 47.4 | 32.9 | 19.7 |
| Business Indicators: O&G Support Services Firms Current Quarter (versus same quarter a year ago) | |||||
| Indicator | Current Index | Previous Index | % Reporting Increase | % Reporting No Change | % Reporting Decrease |
Level of Business Activity | 14.0 | –16.2 | 44.2 | 25.6 | 30.2 |
Utilization of Equipment | 11.6 | –27.8 | 39.5 | 32.6 | 27.9 |
Capital Expenditures | 21.0 | –11.4 | 41.9 | 37.2 | 20.9 |
Supplier Delivery Time | 7.1 | 2.7 | 19.0 | 69.0 | 11.9 |
Lag Time in Delivery of Firm's Services | 17.1 | 8.3 | 19.5 | 78.0 | 2.4 |
Employment | 13.9 | –29.7 | 37.2 | 39.5 | 23.3 |
Employment Hours | 18.6 | –32.4 | 34.9 | 48.8 | 16.3 |
Wages and Benefits | 44.2 | 16.7 | 51.2 | 41.9 | 7.0 |
Input Costs | 50.0 | 44.5 | 52.4 | 45.2 | 2.4 |
Prices Received for Services | 0.0 | –29.7 | 26.2 | 47.6 | 26.2 |
Operating Margin | –13.9 | –34.3 | 25.6 | 34.9 | 39.5 |
Activity chart
Comments from Survey Respondents
Survey participants are given the opportunity to submit comments on current issues that may be affecting their businesses. Some comments have been edited for grammar and clarity. Comments from the Special Questions survey can be found below the special questions.
Exploration and production (E&P) firms
- Volatility has increased due to geopolitical events. The second- and third-order effects of this volatility and the commodity supply and price shock have yet to be determined, but the focus on energy security over the coming years should position U.S. producers well on the global stage. U.S. shale has the capacity to grow production, likely significantly if needed, should this price environment remain.
- The Iran conflict has increased uncertainty globally, and here in Lower 48 as well.
- It feels as though we've lost control of the Iran war. The divergence between paper barrels and physical is ironically large enough to steer a tanker through. It's unclear if government entities are trying to steer the paper market down. If the strait doesn't open in the next two weeks, we think you're looking at $170 per barrel and basically guaranteed recession. Asia and Europe are likely in a lot of trouble in the immediate term. We will need a Marshall Plan on the back end to create stability in the region and long-term stability in energy markets.
- The Strait of Hormuz adds complexity. Suppliers are already trying to increase pricing, and the administration continues to try and talk down [oil] prices. How sustainable are current oil prices? Hard to make long-term commitments or to "drill, baby, drill."
- The volatility across all the commodities is just insane and makes planning very difficult.
- In the quarter ahead, all pricing is uncertain until safe navigation through the Strait of Hormuz can be achieved. I would think any short- or long-term planning has been put on hold for the next two to three months.
- The Iran War has created volatility. The duration of the war will dictate where oil prices go and ultimately global natural gas prices. The timing of new natural gas pipelines serving the Permian Basin will be critical to determine when Permian natural gas prices recover from negative index prices creating a drag on profitability and returns on drilling new wells.
- Everyone is hoping and praying for a quick end to the war.
- Contract cementing, logging and perforating costs have increased significantly for similar completion work.
- The restrictions now occurring in the Strait of Hormuz and Red Sea will increase the erratic increases in price of natural gas and oil, and that process is likely to continue through year-end without a settlement of the Iran War.
- A certain amount of uncertainty exists because of the military conflict in Iran.
- In my opinion, the war in Iran will have long and far-reaching, often unexpected consequences. This is similar to how sudden changes in economic policy can produce delayed and variable effects, leading to outcomes that are difficult to predict.
- The commodity ramp-up with the Iran conflict makes pursuing merger-and-acquisition-type work challenging as buyers often don't anticipate prices at a high level, but sellers will.
- The uncertainties are currently off the charts. Who knows where we will be later this year?
- The war in Iran is wreaking havoc in industry. The administration announced a new refinery, the first in 50 years. We will be able to refine our sweet crude. Eliminate the Jones Act, and go back to winter blend gasoline to help control gasoline prices.
- The uncertainty over the duration of the conflict in Iran as well as the impact of curtailment or shut-in on Middle Eastern oil production are issues affecting our business.
- Certainly the war will help profits this year. It remains to be seen if these will offset last year’s losses.
- It is a chaotic situation in Middle East. There are Strait of Hormuz closure issues ongoing. The appetite of the U.S. and its allies for engagement in war to conclusion (i.e. to the point where it is assured that Iran will be unable to produce a nuclear weapon) is unclear. Geopolitical issues are always a threat, now amplified.
- The unpredictable outcome of the hostilities in the Middle East makes price future predictions highly tenuous. Thus, the precariousness involved in planning future activity increases. Price volatility in the futures market yields a rare opportunity for hedging future production and trading.
- The war has caused a very temporary (and welcome) uptick in oil prices, but these will drop back as soon as hostilities end. This is a black swan event.
- Local activity and smaller independents (like me) are back to basics.
- Price uncertainty has increased for both crude oil and natural gas which widens the gap between buyers and sellers. We hedged the gas price for a portion of our 2026 gas production, fortunately.
- Geopolitical factors have roared back in global commodity pricing.
- Obviously crude and natural gas prices have increased because of the Iran war, which has disrupted global energy supplies mostly due to issues in the Strait of Hormuz constraining shipping. Concerns for oil operators will be predictions of capital cost increases (how long the war lasts is uncertain) in attempting to increase drilling activity due to the increased oil and gas prices. Uncertainty is the main concern for long-term planning. Sudden rises in oil and gas prices are beneficial to our cash flow but very problematic to the U.S. economy. As a producer, we find the short-term gains in profits certainly are not beneficial for long-term stability in our industry. Refiners are the first to benefit from oil price increases, as they inflate inventories of gasoline immediately, basing their costs on future costs, not inventory actual costs. Once again, oil companies get a bad rap for increasing gasoline prices when in reality it’s the refiners who profit from immediate inventory valuations.
- Between the historic January winter storm and the Iran war, our company strategy of selling into the spot market has been affirmed by these recent events. Fundamentally, we understand the premium that comes with one-off events like these, but they are still meaningful to our bottom line and also move the needle fundamentally per commodity.
- Most of the East Texas basin is natural gas. With demand rising for electrical use by data centers and artificial intelligence, along with the administration’s tariff policy that is bringing in manufacturing from outside our country, I feel strongly that natural gas demand will increase. LNG exports will place a huge demand for natural gas. I am more bullish on natural gas pricing than oil pricing.
- Conflict with Iran makes everything a wild card. The November midterm elections put political pressure on wrapping up conflict with a success, so a new normal can be hypothesized. Inflation will increase, hence interest rates. Oil country tubular goods are already feeling the impact of tariffs. Additional well fittings and equipment may not only get more expensive, but get downright scarce. Product prices (crude oil and gasoline) won’t stay high long. Political actions to reduce prices before the midterms and thereafter, especially if Democrats sweep the midterms, will hurt the domestic industry.
- Our current capital spending is based on minimum volume commitments we are required to deliver. Changes in prices will not affect our capital spending. Additionally, most of our production is natural gas.
- We really have no idea.
Oil and gas support services firms
- The shutting of the Strait of Hormuz causes great uncertainty for the global economy and will ultimately impact our business. This impact will likely be in multiple ways, including some that we don't currently foresee.
- It is tough to summarize our outlook in the usual fashion. The conflict in the Middle East has made the near-term outlook quite a bit worse but may ultimately improve the mid- to longer-term outlook.
- While our firm does not have a material presence in the Middle East, the global uncertainty that exists as a result of the conflict impacts our outlook at this point. It is extremely difficult to estimate commodity prices nine to 10 months other than to guess that oil and gas prices are likely be slightly elevated above pre-conflict levels as markets catch up with lost activity or deliveries during the war.
- We anticipate some increase in rig utilization but not enough to dramatically impact rig rates.
- The demand for industrial engines for power generation and other sectors is vastly outpacing supply. Lead times for large horsepower engines is now 100-plus weeks.
- I think the war will be over soon, and prices will stabilize.
- Companies remain stuck in an unsustainable business environment where the costs of inputs for oilfield service equipment continue to increase but customers continue to push prices down.
- Strange days indeed.
Questions regarding the Dallas Fed Energy Survey can be addressed to Michael Plante at Michael.Plante@dal.frb.org or Kunal Patel at Kunal.Patel@dal.frb.org.
Sign up for our email alert to be automatically notified as soon as the latest Dallas Fed Energy Survey is released on the web. For additional energy-related academic research and market analysis, please visit the Dallas Fed’s Center for Energy and the Economy.