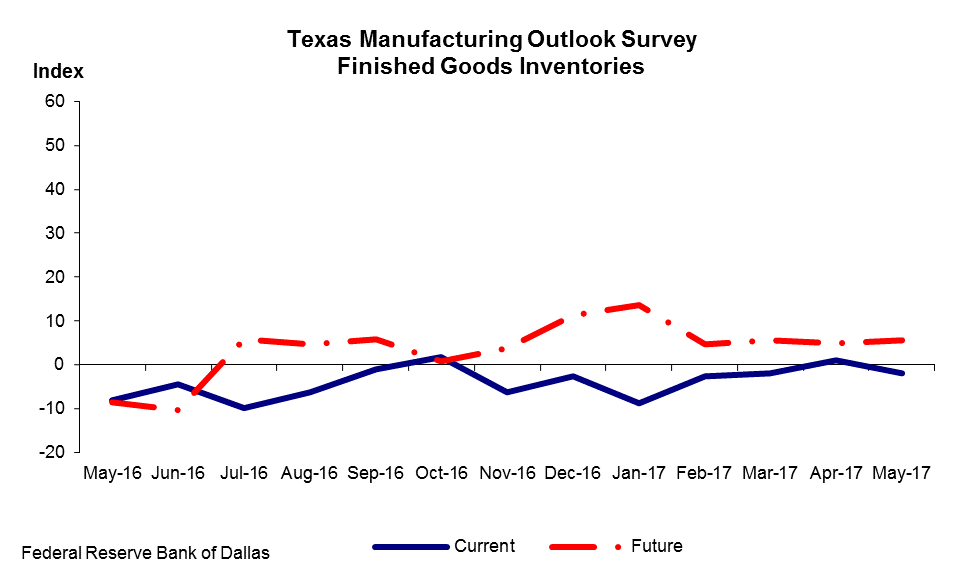
Texas Manufacturing Outlook Survey
Finished Goods Inventories Index
May 2017

Finished Goods Inventories—Index
| May 16 | Jun 16 | Jul 16 | Aug 16 | Sep 16 | Oct 16 | Nov 16 | Dec 16 | Jan 17 | Feb 17 | Mar 17 | Apr 17 | May 17 |
Current Finished Goods Inventories, seasonally adjusted | ||||||||||||
–8.1 | –4.4 | –9.9 | –6.3 | –0.9 | 1.8 | –6.3 | –2.7 | –8.8 | –2.6 | –1.8 | 1.0 | –1.8 |
Future Finished Goods Inventories, seasonally adjusted (six months from report period) | ||||||||||||
–8.6 | –10.2 | 5.9 | 4.7 | 5.8 | 0.9 | 3.8 | 11.3 | 13.7 | 4.6 | 5.5 | 4.9 | 5.5 |
Finished Goods Inventories—Composition of Responses
| May 16 | Jun 16 | Jul 16 | Aug 16 | Sep 16 | Oct 16 | Nov 16 | Dec 16 | Jan 17 | Feb 17 | Mar 17 | Apr 17 | May 17 | |
Current Finished Goods Inventories, seasonally adjusted | |||||||||||||
% Increase | 13.5 | 14.0 | 11.7 | 12.6 | 13.9 | 15.7 | 17.1 | 14.3 | 14.9 | 12.3 | 13.0 | 15.0 | 12.6 |
% No Change | 64.9 | 67.5 | 66.7 | 68.5 | 71.3 | 70.4 | 59.5 | 68.8 | 61.4 | 72.8 | 72.2 | 71.0 | 73.0 |
% Decrease | 21.6 | 18.4 | 21.6 | 18.9 | 14.8 | 13.9 | 23.4 | 17.0 | 23.7 | 14.9 | 14.8 | 14.0 | 14.4 |
Future Finished Goods Inventories, seasonally adjusted (six months from report period) | |||||||||||||
% Increase | 11.4 | 12.0 | 18.8 | 19.8 | 17.6 | 15.9 | 16.3 | 20.6 | 22.9 | 19.1 | 17.4 | 13.7 | 15.6 |
% No Change | 68.6 | 65.7 | 68.3 | 65.1 | 70.6 | 69.2 | 71.2 | 70.1 | 67.9 | 66.4 | 70.6 | 77.5 | 74.3 |
% Decrease | 20.0 | 22.2 | 12.9 | 15.1 | 11.8 | 15.0 | 12.5 | 9.3 | 9.2 | 14.5 | 11.9 | 8.8 | 10.1 |
NOTE: Survey responses are used to calculate an index for each indicator. Each index is calculated by subtracting the percentage of respondents reporting a decrease from the percentage reporting an increase. When the share of firms reporting an increase exceeds the share of firms reporting a decrease, the index will be greater than zero, suggesting the indicator has increased over the prior month. If the share of firms reporting a decrease exceeds the share reporting an increase, the index will be below zero, suggesting the indicator has decreased over the prior month. An index will be zero when the number of firms reporting an increase is equal to the number of firms reporting a decrease. Items may not add up to 100 percent because of rounding.
Questions regarding the Texas Manufacturing Outlook Survey can be addressed to Emily Kerr at emily.kerr@dal.frb.org.
Sign up for our free e-mail alert to be automatically notified as soon as the latest Texas Manufacturing Outlook Survey is released on the web.