Texas Manufacturing Outlook Survey

June 24, 2019
Texas Manufacturing Expansion Continues, but Outlooks Worsen and Uncertainty Rises
What’s New This Month
For this month’s survey, Texas business executives were asked supplemental questions on the impact of tariffs. Results for these questions from the Texas Manufacturing Outlook Survey, Texas Service Sector Outlook Survey and Texas Retail Outlook Survey have been released together. Read the Special Questions results.
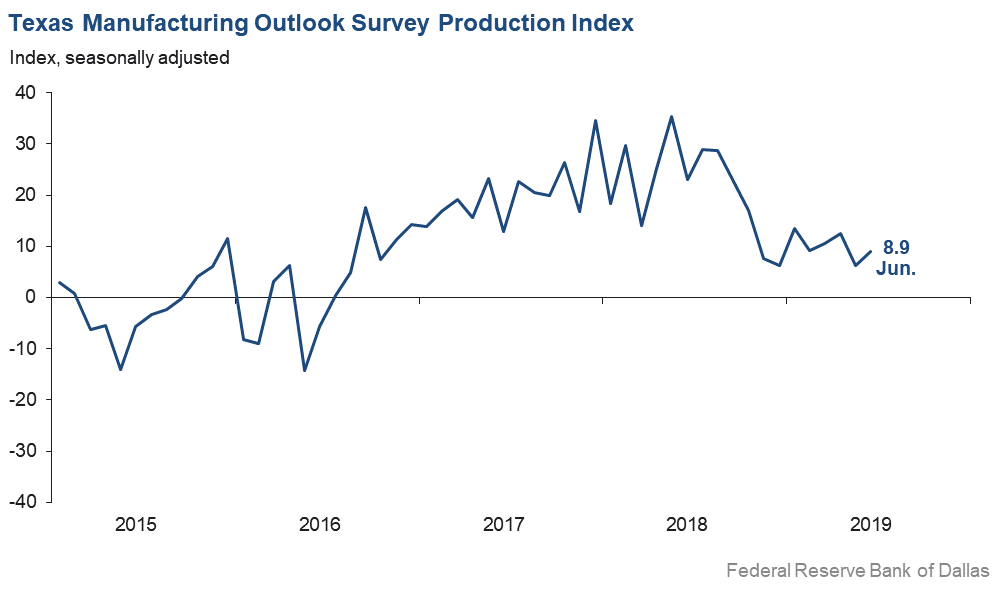
Texas factory activity continued to expand in June, according to business executives responding to the Texas Manufacturing Outlook Survey. The production index, a key measure of state manufacturing conditions, rose from 6.3 to 8.9, indicating output growth accelerated slightly from May.
Other measures of manufacturing activity exhibited mixed movements in June. The new orders index edged up to 3.7, a reading still below average. The growth rate of orders index fell eight points to -6.7, reaching its lowest reading in nearly three years. The capacity utilization index inched up to 9.6, while the shipments index retreated six points to 1.7, a two-year low. The capital expenditures index posted a double-digit decline, falling 11 points to 6.9, also a two-year low.
Perceptions of broader business conditions shifted down again in June. The general business activity index pushed further into negative territory as more firms noted worsened activity this month than last. The index declined from -5.3 to -12.1, hitting a three-year low. Similarly, the company outlook index fell from -1.7 to -5.5, also a three-year low. The index measuring uncertainty regarding companies’ outlooks pushed up to 21.6, its highest reading since the question was added to the survey in January 2018.
Labor market measures suggested solid, but somewhat slower, growth in employment and work hours in June. The employment index slipped from 11.6 to 8.8 but remained slightly above average. Nineteen percent of firms noted net hiring, while 10 percent noted net layoffs. The hours worked index remained above average as well but inched down to 4.7.
Upward pressure on input costs increased in June, while pressure on selling prices remained muted and wage pressure moderated. The raw materials prices index rose nine points to 16.4. The finished goods prices index was largely unchanged at 1.2, with the near-zero reading suggesting virtually no growth in selling prices this month. The wages and benefits index dropped five points to 22.7, closer to the long-run average for this measure.
Expectations regarding future business conditions were mixed. The index of future general business activity dropped 12 points to -2.7, with more firms expecting worsened activity six months from now than improved. The index of future company outlook fell eight points but remained positive at 3.6. Other indexes of future manufacturing activity declined this month but stayed in positive territory.
Next release: Monday, July 29
|
Data were collected June 11–19, and 116 Texas manufacturers responded to the survey. The Dallas Fed conducts the Texas Manufacturing Outlook Survey monthly to obtain a timely assessment of the state’s factory activity. Firms are asked whether output, employment, orders, prices and other indicators increased, decreased or remained unchanged over the previous month. Survey responses are used to calculate an index for each indicator. Each index is calculated by subtracting the percentage of respondents reporting a decrease from the percentage reporting an increase. When the share of firms reporting an increase exceeds the share reporting a decrease, the index will be greater than zero, suggesting the indicator has increased over the prior month. If the share of firms reporting a decrease exceeds the share reporting an increase, the index will be below zero, suggesting the indicator has decreased over the prior month. An index will be zero when the number of firms reporting an increase is equal to the number of firms reporting a decrease. Data have been seasonally adjusted as necessary. |
June 24, 2019
Results Summary
Historical data are available from June 2004 to the most current release month.
| Business Indicators Relating to Facilities and Products in Texas Current (versus previous month) | ||||||||
| Indicator | Jun Index | May Index | Change | Indicator Direction* | Trend** (Months) | % Reporting Increase | % Reporting No Change | % Reporting Decrease |
Production | 8.9 | 6.3 | +2.6 | Increasing | 36 | 27.3 | 54.3 | 18.4 |
Capacity Utilization | 9.6 | 7.7 | +1.9 | Increasing | 36 | 26.9 | 55.8 | 17.3 |
New Orders | 3.7 | 2.4 | +1.3 | Increasing | 32 | 25.8 | 52.1 | 22.1 |
Growth Rate of Orders | –6.7 | 1.1 | –7.8 | Decreasing | 1 | 17.8 | 57.7 | 24.5 |
Unfilled Orders | 3.4 | –1.6 | +5.0 | Increasing | 1 | 16.6 | 70.2 | 13.2 |
Shipments | 1.7 | 7.6 | –5.9 | Increasing | 31 | 24.1 | 53.5 | 22.4 |
Delivery Time | –0.3 | 6.5 | –6.8 | Decreasing | 1 | 10.8 | 78.1 | 11.1 |
Finished Goods Inventories | –6.1 | –6.2 | +0.1 | Decreasing | 3 | 12.2 | 69.6 | 18.3 |
Prices Paid for Raw Materials | 16.4 | 7.4 | +9.0 | Increasing | 39 | 27.2 | 62.0 | 10.8 |
Prices Received for Finished Goods | 1.2 | 0.7 | +0.5 | Increasing | 35 | 13.2 | 74.8 | 12.0 |
Wages and Benefits | 22.7 | 27.6 | –4.9 | Increasing | 119 | 24.3 | 74.1 | 1.6 |
Employment | 8.8 | 11.6 | –2.8 | Increasing | 30 | 18.8 | 71.2 | 10.0 |
Hours Worked | 4.7 | 6.4 | –1.7 | Increasing | 32 | 17.4 | 69.9 | 12.7 |
Capital Expenditures | 6.9 | 18.3 | –11.4 | Increasing | 34 | 19.1 | 68.7 | 12.2 |
| General Business Conditions Current (versus previous month) | ||||||||
| Indicator | Jun Index | May Index | Change | Indicator Direction* | Trend** (Months) | % Reporting Improved | % Reporting No Change | % Reporting Worsened |
Company Outlook | –5.5 | –1.7 | –3.8 | Worsening | 2 | 18.0 | 58.5 | 23.5 |
General Business Activity | –12.1 | –5.3 | –6.8 | Worsening | 2 | 13.7 | 60.5 | 25.8 |
| Indicator | Jun Index | May Index | Change | Indicator Direction* | Trend** (Months) | % Reporting Increase | % Reporting No Change | % Reporting Decrease |
Outlook Uncertainty† | 21.6 | 16.1 | +5.5 | Increasing | 13 | 32.8 | 56.0 | 11.2 |
| Business Indicators Relating to Facilities and Products in Texas Future (six months ahead) | ||||||||
| Indicator | Jun Index | May Index | Change | Indicator Direction | Trend* (Months) | % Reporting Increase | % Reporting No Change | % Reporting Decrease |
Production | 25.2 | 36.5 | –11.3 | Increasing | 124 | 42.8 | 39.5 | 17.6 |
Capacity Utilization | 25.9 | 34.8 | –8.9 | Increasing | 124 | 40.3 | 45.3 | 14.4 |
New Orders | 22.3 | 35.2 | –12.9 | Increasing | 124 | 38.6 | 45.1 | 16.3 |
Growth Rate of Orders | 17.2 | 25.3 | –8.1 | Increasing | 124 | 32.8 | 51.6 | 15.6 |
Unfilled Orders | 2.1 | 2.0 | +0.1 | Increasing | 45 | 12.7 | 76.7 | 10.6 |
Shipments | 28.4 | 32.2 | –3.8 | Increasing | 124 | 41.2 | 46.0 | 12.8 |
Delivery Time | 8.7 | 1.2 | +7.5 | Increasing | 31 | 15.0 | 78.7 | 6.3 |
Finished Goods Inventories | 4.8 | –11.5 | +16.3 | Increasing | 1 | 14.2 | 76.4 | 9.4 |
Prices Paid for Raw Materials | 21.5 | 28.9 | –7.4 | Increasing | 123 | 28.0 | 65.4 | 6.5 |
Prices Received for Finished Goods | 15.0 | 6.7 | +8.3 | Increasing | 41 | 27.1 | 60.7 | 12.1 |
Wages and Benefits | 39.6 | 32.8 | +6.8 | Increasing | 181 | 40.9 | 57.8 | 1.3 |
Employment | 20.2 | 28.9 | –8.7 | Increasing | 79 | 29.7 | 60.8 | 9.5 |
Hours Worked | 8.2 | 2.8 | +5.4 | Increasing | 37 | 17.5 | 73.2 | 9.3 |
Capital Expenditures | 22.5 | 22.8 | –0.3 | Increasing | 115 | 31.1 | 60.3 | 8.6 |
| General Business Conditions Future (six months ahead) | ||||||||
| Indicator | Jun Index | May Index | Change | Indicator Direction* | Trend** (Months) | % Reporting Increase | % Reporting No Change | % Reporting Worsened |
Company Outlook | 3.6 | 11.5 | –7.9 | Improving | 41 | 24.6 | 54.4 | 21.0 |
General Business Activity | –2.7 | 9.1 | –11.8 | Worsening | 1 | 19.5 | 58.3 | 22.2 |
*Indicator direction refers to this month's index. If index is positive (negative), indicator is increasing (decreasing) or improving (worsening). If zero, indicator is unchanged.
**Number of months moving in current direction.
†Added to survey in January 2019.
Data have been seasonally adjusted as necessary, with the exception of the outlook uncertainty index, which does not yet have a sufficiently long time series to test for seasonality.
June 24, 2019
Production Index
June 24, 2019
Comments from Survey Respondents
These comments are from respondents' completed surveys and have been edited for publication.
Chemical Manufacturing
- We have seen a slight increase in exports.
Primary Metal Manufacturing
- We have seen a decline in energy-related orders, specifically with the oil and gas sector. Another key issue we continue to face is the lack of available workforce applicants. We simply cannot fill openings, both skilled and general manufacturing labor. There is a desperate need in all sectors we work with for additional work visas.
Fabricated Metal Product Manufacturing
- I don’t care what the indicators say—things are slowing down in energy and manufacturing. Construction is still strong(ish). But, customers are shopping every nickel, quoting and requoting; no one wants inventory. Steel prices are dropping like a rock due to lack of demand and overcapacity. It is rough waters right now, for the last 60–90 days.
- We have significant project quotes outstanding, but there seems to be a slowdown in the owners’ willingness to start projects.
Nonmetallic Mineral Product Manufacturing
- Tariffs simply increase our raw materials prices, which we pass on to our customers in the form of price increases on new projects. It does not affect us competitively because our competition has the same issue.
- China tariffs are a big drain on profits, so we are covering with a general price increase July 1. Future improvements are expected due to new product introductions.
Machinery Manufacturing
- Uncertainty stifles hiring, expansion and capital expenditures. Threats of tariffs cause uncertainty. The businesses lobbying for tariffs are incapable of competing on a level playing field. Those businesses should be allowed to fail and make room for new businesses. Using public money to support private business allows the government to buy votes and pick winners. Central planning is a failed philosophy. Better to allow the “creative destruction of the free market” to rid itself of inefficient producers.
- It is hard to quantify, but we’ve taken steps to prepare for a slowdown even though we’re not seeing it yet. We are still quoting many jobs, but we are receiving feedback that business development is taking hard looks at everything now. I believe that with oil prices falling, oil companies will pull back their budgets, and that we will be affected. Consequently, we’ve canceled or reduced orders for inventory and are lowering inventory levels substantially. Debt reduction is a very high priority now.
- The Chinese tariffs remain the wildcard, as it has started to take its toll on the electronics industry in which we are heavily involved. This tariff issue really needs to get settled.
- As with all things oilfield, it’s either full tilt or dead in the water. There is no in between. Right now, it has suddenly gone full tilt. However, there is no skilled labor to be had. We could triple our sales with two or three skilled people. I wish our country had a smart immigration policy of bringing in those with talent and skills.
Computer and Electronic Product Manufacturing
- We continue to work through what appears to be a cyclical industry correction. The trade tension impact is unclear but certainly not helpful.
- The tariffs on goods from China could have a major impact; however, we have been watching this for a while, so at this point, it has not changed our outlook. If tariffs on all actually go into place, then we may have to change our outlook.
Electrical Equipment, Appliance and Component Manufacturing
- Things are good. Margins this year are squeezed a little by competition.
Transportation Equipment Manufacturing
- January through June will show a 25 percent increase over 2018.
- We saw a reduction in order volume compared with our forecast earlier this year and revised our 2019 forecast down to accommodate that. Since our downward revision, orders and activity have been flat, in line with our revised forecast.
Food Manufacturing
- We are experiencing disruptions in our supply chain, some off them reportedly caused by tariffs on Chinese raw materials that have cascaded the disruption into materials we buy to manufacture some of our products (e.g., food grade pigments). Also, we just experienced a lot of uncertainty on incoming goods from Mexico because of the threatened tariffs. We are still trying to normalize our supply chain, but there is a lot of uncertainty from Mexican suppliers. At this point, uncertainty has reached a point where capital expenditures projects are being delayed or placed on hold.
- Trade uncertainty is creating softness in our markets.
Textile Product Mills
- There’s lots of big business in the pipeline; we’re just slow on orders for this month.
Apparel Manufacturing
- Military apparel orders appear to be strong for the next 12 months.
Paper Manufacturing
- We are still stuck in a slow environment.
Printing and Related Support Activities
- We cannot explain it, but we have gotten stupid slow, with incoming orders lagging way behind last year to date. At this rate, this will be the lowest year in over 15 years. All of our customers are complaining about being slow. Perhaps the economy is not in as good a condition—with all the uncertainty coming from Washington, D.C., people are afraid to pull the trigger on projects. Then adding on to our issues, San Antonio is about to implement mandatory paid sick time for hourly workers, adding even more pressure on profits, as we predict there will be widespread abuses of this. Most likely, this will result in a reduction in the workforce to cover the cost.
Miscellaneous Manufacturing
- We need all the Democrats and all the Republicans to get on board with efforts to improve trading agreements and open foreign markets to U.S. business. Foreign governments won’t cooperate if we are divided and they think political change will allow them to keep taking advantage of our country’s historically bad trade deals. This political gridlock is hurting American business interests, and the tariffs and fear of increasing tariffs are not good. It is time we get fair trade, and we need everybody working together for the good of the country.
- Threats of new tariffs on trade with Mexico are causing uncertainty. Several large-volume customers have assembly plants on the border with the U.S. Business volume is down across all industries we serve, particularly OEM [original equipment manufacturers] automotive.
Historical Data
Historical data can be downloaded dating back to June 2004.
Indexes
Download indexes for all indicators. For the definitions of all variables, see Data Definitions.
| Unadjusted |
| Seasonally adjusted |
All Data
Download indexes and components of the indexes (percentage of respondents reporting increase, decrease, or no change). For the definitions of all variables, see Data Definitions.
| Unadjusted |
| Seasonally adjusted |
Questions regarding the Texas Manufacturing Outlook Survey can be addressed to Emily Kerr at emily.kerr@dal.frb.org.
Sign up for our email alert to be automatically notified as soon as the latest Texas Manufacturing Outlook Survey is released on the web.