Texas Manufacturing Outlook Survey

October 28, 2019
Pace of Texas Manufacturing Expansion Slows, but Outlook Improves
What’s New This Month
For this month’s survey, Texas business executives were asked supplemental questions on borrowing conditions and credit availability. Results for these questions from the Texas Manufacturing Outlook Survey, Texas Service Sector Outlook Survey and Texas Retail Outlook Survey have been released together. Read the special questions results.
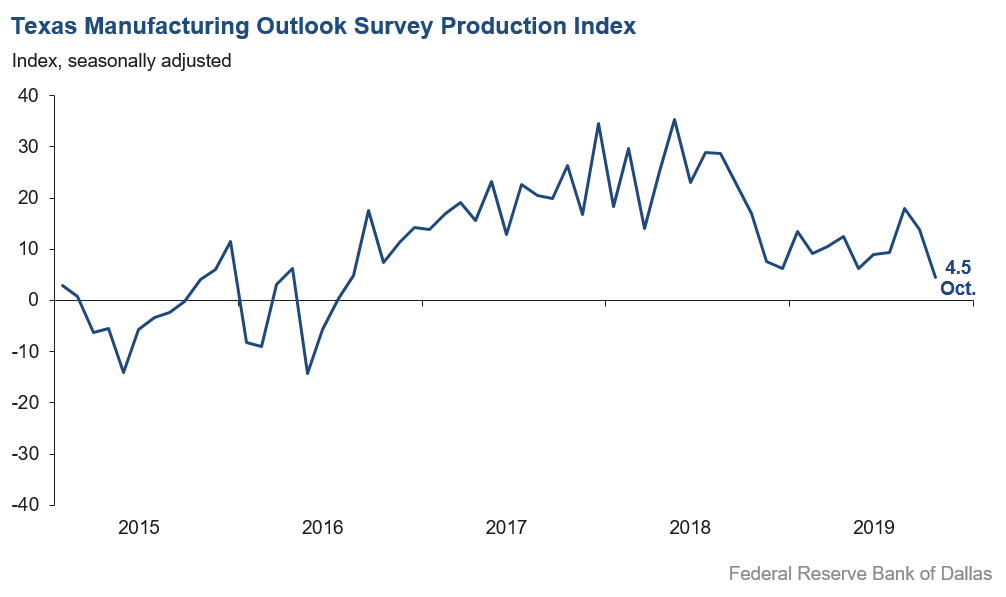
Texas factory activity continued to expand in October, albeit at a markedly slower pace, according to business executives responding to the Texas Manufacturing Outlook Survey. The production index, a key measure of state manufacturing conditions, fell nine points to 4.5, suggesting a moderation in output growth in October.
Other measures of manufacturing activity also suggested slower expansion in October, and demand declined. The new orders index turned negative for the first time in three years, falling 11 points to -4.2. The growth rate of orders index also fell into negative territory, coming in at -5.9. The capacity utilization index retreated from 12.0 to 3.6, reaching a three-year low. The shipments index fell nine points to 6.0.
Perceptions of broader business conditions were mixed in October. The general business activity index fell from 1.5 to -5.1, returning to negative territory after two months of positive readings. The company outlook index continued to increase, inching up to 8.8 this month. The index measuring uncertainty regarding companies’ outlooks remained slightly elevated at 12.1.
Labor market measures suggested slower growth in employment and work hours this month. The employment index remained positive but retreated from 18.8 to 11.0, a reading still above average. Twenty percent of firms noted net hiring, while 9 percent noted net layoffs. The hours worked index edged down to 4.7.
Price and wage pressures rose in October. The raw materials prices index ticked up to 22.8, a 10-month high. The finished goods prices index pushed up to 4.8 after oscillating around zero for five months. The wages and benefits index moved up five points to 22.2.
Expectations regarding future business conditions were more optimistic in October. The index of future general business activity returned to positive territory, rising nine points to 2.4. The index of future company outlook rose 13 points to 15.3, its highest level in six months. Other indexes for future manufacturing activity also rose, pushing further into positive territory.
Next release: Monday, November 25
|
Data were collected Oct. 15–23, and 110 Texas manufacturers responded to the survey. The Dallas Fed conducts the Texas Manufacturing Outlook Survey monthly to obtain a timely assessment of the state’s factory activity. Firms are asked whether output, employment, orders, prices and other indicators increased, decreased or remained unchanged over the previous month. Survey responses are used to calculate an index for each indicator. Each index is calculated by subtracting the percentage of respondents reporting a decrease from the percentage reporting an increase. When the share of firms reporting an increase exceeds the share reporting a decrease, the index will be greater than zero, suggesting the indicator has increased over the prior month. If the share of firms reporting a decrease exceeds the share reporting an increase, the index will be below zero, suggesting the indicator has decreased over the prior month. An index will be zero when the number of firms reporting an increase is equal to the number of firms reporting a decrease. Data have been seasonally adjusted as necessary. |
October 28, 2019
Results Summary
Historical data are available from June 2004 to the most current release month.
| Business Indicators Relating to Facilities and Products in Texas Current (versus previous month) |
||||||||
| Indicator | Oct Index | Sep Index | Change | Series Average |
Trend* | % Reporting Increase | % Reporting No Change | % Reporting Decrease |
|
Production |
4.5 |
13.9 |
–9.4 |
10.6 |
40(+) |
25.1 |
54.3 |
20.6 |
|
Capacity Utilization |
3.6 |
12.0 |
–8.4 |
8.2 |
40(+) |
20.3 |
63.0 |
16.7 |
|
New Orders |
–4.2 |
7.1 |
–11.3 |
6.5 |
1(–) |
22.0 |
51.8 |
26.2 |
|
Growth Rate of Orders |
–5.9 |
4.4 |
–10.3 |
0.1 |
1(–) |
16.1 |
61.9 |
22.0 |
|
Unfilled Orders |
–9.4 |
–2.0 |
–7.4 |
–2.8 |
4(–) |
6.5 |
77.6 |
15.9 |
|
Shipments |
6.0 |
14.7 |
–8.7 |
9.3 |
35(+) |
27.1 |
51.8 |
21.1 |
|
Delivery Time |
–4.2 |
2.3 |
–6.5 |
–0.5 |
1(–) |
7.3 |
81.2 |
11.5 |
|
Finished Goods Inventories |
–4.5 |
–6.2 |
+1.7 |
–3.0 |
7(–) |
13.8 |
67.9 |
18.3 |
|
Prices Paid for Raw Materials |
22.8 |
20.3 |
+2.5 |
24.8 |
43(+) |
29.5 |
63.8 |
6.7 |
|
Prices Received for Finished Goods |
4.8 |
1.0 |
+3.8 |
6.5 |
2(+) |
13.4 |
78.0 |
8.6 |
|
Wages and Benefits |
22.2 |
17.4 |
+4.8 |
18.8 |
123(+) |
22.8 |
76.6 |
0.6 |
|
Employment |
11.0 |
18.8 |
–7.8 |
6.6 |
34(+) |
20.3 |
70.4 |
9.3 |
|
Hours Worked |
4.7 |
5.7 |
–1.0 |
2.8 |
36(+) |
15.3 |
74.1 |
10.6 |
|
Capital Expenditures |
13.6 |
11.1 |
+2.5 |
7.0 |
38(+) |
22.9 |
67.8 |
9.3 |
| General Business Conditions Current (versus previous month) |
||||||||
| Indicator | Oct Index | Sep Index | Change | Series Average |
Trend** | % Reporting Improved | % Reporting No Change | % Reporting Worsened |
|
Company Outlook |
8.8 |
7.4 |
+1.4 |
7.3 |
3(+) |
21.2 |
66.4 |
12.4 |
|
General Business Activity |
–5.1 |
1.5 |
–6.6 |
3.0 |
1(–) |
13.0 |
68.9 |
18.1 |
| |
||||||||
| Indicator | Oct Index | Sep Index | Change | Series Average |
Trend* | % Reporting Increase | % Reporting No Change | % Reporting Decrease |
|
Outlook Uncertainty† |
12.1 |
13.3 |
–1.2 |
9.5 |
17(+) |
24.1 |
63.9 |
12.0 |
| Business Indicators Relating to Facilities and Products in Texas Future (six months ahead) |
||||||||
| Indicator | Oct Index | Sep Index | Change | Series Average |
Trend* | % Reporting Increase | % Reporting No Change | % Reporting Decrease |
|
Production |
29.6 |
25.4 |
+4.2 |
38.8 |
128(+) |
44.0 |
41.7 |
14.4 |
|
Capacity Utilization |
26.8 |
20.7 |
+6.1 |
35.5 |
128(+) |
36.7 |
53.4 |
9.9 |
|
New Orders |
34.3 |
23.9 |
+10.4 |
36.6 |
128(+) |
44.1 |
46.1 |
9.8 |
|
Growth Rate of Orders |
26.1 |
18.8 |
+7.3 |
26.9 |
128(+) |
34.7 |
56.7 |
8.6 |
|
Unfilled Orders |
2.6 |
–6.2 |
+8.8 |
4.0 |
1(+) |
11.0 |
80.6 |
8.4 |
|
Shipments |
29.2 |
18.4 |
+10.8 |
37.6 |
128(+) |
42.0 |
45.2 |
12.8 |
|
Delivery Time |
2.5 |
–1.1 |
+3.6 |
–1.9 |
1(+) |
9.0 |
84.5 |
6.5 |
|
Finished Goods Inventories |
1.9 |
–8.6 |
+10.5 |
–0.5 |
1(+) |
15.8 |
70.3 |
13.9 |
|
Prices Paid for Raw Materials |
18.8 |
20.0 |
–1.2 |
34.0 |
127(+) |
30.7 |
57.4 |
11.9 |
|
Prices Received for Finished Goods |
7.8 |
11.5 |
–3.7 |
19.7 |
45(+) |
18.6 |
70.6 |
10.8 |
|
Wages and Benefits |
39.0 |
35.6 |
+3.4 |
38.3 |
185(+) |
39.1 |
60.8 |
0.1 |
|
Employment |
23.6 |
15.9 |
+7.7 |
22.3 |
83(+) |
33.7 |
56.2 |
10.1 |
|
Hours Worked |
1.9 |
0.7 |
+1.2 |
9.4 |
41(+) |
10.6 |
80.7 |
8.7 |
|
Capital Expenditures |
22.9 |
23.3 |
–0.4 |
20.2 |
119(+) |
32.8 |
57.3 |
9.9 |
| General Business Conditions Future (six months ahead) |
||||||||
| Indicator | Oct Index | Sep Index | Change | Series Average |
Trend** | % Reporting Increase | % Reporting No Change | % Reporting Worsened |
|
Company Outlook |
15.3 |
2.4 |
+12.9 |
21.1 |
45(+) |
28.0 |
59.3 |
12.7 |
|
General Business Activity |
2.4 |
–6.8 |
+9.2 |
14.6 |
1(+) |
20.0 |
62.4 |
17.6 |
*Shown is the number of consecutive months of expansion or contraction in the underlying indicator. Expansion is indicated by a positive index reading and denoted by a (+) in the table. Contraction is indicated by a negative index reading and denoted by a (–) in the table.
**Shown is the number of consecutive months of improvement or worsening in the underlying indicator. Improvement is indicated by a positive index reading and denoted by a (+) in the table. Worsening is indicated by a negative index reading and denoted by a (–) in the table.
†Added to survey in January 2019.
Data have been seasonally adjusted as necessary, with the exception of the outlook uncertainty index, which does not yet have a sufficiently long time series to test for seasonality.
October 28, 2019
Production Index
October 28, 2019
Comments from Survey Respondents
These comments are from respondents’ completed surveys and have been edited for publication.
Chemical Manufacturing
- Decreased car sales have decreased our customers’ sales.
Primary Metal Manufacturing
- We are experiencing an uncharacteristic slowdown for October.
- The biggest issue is cybersecurity. It is very expensive to guard against. We know an attack will come, but not where, how, from what country, or when. The federal government should supply some assistance. Two cities around us have been attacked, and a current list of 30 Texas cities and agencies has been hit. This could get bad enough to be a drag on growth.
- We are experiencing an overall softening in the primary metals market/manufacturing. These trends have been building over the past six months and began with the energy sector. Now we are seeing softening across the board as election jitters and uncertainty take hold. One of the most crippling events for our workforce included an I-9 audit which identified 23 out of 255 employees whose documentation had mismatches. This resulted in over 480 years of experience being forced out. Although we have been a strict E-Verify employer, these individuals predated the system. Now we simply cannot fill these job openings, regardless of pay and benefits.
Fabricated Metal Product Manufacturing
- If the media continue to report the decline in business conditions, which we are not seeing, then maybe it will come true. Hiring good people is still a problem because everyone is working.
Nonmetallic Mineral Product Manufacturing
- There is a lot of uncertainty that is causing us to delay capital expenditures. Raw materials costs are uncertain due to unknown duties impacts. Planning is difficult and getting more uncertain. There is a lot of uncertainty in the homebuilding business, which directly affects us.
Machinery Manufacturing
- Business seems to be slowing back down after a fairly busy summer.
- The oil industry is slowly slowing down. I believe it has a great deal to do with the political environment that we now find ourselves in. The uncertainty has driven the customers to put their hands in their pockets to see what might develop with the elections next year. If this continues, it will be a long, cold winter and even slower summer until this is over. And if the Democratic candidate wins, then the next four years will be very tough for my business. I’d seriously consider retirement.
- Give me a level playing field and a free market and we can beat even low–labor-cost suppliers. I don’t want a subsidy and I can’t beat a tariff.
- I don’t see the economy booming.
- Sales were down; however, it was mostly due to the end of a multiyear project that ended in August. We are now making efforts to replace this business.
Computer and Electronic Product Manufacturing
- Trade deals are actually helping our customers and, therefore, helping us to book more revenue. Our backlog is pretty strong. There is a mild slowdown in a couple of sectors of our industries—nothing alarming.
- Tariffs remain a concern, but things seem to have stabilized.
- We have begun to see broad-based weakness as customers tell us they are becoming increasingly conservative due to trade tensions. Our revenues in the fourth quarter are expected to decline about what they did in fourth quarter 2008. This is the first time we have seen this magnitude of weakness since then.
Transportation Equipment Manufacturing
- Our industry has been down for year, and the outlook remains soft through 2021. We are expanding our distribution network to offset the overall downturn.
Paper Manufacturing
- Current conditions are the same as they have been for eight months, which is very soft with no positive outlook at this time. If this level continues (as expected), we will be reducing our workforce after Christmas.
Printing and Related Support Activities
- The continued shortage of semi-skilled and skilled labor is a major problem impacting growth.
- We had a very robust incoming-order month in September and now are feeling the effects. There is a lot of work in here, but this is somewhat normal for this time of year. I am very worried about how the next three to nine months will be, from a slowdown in the graphic arts industry, to our goofy city council trying to mandate paid sick time for hourly workers, to increases in taxes and fees. This all makes for a lot of uncertainty moving forward. We are looking at cutting back on bodies in the office to reduce overhead, and we are keeping a firm touch on expenditures.
Miscellaneous Manufacturing
- The China tariff situation on 23 percent of our business is a big hurt, as our Chinese supplier will give only small relief and our U.S. customers refuse an upcharge.
Historical Data
Historical data can be downloaded dating back to June 2004.
Indexes
Download indexes for all indicators. For the definitions of all variables, see Data Definitions.
| Unadjusted |
| Seasonally adjusted |
All Data
Download indexes and components of the indexes (percentage of respondents reporting increase, decrease, or no change). For the definitions of all variables, see Data Definitions.
| Unadjusted |
| Seasonally adjusted |
Questions regarding the Texas Manufacturing Outlook Survey can be addressed to Emily Kerr at emily.kerr@dal.frb.org.
Sign up for our email alert to be automatically notified as soon as the latest Texas Manufacturing Outlook Survey is released on the web.