Texas Manufacturing Outlook Survey

Texas Manufacturing Growth Abates, Outlooks Worsen
For this month’s survey, Texas business executives were asked supplemental questions on wages, prices and revenue restraints. Results for these questions from the Texas Manufacturing Outlook Survey, Texas Service Sector Outlook Survey and Texas Retail Outlook Survey have been released together. Read the special questions results.
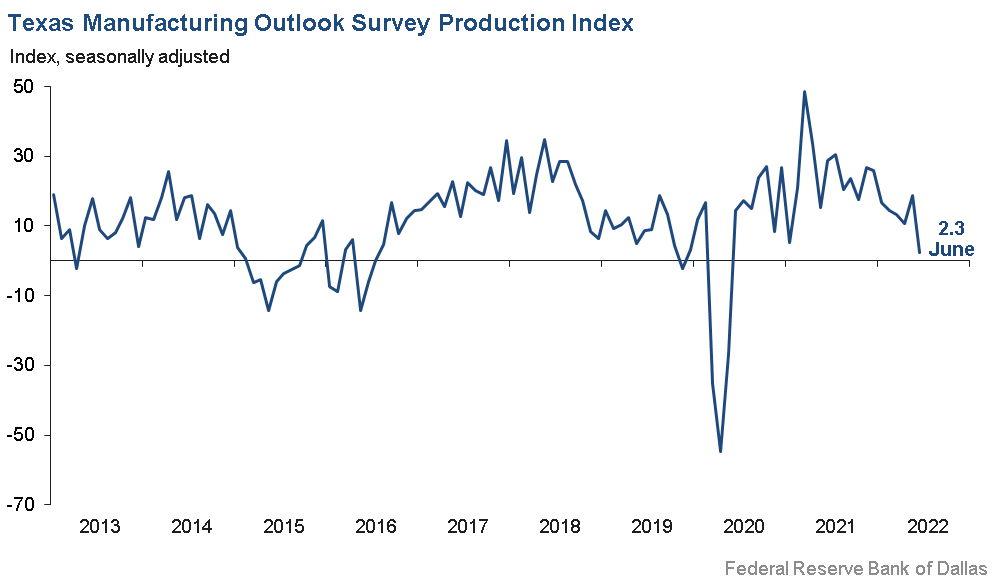
Growth in Texas factory activity decelerated sharply in June, according to business executives responding to the Texas Manufacturing Outlook Survey. The production index, a key measure of state manufacturing conditions, fell from 18.8 to 2.3, reaching its lowest reading since May 2020.
Other measures of manufacturing activity also moved down notably this month. The new orders indexed dipped into negative territory for the first time in two years, falling from 3.2 to -7.3 and signaling a decline in demand. The growth rate of orders index pushed further negative, from -5.3 to -16.2. The capacity utilization and shipments indexes remained positive but fell markedly to 3.3 and 1.2, respectively.
Perceptions of broader business conditions worsened again in June. The general business activity index declined 10 points to -17.7. The company outlook index also fell 10 points, from -10.0 to -20.2. Both indexes reached lows last seen in May 2020. The outlook uncertainty index shot up to 43.7, a 17-point jump from May.
Labor market measures continued to indicate robust employment growth and longer workweeks. The employment index moved down six points to 15.2 but remained well above its series average of 7.7. Twenty-four percent of firms noted net hiring, while 9 percent noted net layoffs. The hours worked index pushed up further, from 7.4 to 11.8.
Prices and wages continued to increase strongly. The raw materials prices index edged down to 57.5, a reading still more than twice its average of 28.0. The finished goods prices index also moved down, from 41.8 to 33.8, but remained highly elevated. The wages and benefits index came in at 49.9, unchanged from May and markedly higher than its 20.4 average.
Expectations regarding future manufacturing were notably less optimistic than in May. The future production index remained only slightly positive, retreating from 19.9 to 4.0. The future general business activity index pushed further into negative territory, falling 20 points to -26.0. Other measures of future manufacturing activity also declined, though most remained positive.
Next release: Monday, July 25
|
Data were collected June 14–22, and 90 Texas manufacturers responded to the survey. The Dallas Fed conducts the Texas Manufacturing Outlook Survey monthly to obtain a timely assessment of the state’s factory activity. Firms are asked whether output, employment, orders, prices and other indicators increased, decreased or remained unchanged over the previous month. Survey responses are used to calculate an index for each indicator. Each index is calculated by subtracting the percentage of respondents reporting a decrease from the percentage reporting an increase. When the share of firms reporting an increase exceeds the share reporting a decrease, the index will be greater than zero, suggesting the indicator has increased over the prior month. If the share of firms reporting a decrease exceeds the share reporting an increase, the index will be below zero, suggesting the indicator has decreased over the prior month. An index will be zero when the number of firms reporting an increase is equal to the number of firms reporting a decrease. Data have been seasonally adjusted as necessary. |
Results Summary
Historical data are available from June 2004 to the most current release month.
| Business Indicators Relating to Facilities and Products in Texas Current (versus previous month) | ||||||||
| Indicator | Jun Index | May Index | Change | Series Average | Trend* | % Reporting Increase | % Reporting No Change | % Reporting Decrease |
Production | 2.3 | 18.8 | –16.5 | 10.9 | 25(+) | 25.8 | 50.7 | 23.5 |
Capacity Utilization | 3.3 | 19.8 | –16.5 | 8.8 | 25(+) | 21.8 | 59.7 | 18.5 |
New Orders | –7.3 | 3.2 | –10.5 | 6.9 | 1(–) | 23.1 | 46.5 | 30.4 |
Growth Rate of Orders | –16.2 | –5.3 | –10.9 | 0.8 | 2(–) | 14.0 | 55.8 | 30.2 |
Unfilled Orders | –8.8 | 4.1 | –12.9 | –1.4 | 1(–) | 14.8 | 61.6 | 23.6 |
Shipments | 1.2 | 13.1 | –11.9 | 9.7 | 25(+) | 23.0 | 55.2 | 21.8 |
Delivery Time | 19.9 | 4.3 | +15.6 | 1.4 | 24(+) | 26.6 | 66.7 | 6.7 |
Finished Goods Inventories | 11.2 | 9.2 | +2.0 | –3.3 | 2(+) | 25.8 | 59.6 | 14.6 |
Prices Paid for Raw Materials | 57.5 | 61.8 | –4.3 | 28.0 | 26(+) | 66.6 | 24.3 | 9.1 |
Prices Received for Finished Goods | 33.8 | 41.8 | –8.0 | 8.7 | 23(+) | 38.7 | 56.4 | 4.9 |
Wages and Benefits | 49.9 | 50.5 | –0.6 | 20.4 | 26(+) | 49.9 | 50.1 | 0.0 |
Employment | 15.2 | 20.9 | –5.7 | 7.7 | 24(+) | 23.9 | 67.4 | 8.7 |
Hours Worked | 11.8 | 7.4 | +4.4 | 3.7 | 24(+) | 20.9 | 70.0 | 9.1 |
Capital Expenditures | 5.1 | 9.2 | –4.1 | 6.9 | 23(+) | 22.6 | 59.9 | 17.5 |
| General Business Conditions Current (versus previous month) | ||||||||
| Indicator | Jun Index | May Index | Change | Series Average | Trend** | % Reporting Improved | % Reporting No Change | % Reporting Worsened |
Company Outlook | –20.2 | –10.0 | –10.2 | 6.6 | 4(–) | 11.6 | 56.6 | 31.8 |
General Business Activity | –17.7 | –7.3 | –10.4 | 3.0 | 2(–) | 15.4 | 51.5 | 33.1 |
| Indicator | Jun Index | May Index | Change | Series Average | Trend* | % Reporting Increase | % Reporting No Change | % Reporting Decrease |
Outlook Uncertainty† | 43.7 | 26.5 | +17.2 | 15.5 | 14(+) | 49.4 | 44.8 | 5.7 |
| Business Indicators Relating to Facilities and Products in Texas Future (six months ahead) | ||||||||
| Indicator | Jun Index | May Index | Change | Series Average | Trend* | % Reporting Increase | % Reporting No Change | % Reporting Decrease |
Production | 4.0 | 19.9 | –15.9 | 38.4 | 26(+) | 33.5 | 37.1 | 29.5 |
Capacity Utilization | 4.6 | 22.7 | –18.1 | 35.3 | 26(+) | 32.3 | 40.0 | 27.7 |
New Orders | 0.8 | 16.6 | –15.8 | 35.9 | 26(+) | 31.4 | 38.0 | 30.6 |
Growth Rate of Orders | –6.3 | 13.3 | –19.6 | 26.7 | 1(–) | 23.9 | 45.9 | 30.2 |
Unfilled Orders | –21.4 | 1.6 | –23.0 | 3.7 | 1(–) | 5.4 | 67.8 | 26.8 |
Shipments | 2.5 | 20.3 | –17.8 | 36.8 | 26(+) | 32.8 | 36.8 | 30.3 |
Delivery Time | –17.7 | 1.8 | –19.5 | –1.2 | 1(–) | 11.3 | 59.7 | 29.0 |
Finished Goods Inventories | –8.5 | –1.2 | –7.3 | 0.5 | 2(–) | 15.9 | 59.8 | 24.4 |
Prices Paid for Raw Materials | 33.0 | 47.5 | –14.5 | 34.8 | 27(+) | 47.6 | 37.8 | 14.6 |
Prices Received for Finished Goods | 33.3 | 38.6 | –5.3 | 21.2 | 26(+) | 44.4 | 44.4 | 11.1 |
Wages and Benefits | 60.3 | 62.5 | –2.2 | 39.2 | 26(+) | 61.6 | 37.1 | 1.3 |
Employment | 15.2 | 32.3 | –17.1 | 23.4 | 25(+) | 30.1 | 55.0 | 14.9 |
Hours Worked | 2.0 | 9.0 | –7.0 | 9.5 | 26(+) | 15.3 | 71.4 | 13.3 |
Capital Expenditures | 9.7 | 21.1 | –11.4 | 20.1 | 25(+) | 26.8 | 56.1 | 17.1 |
| General Business Conditions Future (six months ahead) | ||||||||
| Indicator | Jun Index | May Index | Change | Series Average | Trend** | % Reporting Increase | % Reporting No Change | % Reporting Worsened |
Company Outlook | –23.5 | –4.9 | –18.6 | 20.2 | 2(–) | 13.8 | 48.9 | 37.3 |
General Business Activity | –26.0 | –6.5 | –19.5 | 14.5 | 2(–) | 15.3 | 43.3 | 41.3 |
*Shown is the number of consecutive months of expansion or contraction in the underlying indicator. Expansion is indicated by a positive index reading and denoted by a (+) in the table. Contraction is indicated by a negative index reading and denoted by a (–) in the table.
**Shown is the number of consecutive months of improvement or worsening in the underlying indicator. Improvement is indicated by a positive index reading and denoted by a (+) in the table. Worsening is indicated by a negative index reading and denoted by a (–) in the table.
†Added to survey in January 2018.
Data have been seasonally adjusted as necessary, with the exception of the outlook uncertainty index, which does not yet have a sufficiently long time series to test for seasonality.
Production Index
Comments from Survey Respondents
These comments are from respondents’ completed surveys and have been edited for publication.
- Business continues to be strong both in terms of sales and margins. There is uncertainty around the 6–12-month outlook.
- Inflation on raw materials, especially steel and gasoline and diesel fuel, continues to damage gross margin. Because our contracts are longer term and fixed price, we have no way to pass this on to our existing contracts.
- Inflation is continuing on anything that relates to oil and gas prices; i.e., almost everything we buy.
- Everything we buy and sell comes and goes by truck, if we can get a truck at any price. Inflation will continue until the country is self-sufficient in oil and gas. The current political policy may not change until 2024. Therefore, inflation will be our consistent companion for a while, then stagflation!
- There is increased concern over Mexican manufacturers gaining more business in the U.S. due to not having the Section 232 tariffs.
- We are still seeing delays with owners/contractors starting new projects.
- We see the environment for the oil industry becoming even worse than the previous months. Biden is promoting a very caustic attitude toward the oil industry, which doesn’t help the country in any way.
- We are seeing a contraction in business activity.
- We’ll all be lucky to have a job with two more years of this disaster.
- The supply chain is a nightmare, while prices are increasing. It’s difficult to find employees, and the ones we can find are expecting more pay.
- We are starting to see things cooling across all markets except auto. The first area was handset/personal computers, and it’s now spreading to other markets. I would not say things have rolled over, but expedites have stopped, and in-quarter orders have slowed to a trickle. There are clear signs of early cooling beginning. Auto continues to be strong, even though there are definite signs of significant component build within their supply chain.
- As a country, we are not looking at the future and establishing relationships with emerging countries like we should to ease the dependency on Chinese products and services. This will hurt us in the long run.
- Our business is changing at the same time as the economy is changing. We are transitioning from system sales into recurring revenue sales and becoming less reliant on hardware sales. Overall, the recession will have an impact, and the inflation is going to cause us to increase employee wages, which we will have to offset with some employee layoffs.
- Overall uncertainty has not changed; we remain uncertain of the reliability of the supply chain and the length of changing lead times. However, uncertainty has increased related to specific supply chains for integrated circuits. Similarly, price increases across all components have continued to provide instability and uncertainty related to long-term product viability.
- Our manufacturing facility is continuing to see unsustainable increases and lead times for raw materials. Skilled labor is a rarity to find. We have increased our starting pay by 40 percent, which puts us above our nearest competitors, and we offer competitive benefits, yet we still cannot attract the personnel needed.
- You can’t ignore the economic fundamentals leading to a likely recession, and the administration [in Washington] is either stubborn or as paralyzed as a deer in headlights. The Federal Reserve is slow to react and will have to hit the brakes harder than they should have had to do.
- As you can see, we are already into a bit of stagflation. There is demand for our product, yet limited funding for it.
- As a manufacturer of a wide range of products from home goods to medical goods to automotive goods, we have seen a sharp decrease in demand across all sectors. Raw material vendors’ cost increases happen weekly and at a rate that is difficult for us to even update our bill of materials and pass on the price increase to our customers. The timing gap in those pricing updates, given that raw material price increases are being given by our vendors with immediate implementation, is causing us to have month-over-month losses. How the Federal Reserve justifies interest rate increases, when all signs show we are heading for a recession, is beyond my comprehension.
- We have seen a decrease in sales, both with wholesale and retail channels. Meanwhile, the cost of goods continues to increase.
- We are very concerned about inflation and its effects on stocks, bonds and interest rates. It looks like a recession is on its way. The future does not look good for housing. We are expecting a major slowdown due to material cost, labor cost and mortgage rates.
- Orders are trending down, and with the Federal Reserve continuing to tighten, we think the six-month outlook for a recession is strong. Current orders and projections back this up.
- The price of fuel is driving up all the costs for supplies and distribution. Also, since we do mail production, the cost increase on postage is causing our customers to trim their volumes.
- Orders have slowed slightly. Inflation fears are worse than the inflation. There are slight signs of a slowdown—not conclusive.
- We have noticed a definite slowdown in new orders. The last two weeks have been very slow for incoming orders. We’re not sure if fuel, inflation or summer vacation is the cause of it.
- Supplies of raw materials are becoming slightly easier to get, with prices moderating because metal commodity markets are moderating. In the last 30 days, it has been slightly easier to hire employees. Business levels/volumes are decreasing. The number of hours worked by employees has been decreased to 40—no additional shifts needed. Please do not raise interest rates again to see how a 0.75 percent increase affects the economy. It seems illogical to me to that the only way to stop runaway inflation is to initiate a recession through monetary policy.
- Government overspending and transfer programs have inflated the money supply while resulting in unchecked corruption and waste. We will be paying that bill for generations, and what a colossal waste of resources and missed opportunity.
Historical Data
Historical data can be downloaded dating back to June 2004.
Indexes
Download indexes for all indicators. For the definitions of all variables, see Data Definitions.
| Unadjusted |
| Seasonally adjusted |
All Data
Download indexes and components of the indexes (percentage of respondents reporting increase, decrease, or no change). For the definitions of all variables, see Data Definitions.
| Unadjusted |
| Seasonally adjusted |
Questions regarding the Texas Manufacturing Outlook Survey can be addressed to Emily Kerr at emily.kerr@dal.frb.org.
Sign up for our email alert to be automatically notified as soon as the latest Texas Manufacturing Outlook Survey is released on the web.