Texas Manufacturing Outlook Survey

Texas manufacturing sector continues to experience some weakness
For this month’s survey, Texas business executives were asked supplemental questions on expected demand, employment and impacts from recent storms. Results for these questions from the Texas Manufacturing Outlook Survey, Texas Service Sector Outlook Survey and Texas Retail Outlook Survey have been released together. Read the special questions results.
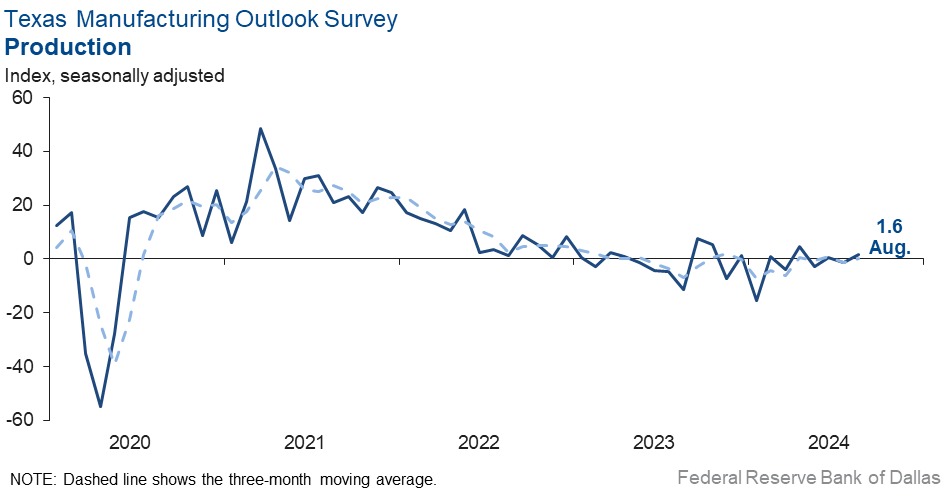
Texas factory activity exhibited little growth in August, according to business executives responding to the Texas Manufacturing Outlook Survey. The production index, a key measure of state manufacturing conditions, inched up three points to 1.6, with the low reading signaling only slight growth in output from July.
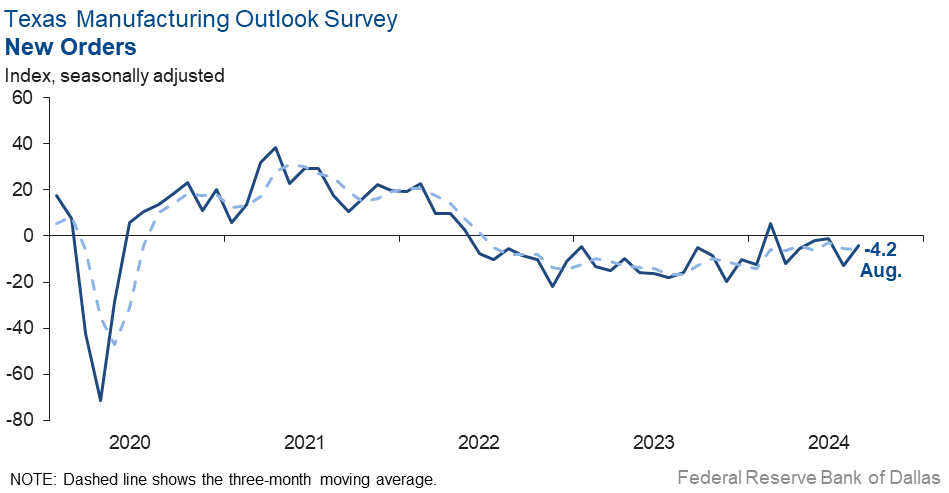
Most other measures of manufacturing activity continued to indicate declines this month, though they were less negative than in July. The new orders index climbed nine points to -4.2, and the capacity utilization index pushed up eight points to -2.5. The shipments index came in near zero, rebounding from -16.3 last month.
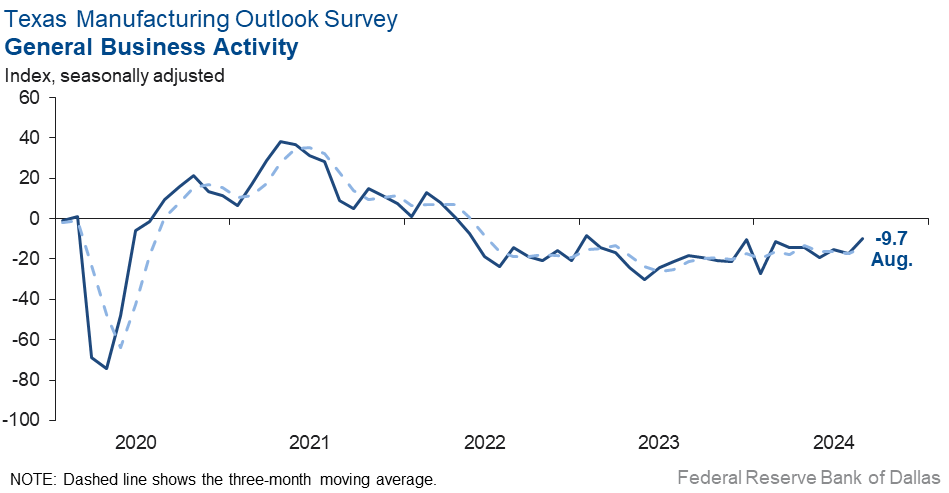
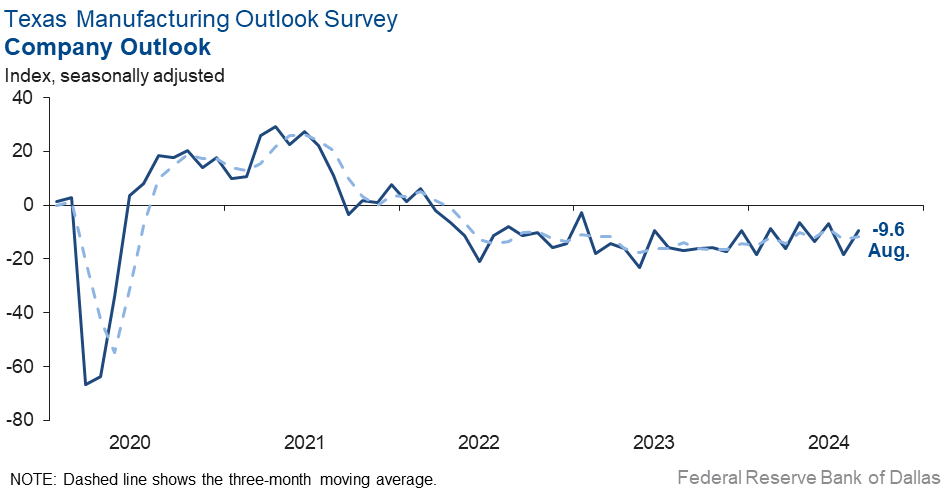
Perceptions of broader business conditions remained negative but were less pessimistic in August. The general business activity index rose eight points to -9.7, and the company outlook index rose nine points to -9.6. The outlook uncertainty index fell notably after spiking last month, retreating 23 points to 7.5.
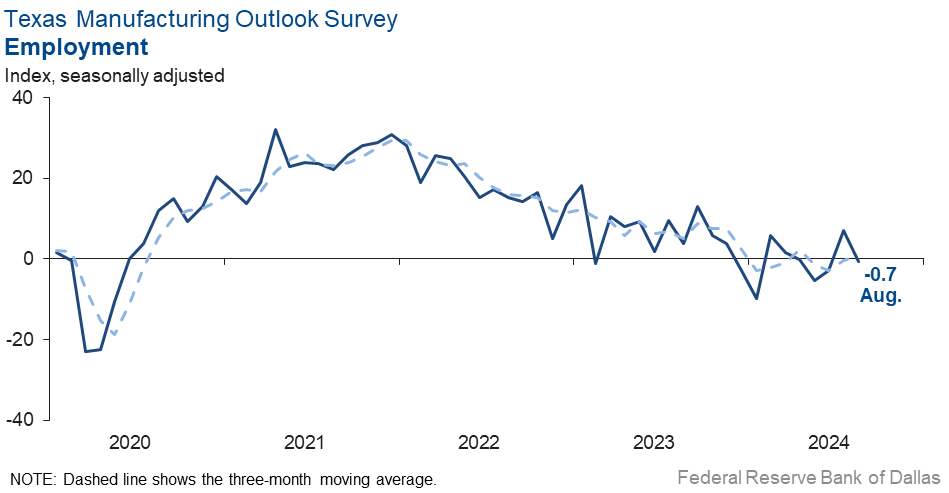
Labor market measures suggested flat employment and slightly shorter workweeks this month. The employment index slipped to -0.7, with the near-zero reading indicating no change in employment levels from July when the index spiked to a 10-month high. Sixteen percent of firms noted net hiring, while 17 percent noted net layoffs. The hours worked index remained negative but moved up to -2.6 from -13.8.
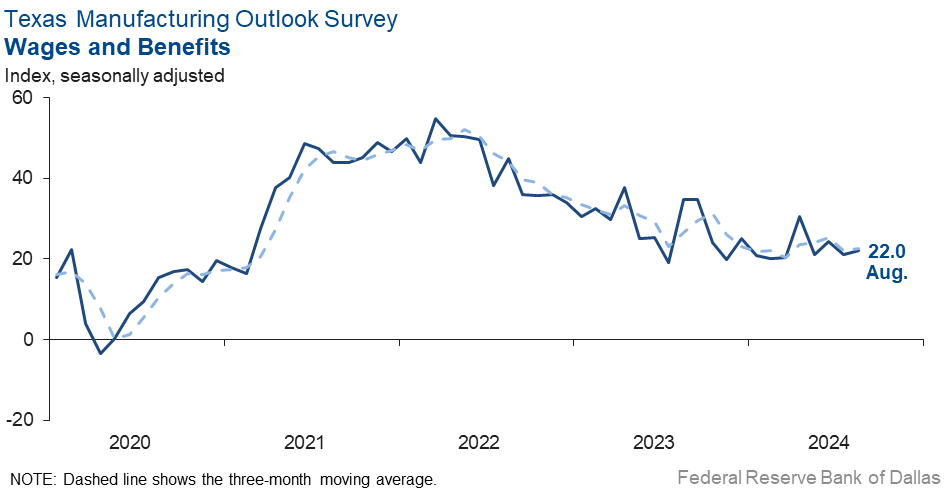
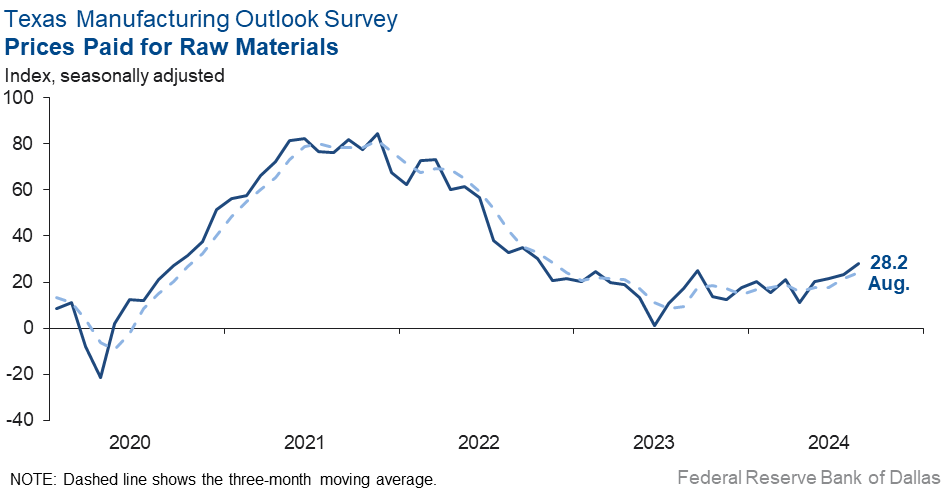
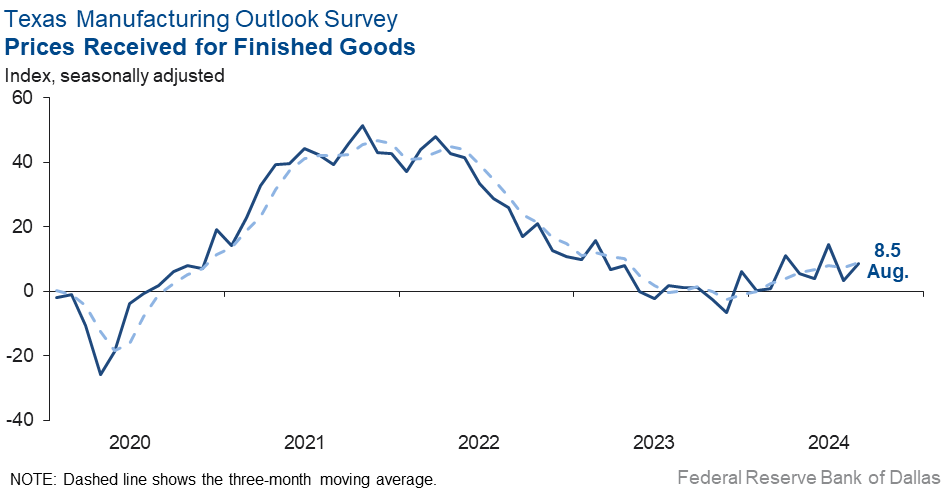
Moderate upward pressure on prices and wages continued in August. The wages and benefits index held steady at 22.0, a reading in line with the historical average. The raw materials prices and finished goods prices indexes both pushed up five points, coming in at 28.2 and 8.5, respectively.
Expectations regarding future manufacturing activity remained positive but showed mixed movements this month. The future production index inched up to 33.7, while the future general business activity retreated 10 points to 11.6.
Next release: Monday, September 30
Data were collected Aug. 13–21, and 83 of the 125 Texas manufacturers surveyed submitted a response. The Dallas Fed conducts the Texas Manufacturing Outlook Survey monthly to obtain a timely assessment of the state’s factory activity. Firms are asked whether output, employment, orders, prices and other indicators increased, decreased or remained unchanged over the previous month.
Survey responses are used to calculate an index for each indicator. Each index is calculated by subtracting the percentage of respondents reporting a decrease from the percentage reporting an increase. When the share of firms reporting an increase exceeds the share reporting a decrease, the index will be greater than zero, suggesting the indicator has increased over the prior month. If the share of firms reporting a decrease exceeds the share reporting an increase, the index will be below zero, suggesting the indicator has decreased over the prior month. An index will be zero when the number of firms reporting an increase is equal to the number of firms reporting a decrease. Data have been seasonally adjusted as necessary.
Results summary
Historical data are available from June 2004 to the most current release month.
| Business Indicators Relating to Facilities and Products in Texas Current (versus previous month) | ||||||||
| Indicator | Aug Index | Jul Index | Change | Series Average | Trend* | % Reporting Increase | % Reporting No Change | % Reporting Decrease |
Production | 1.6 | –1.3 | +2.9 | 9.8 | 1(+) | 25.5 | 50.6 | 23.9 |
Capacity Utilization | –2.5 | –10.0 | +7.5 | 7.7 | 4(–) | 22.1 | 53.3 | 24.6 |
New Orders | –4.2 | –12.8 | +8.6 | 5.1 | 6(–) | 23.3 | 49.2 | 27.5 |
Growth Rate of Orders | –5.1 | –16.6 | +11.5 | –0.7 | 4(–) | 18.7 | 57.5 | 23.8 |
Unfilled Orders | 1.0 | –26.6 | +27.6 | –2.2 | 1(+) | 16.7 | 67.6 | 15.7 |
Shipments | 0.8 | –16.3 | +17.1 | 8.1 | 1(+) | 25.2 | 50.4 | 24.4 |
Delivery Time | –1.0 | –5.3 | +4.3 | 0.9 | 17(–) | 9.7 | 79.6 | 10.7 |
Finished Goods Inventories | 6.1 | –5.0 | +11.1 | –3.1 | 1(+) | 22.0 | 62.2 | 15.9 |
Prices Paid for Raw Materials | 28.2 | 23.1 | +5.1 | 27.2 | 52(+) | 32.9 | 62.4 | 4.7 |
Prices Received for Finished Goods | 8.5 | 3.4 | +5.1 | 8.6 | 9(+) | 16.0 | 76.5 | 7.5 |
Wages and Benefits | 22.0 | 21.2 | +0.8 | 21.2 | 52(+) | 22.7 | 76.6 | 0.7 |
Employment | –0.7 | 7.1 | –7.8 | 7.5 | 1(–) | 15.8 | 67.7 | 16.5 |
Hours Worked | –2.6 | –13.8 | +11.2 | 3.2 | 11(–) | 10.9 | 75.6 | 13.5 |
Capital Expenditures | 15.7 | 0.8 | +14.9 | 6.6 | 11(+) | 25.9 | 63.9 | 10.2 |
| General Business Conditions Current (versus previous month) | ||||||||
| Indicator | Aug Index | Jul Index | Change | Series Average | Trend** | % Reporting Improved | % Reporting No Change | % Reporting Worsened |
Company Outlook | –9.6 | –18.4 | +8.8 | 4.4 | 30(–) | 14.8 | 60.8 | 24.4 |
General Business Activity | –9.7 | –17.5 | +7.8 | 0.7 | 28(–) | 16.5 | 57.3 | 26.2 |
| Indicator | Aug Index | Jul Index | Change | Series Average | Trend* | % Reporting Increase | % Reporting No Change | % Reporting Decrease |
Outlook Uncertainty | 7.5 | 30.7 | –23.2 | 17.1 | 40(+) | 22.5 | 62.5 | 15.0 |
| Business Indicators Relating to Facilities and Products in Texas Future (six months ahead) | ||||||||
| Indicator | Aug Index | Jul Index | Change | Series Average | Trend* | % Reporting Increase | % Reporting No Change | % Reporting Decrease |
Production | 33.7 | 32.0 | +1.7 | 36.2 | 52(+) | 41.1 | 51.5 | 7.4 |
Capacity Utilization | 32.9 | 21.4 | +11.5 | 33.1 | 52(+) | 39.0 | 54.9 | 6.1 |
New Orders | 30.7 | 30.3 | +0.4 | 33.6 | 22(+) | 39.2 | 52.3 | 8.5 |
Growth Rate of Orders | 17.7 | 19.3 | –1.6 | 24.8 | 15(+) | 25.2 | 67.3 | 7.5 |
Unfilled Orders | 7.0 | –2.6 | +9.6 | 2.8 | 1(+) | 12.1 | 82.8 | 5.1 |
Shipments | 30.1 | 29.1 | +1.0 | 34.7 | 52(+) | 37.4 | 55.3 | 7.3 |
Delivery Time | 4.5 | 4.6 | –0.1 | –1.4 | 2(+) | 10.6 | 83.3 | 6.1 |
Finished Goods Inventories | 3.9 | –6.9 | +10.8 | 0.0 | 1(+) | 15.4 | 73.1 | 11.5 |
Prices Paid for Raw Materials | 25.2 | 28.5 | –3.3 | 33.4 | 53(+) | 32.2 | 60.8 | 7.0 |
Prices Received for Finished Goods | 21.2 | 23.0 | –1.8 | 20.8 | 52(+) | 25.0 | 71.3 | 3.8 |
Wages and Benefits | 38.1 | 39.2 | –1.1 | 39.2 | 243(+) | 39.4 | 59.3 | 1.3 |
Employment | 22.0 | 18.7 | +3.3 | 22.8 | 51(+) | 28.0 | 66.0 | 6.0 |
Hours Worked | 9.2 | 8.8 | +0.4 | 8.8 | 5(+) | 13.8 | 81.6 | 4.6 |
Capital Expenditures | 20.0 | 22.4 | –2.4 | 19.4 | 51(+) | 27.8 | 64.4 | 7.8 |
| General Business Conditions Future (six months ahead) | ||||||||
| Indicator | Aug Index | Jul Index | Change | Series Average | Trend** | % Reporting Increase | % Reporting No Change | % Reporting Worsened |
Company Outlook | 18.5 | 22.0 | –3.5 | 18.3 | 9(+) | 26.5 | 65.5 | 8.0 |
General Business Activity | 11.6 | 21.6 | –10.0 | 12.2 | 3(+) | 27.3 | 57.0 | 15.7 |
*Shown is the number of consecutive months of expansion or contraction in the underlying indicator. Expansion is indicated by a positive index reading and denoted by a (+) in the table. Contraction is indicated by a negative index reading and denoted by a (–) in the table.
**Shown is the number of consecutive months of improvement or worsening in the underlying indicator. Improvement is indicated by a positive index reading and denoted by a (+) in the table. Worsening is indicated by a negative index reading and denoted by a (–) in the table.
Data have been seasonally adjusted as necessary.
Comments from survey respondents
These comments are from respondents’ completed surveys and have been edited for publication.
- Suppliers are demanding longer lead times. Some commodity prices have declined, but value-added items (packaging film) are seeing price increases. We’ll have an annual wage increase in October in the range of 3 to 8 percent. Wages for positions requiring physical work are increasing more than desk jobs.
- Agriculture is hurting. No farm bill, weather and falling prices for our commodities while input costs increase are putting a big squeeze on our industry.
- We are preparing for the recession.
- As the economy weakens, we are seeing modest growth in our category of dinner sausage. This category tends to grow when the economy weakens, as sausage is a good protein substitute for higher-priced proteins and can "stretch" consumers’ food budgets. Additionally, we are expanding our presence in other sales channels, such as food service, which we believe will help our sales in 2025.
- Uncertainty is high, and we are very unsure how the next quarter will go.
- Things are soft but steady.
- We have a new large-machinery line arriving at the end of September that will complement our current line that is getting long in the tooth. It's a huge investment for us, and I'm worried that with business activity slowing down, we may be in for some rough waters for a while. It should generate some healthy activity, and we know it will be much more efficient than our current line.
- Difficulties in ship travel to the Red Sea area have made it difficult to secure ships for bimonthly/quarterly shipments.
- Turbulence in the market, increased global instability and further concerns over U.S. political instability in the current administration have all fueled further weakening in the market.
- Heading into the holiday season with an election in the near future, our customers are beefing up supplies from China for the near term but hitting pause beyond that.
- Incoming orders continue their downward trend. Most of our customers are reporting few orders on their end, especially our building and construction customers, as well as the ones in the transportation segment (trailers). We continue to be negatively affected by foreign competition at much lower price offerings than we can meet.
- Our company is spending significant capital dollars to bring a new product line to our manufacturing operations. This will allow us to enter markets we currently do not service.
- The hurricane interruption caused us to miss two weeks of production.
- The slowdown is settling in with business activity at a very low level.
- Things are just plain bad all over. There is no skilled labor available.
- Our business usually has seasonal decreases in the summer months, but the decrease this summer is more significant than usual. We are now not so sure about the future.
- November cannot come soon enough! We've stagnated as has our competition along with our customer base. It's like we all know the world will continue regardless of who wins, but we're all sitting on our hands until a winner is announced.
- It appears the industry is approaching a cyclical bottom; we see signs of several markets beginning to correct. Regionally, China was strong, U.S. was OK, Europe was weak, and Japan was very weak.
- We are getting more resistance to higher prices from our customers. We are also seeing orders reduced or delayed from a few of the more price-sensitive ones. The biggest uncertainty is about the election; a lot of our customers are taking a "wait and see" approach. All small business owners that I talk to are very concerned about the high-tax, anti-growth and anti-small business policies that [we think] are certain to come from a [Kamala] Harris presidency.
- We are experiencing slower pay on accounts receivable. There is a continued shortage of skilled carpenters and saw operators. Project size has increased from general contractors. Inexperienced architects and construction project managers cause significant construction timeline delays.
- It is increasingly looking like the U.S. has lost its position of strength in geopolitics, and the vacuum is encouraging war and violence, which pose significant risk to international trade and reduce opportunities for U.S. companies. Anti-business, tax and spend rhetoric is not conducive for long-term investments and is going to further reduce U.S. business competitiveness especially against China’s government-supported industries and firms.
Historical Data
Historical data can be downloaded dating back to June 2004.
Indexes
Download indexes for all indicators. For the definitions of all variables, see Data Definitions.
| Unadjusted |
| Seasonally adjusted |
All Data
Download indexes and components of the indexes (percentage of respondents reporting increase, decrease, or no change). For the definitions of all variables, see Data Definitions.
| Unadjusted |
| Seasonally adjusted |
Questions regarding the Texas Business Outlook Surveys can be addressed to Emily Kerr at emily.kerr@dal.frb.org.
Sign up for our email alert to be automatically notified as soon as the latest Texas Manufacturing Outlook Survey is released on the web.