Texas Manufacturing Outlook Survey

Texas manufacturing activity holds steady in November, outlooks improve
For this month’s survey, Texas business executives were asked supplemental questions on expected demand and operating margins. Results for these questions from the Texas Manufacturing Outlook Survey, Texas Service Sector Outlook Survey and Texas Retail Outlook Survey have been released together. Read the special questions results.
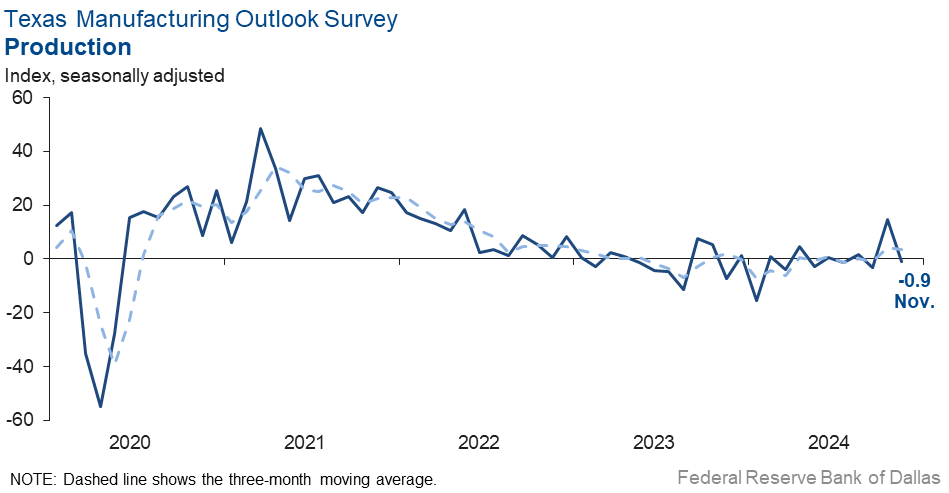
Texas factory activity was flat in November, according to business executives responding to the Texas Manufacturing Outlook Survey. The production index, a key measure of state manufacturing conditions, slipped to a near-zero reading after rising to 14.6 last month.
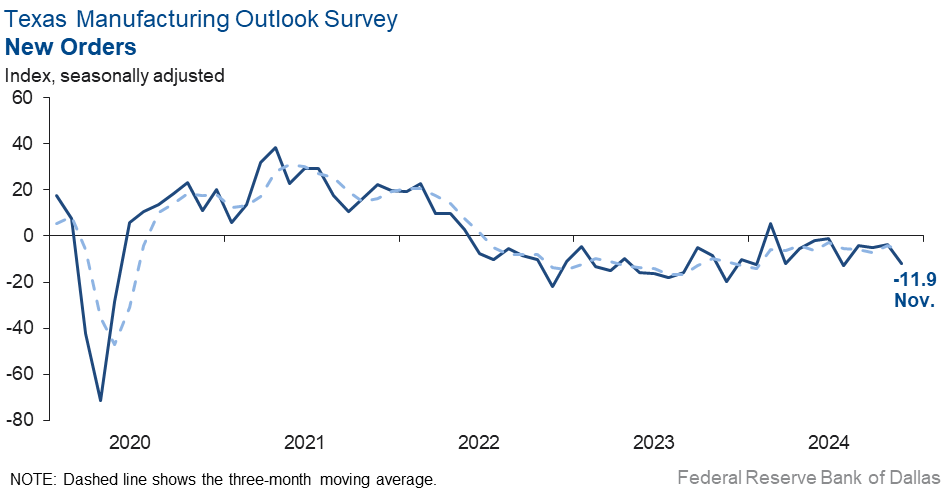
Other measures of manufacturing activity suggested contraction this month. The new orders index pushed further negative to -11.9, indicating continued declines in demand. The capacity utilization and shipments indexes slipped back into negative territory, coming in at -4.8 and -5.9, respectively.
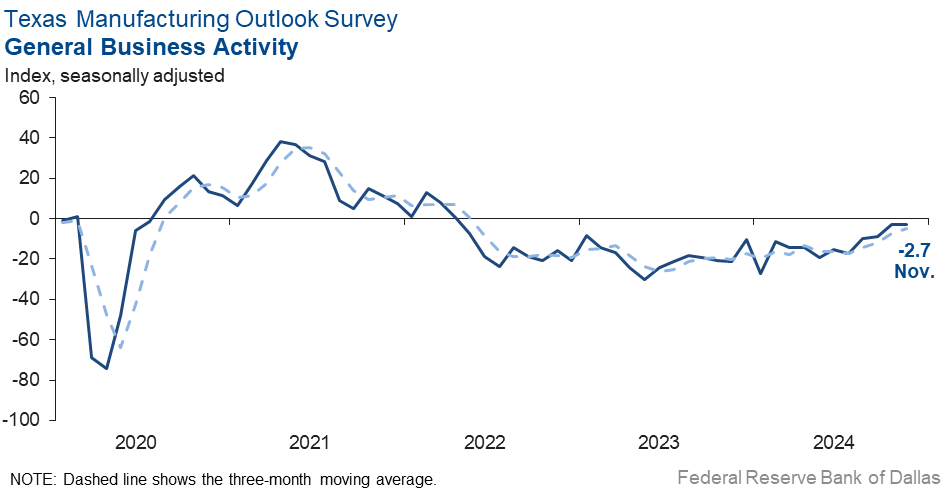
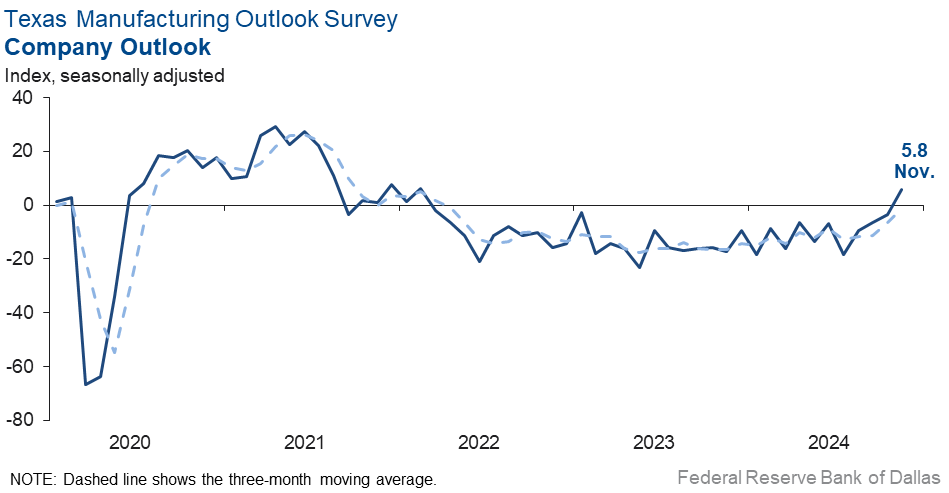
Perceptions of broader business conditions were mixed in November. The general business activity index held steady at -2.7, while the company outlook index moved up nine points to 5.8, its first positive reading since early 2022. The outlook uncertainty index fell 11 points to 5.9.
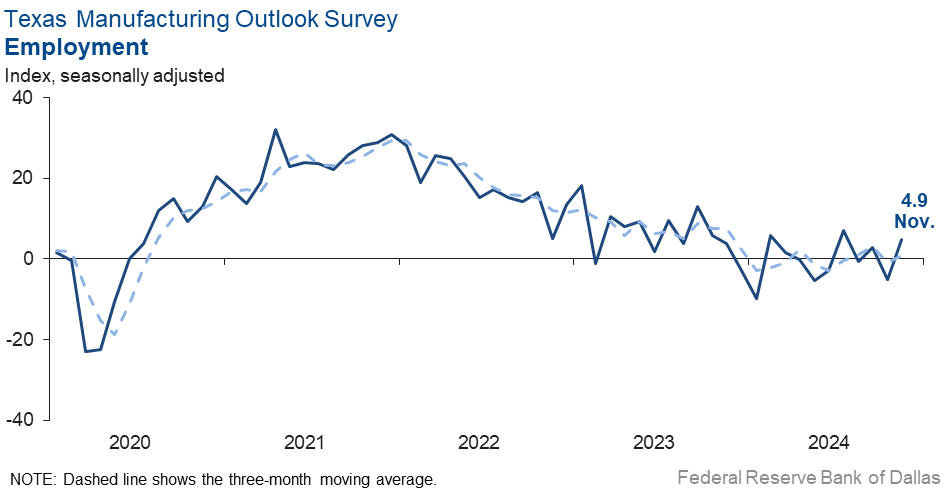
Labor market measures suggested increased employment and steady workweeks this month. The employment index shot up 10 points to 4.9. Nineteen percent of firms noted net hiring, while 14 percent noted net layoffs. The hours worked index moved up to zero, a reading indicative of no change in workweek length from October.
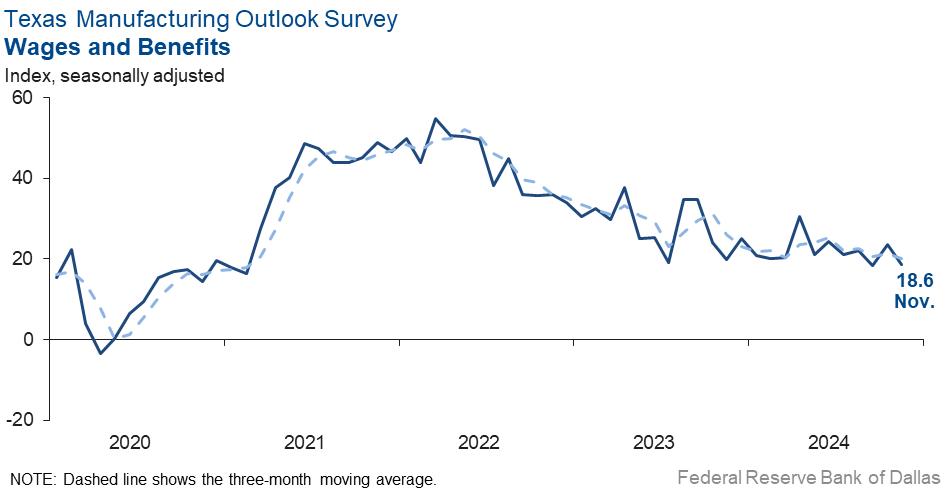
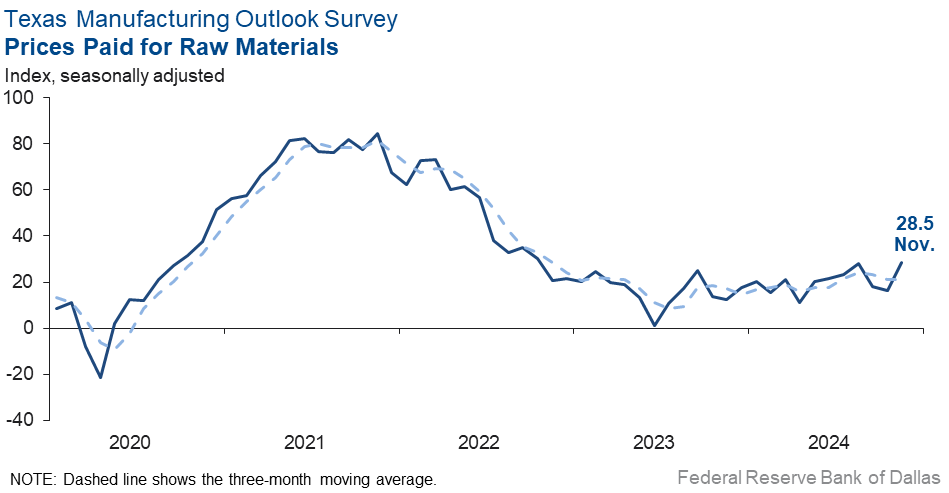
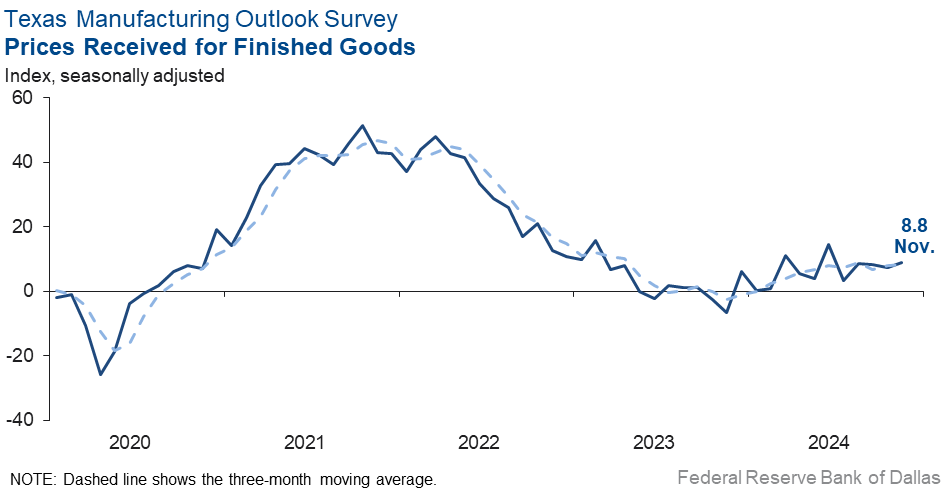
Moderate upward pressure on prices and wages was seen in November, with all indexes near their historical averages. The raw materials prices index moved up 12 points to 28.5, and the finished goods prices index was largely unchanged at 8.8. The wages and benefits index slipped five points to 18.6.
Expectations are for increased manufacturing activity six months from now. The future production index inched up to 44.0, a three-year high. Similarly, the future general business activity index edged up to a three-year high of 31.2. Other indexes of future manufacturing activity showed mixed movements this month but remained elevated.
Next release: Monday, December 30
Data were collected Nov. 12–20, and 86 of the 124 Texas manufacturers surveyed submitted a response. The Dallas Fed conducts the Texas Manufacturing Outlook Survey monthly to obtain a timely assessment of the state’s factory activity. Firms are asked whether output, employment, orders, prices and other indicators increased, decreased or remained unchanged over the previous month.
Survey responses are used to calculate an index for each indicator. Each index is calculated by subtracting the percentage of respondents reporting a decrease from the percentage reporting an increase. When the share of firms reporting an increase exceeds the share reporting a decrease, the index will be greater than zero, suggesting the indicator has increased over the prior month. If the share of firms reporting a decrease exceeds the share reporting an increase, the index will be below zero, suggesting the indicator has decreased over the prior month. An index will be zero when the number of firms reporting an increase is equal to the number of firms reporting a decrease. Data have been seasonally adjusted as necessary.
Results summary
Historical data are available from June 2004 to the most current release month.
| Business Indicators Relating to Facilities and Products in Texas Current (versus previous month) | ||||||||
| Indicator | Nov Index | Oct Index | Change | Series Average | Trend* | % Reporting Increase | % Reporting No Change | % Reporting Decrease |
Production | –0.9 | 14.6 | –15.5 | 9.7 | 1(–) | 25.3 | 48.5 | 26.2 |
Capacity Utilization | –4.8 | 4.3 | –9.1 | 7.6 | 1(–) | 19.6 | 56.0 | 24.4 |
New Orders | –11.9 | –3.7 | –8.2 | 4.9 | 9(–) | 21.4 | 45.2 | 33.3 |
Growth Rate of Orders | –12.5 | –11.7 | –0.8 | –0.8 | 7(–) | 17.8 | 51.9 | 30.3 |
Unfilled Orders | –14.1 | –17.5 | +3.4 | –2.4 | 3(–) | 6.9 | 72.1 | 21.0 |
Shipments | –5.9 | 1.5 | –7.4 | 8.0 | 1(–) | 24.9 | 44.3 | 30.8 |
Delivery Time | –5.2 | –11.5 | +6.3 | 0.8 | 20(–) | 7.5 | 79.8 | 12.7 |
Finished Goods Inventories | –14.1 | 2.3 | –16.4 | –3.2 | 1(–) | 10.6 | 64.7 | 24.7 |
Prices Paid for Raw Materials | 28.5 | 16.3 | +12.2 | 27.1 | 55(+) | 30.6 | 67.3 | 2.1 |
Prices Received for Finished Goods | 8.8 | 7.4 | +1.4 | 8.6 | 12(+) | 15.2 | 78.4 | 6.4 |
Wages and Benefits | 18.6 | 23.5 | –4.9 | 21.2 | 55(+) | 20.8 | 77.0 | 2.2 |
Employment | 4.9 | –5.1 | +10.0 | 7.4 | 1(+) | 19.3 | 66.3 | 14.4 |
Hours Worked | 0.3 | –5.5 | +5.8 | 3.2 | 1(+) | 10.5 | 79.3 | 10.2 |
Capital Expenditures | 7.8 | 4.6 | +3.2 | 6.6 | 14(+) | 21.1 | 65.6 | 13.3 |
| General Business Conditions Current (versus previous month) | ||||||||
| Indicator | Nov Index | Oct Index | Change | Series Average | Trend** | % Reporting Improved | % Reporting No Change | % Reporting Worsened |
Company Outlook | 5.8 | –3.3 | +9.1 | 4.4 | 1(+) | 22.7 | 60.4 | 16.9 |
General Business Activity | –2.7 | –3.0 | +0.3 | 0.6 | 31(–) | 16.2 | 64.9 | 18.9 |
| Indicator | Nov Index | Oct Index | Change | Series Average | Trend* | % Reporting Increase | % Reporting No Change | % Reporting Decrease |
Outlook Uncertainty | 5.9 | 16.4 | –10.5 | 17.0 | 43(+) | 23.5 | 58.8 | 17.6 |
| Business Indicators Relating to Facilities and Products in Texas Future (six months ahead) | ||||||||
| Indicator | Nov Index | Oct Index | Change | Series Average | Trend* | % Reporting Increase | % Reporting No Change | % Reporting Decrease |
Production | 44.0 | 42.4 | +1.6 | 36.3 | 55(+) | 52.5 | 39.0 | 8.5 |
Capacity Utilization | 35.2 | 42.0 | –6.8 | 33.2 | 55(+) | 44.3 | 46.7 | 9.1 |
New Orders | 44.9 | 36.6 | +8.3 | 33.7 | 25(+) | 53.2 | 38.5 | 8.3 |
Growth Rate of Orders | 36.8 | 26.0 | +10.8 | 24.8 | 18(+) | 44.6 | 47.6 | 7.8 |
Unfilled Orders | 10.2 | 1.9 | +8.3 | 2.8 | 4(+) | 18.9 | 72.4 | 8.7 |
Shipments | 37.8 | 39.1 | –1.3 | 34.7 | 55(+) | 48.0 | 41.9 | 10.2 |
Delivery Time | –3.7 | 4.7 | –8.4 | –1.4 | 1(–) | 8.2 | 79.9 | 11.9 |
Finished Goods Inventories | –5.1 | –4.9 | –0.2 | –0.1 | 3(–) | 14.1 | 66.7 | 19.2 |
Prices Paid for Raw Materials | 32.5 | 29.3 | +3.2 | 33.3 | 56(+) | 37.4 | 57.7 | 4.9 |
Prices Received for Finished Goods | 27.8 | 19.7 | +8.1 | 20.8 | 55(+) | 27.8 | 72.2 | 0.0 |
Wages and Benefits | 41.7 | 40.3 | +1.4 | 39.3 | 246(+) | 43.6 | 54.5 | 1.9 |
Employment | 25.3 | 28.7 | –3.4 | 22.8 | 54(+) | 32.4 | 60.5 | 7.1 |
Hours Worked | 11.5 | 13.8 | –2.3 | 8.8 | 8(+) | 17.1 | 77.3 | 5.6 |
Capital Expenditures | 13.2 | 12.8 | +0.4 | 19.4 | 54(+) | 20.6 | 72.0 | 7.4 |
| General Business Conditions Future (six months ahead) | ||||||||
| Indicator | Nov Index | Oct Index | Change | Series Average | Trend** | % Reporting Increase | % Reporting No Change | % Reporting Worsened |
Company Outlook | 36.3 | 34.6 | +1.7 | 18.4 | 12(+) | 41.6 | 53.1 | 5.3 |
General Business Activity | 31.2 | 29.6 | +1.6 | 12.4 | 6(+) | 38.4 | 54.4 | 7.2 |
*Shown is the number of consecutive months of expansion or contraction in the underlying indicator. Expansion is indicated by a positive index reading and denoted by a (+) in the table. Contraction is indicated by a negative index reading and denoted by a (–) in the table.
**Shown is the number of consecutive months of improvement or worsening in the underlying indicator. Improvement is indicated by a positive index reading and denoted by a (+) in the table. Worsening is indicated by a negative index reading and denoted by a (–) in the table.
Data have been seasonally adjusted as necessary.
Comments from survey respondents
These comments are from respondents’ completed surveys and have been edited for publication.
- Global industrial demand for chemicals remains stable but at low levels. Our outlook six months forward is for very slow improvement, but that outlook is uncertain due to risks of tariffs and the potential impact on global demand. Rising long-term rates remain a headwind for domestic construction activity and the resulting sluggish demand for PVC as construction material.
- Short-term, fourth-quarter raw material prices have increased, and the continuing decline in economic demand related to the automotive industry and building trades has created a large reduction in orders/volume. Longer term, the outcome of the election should benefit all U.S. businesses once policy is corrected and consumer confidence increases.
- We are delighted at the election outcome and expect this to be very good for our business.
- I believe we are seeing signs of cyclical bottoming. Several markets like consumer, communication and computers have clearly bottomed. Auto and industrial are still uncertain, but industrial is closer to a bottom.
- We are in a period of a bit of stagflation. It is compounded by the regime change. We do think the Trump administration will be healthy, particularly after the cabinet heads settle in, and free enterprise supported by domestic tranquility and the common defense become the norm.
- Hallelujah, the election is over, the results were unquestionably solid, work can be done, and attitudes are seemingly much improved. I do believe that six months from now we will prove to be at full throttle. We've held on the past year. We still have some rough water to navigate in the near term, but long term, things look mighty rosy in many areas of our marketplace. We're optimistic, we're encouraged, and we feel very blessed.
- Now that the election is over, we believe business will pick back up due to a more pro-business environment.
- There is trending softness at this time.
- The company outlook has improved due to capital expenditure to manufacture new products to enter new markets. Legacy business has declined, and new products will replace the decaying products.
- We continue to be slow, which is very odd given how busy we were for most of the calendar year. We are hopeful things will pick up, which is why we predict in six months we should be busier, plus we do tend to be busier in the late spring to summer time frame.
- Prices paid for finished goods have increased, and we are unsure of how potential tariffs will impact our cost of goods sold. Demand is also in question, and uncertainty is high.
- There are things to work out nationally, but [we are] getting poised for growth.
- Things are good.
Historical Data
Historical data can be downloaded dating back to June 2004.
Indexes
Download indexes for all indicators. For the definitions of all variables, see Data Definitions.
| Unadjusted |
| Seasonally adjusted |
All Data
Download indexes and components of the indexes (percentage of respondents reporting increase, decrease, or no change). For the definitions of all variables, see Data Definitions.
| Unadjusted |
| Seasonally adjusted |
Questions regarding the Texas Business Outlook Surveys can be addressed to Emily Kerr at emily.kerr@dal.frb.org.
Sign up for our email alert to be automatically notified as soon as the latest Texas Manufacturing Outlook Survey is released on the web.