Texas Manufacturing Outlook Survey

Growth continues in the Texas manufacturing sector
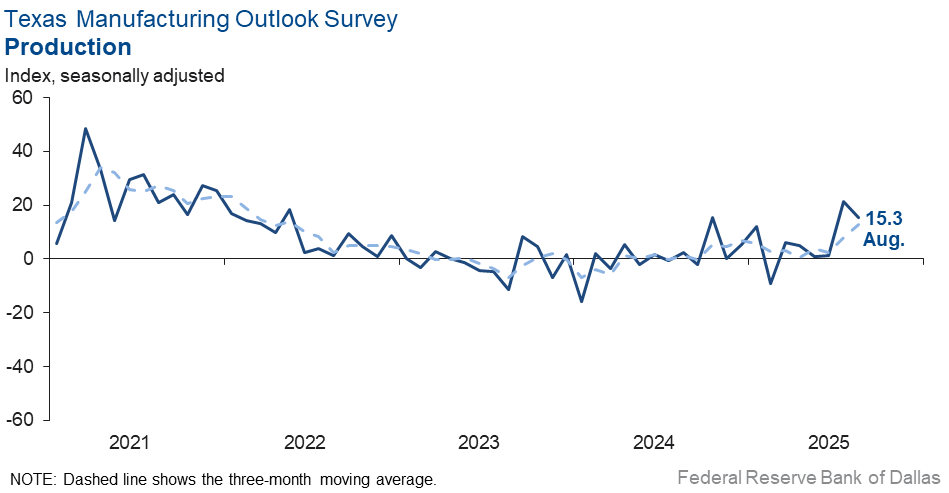
Texas factory activity continued to expand in August, according to business executives responding to the Texas Manufacturing Outlook Survey. The production index, a key measure of state manufacturing conditions, came in at 15.3, down from July’s reading of 21.3 but still well above average.
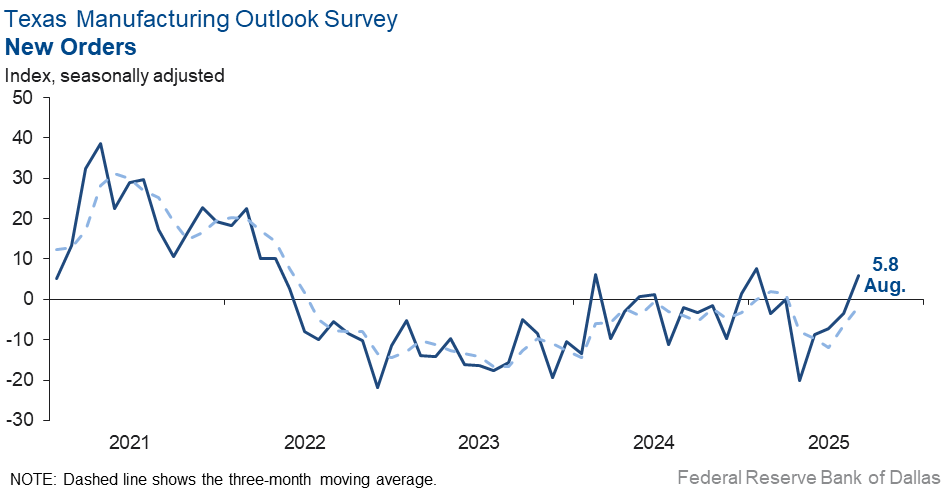
Other measures of manufacturing activity also indicated solid growth this month. The new orders index turned positive for the first time since January, rising to 5.8 from -3.6. The capacity utilization index remained elevated but slipped to 13.7 from 17.3. The shipments index shot up 12 points to 14.2, its highest reading in more than three years.
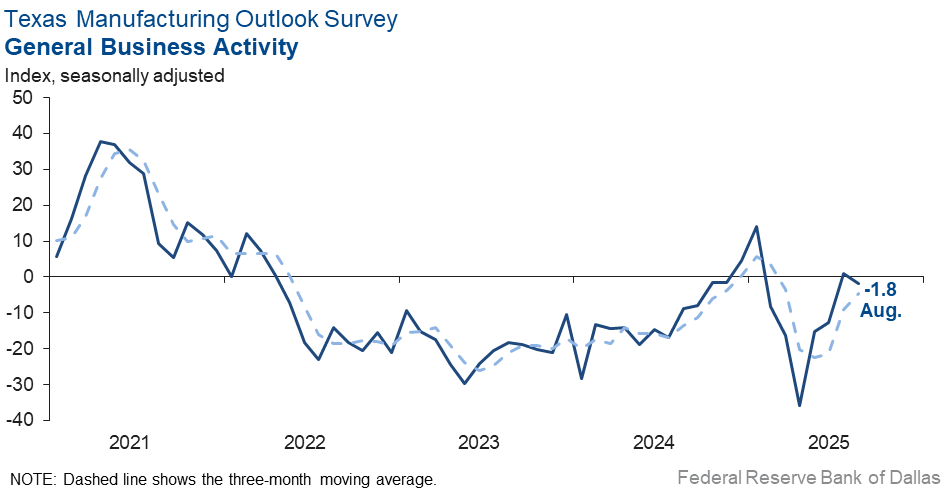
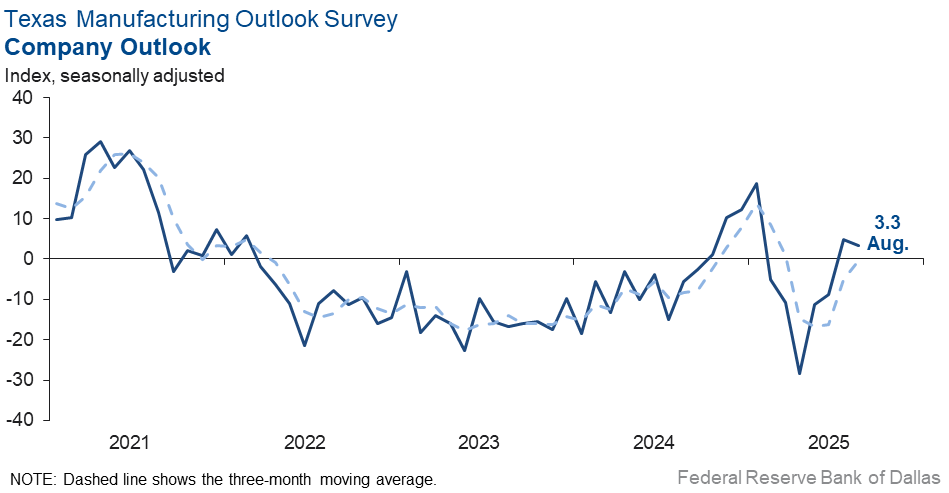
Perceptions of broader business conditions remained largely unchanged, and outlooks improved slightly. The general business activity index held near zero for a second month in a row, indicating little change in activity. The company outlook index remained slightly positive at 3.3. The outlook uncertainty index rose seven points to 18.3.
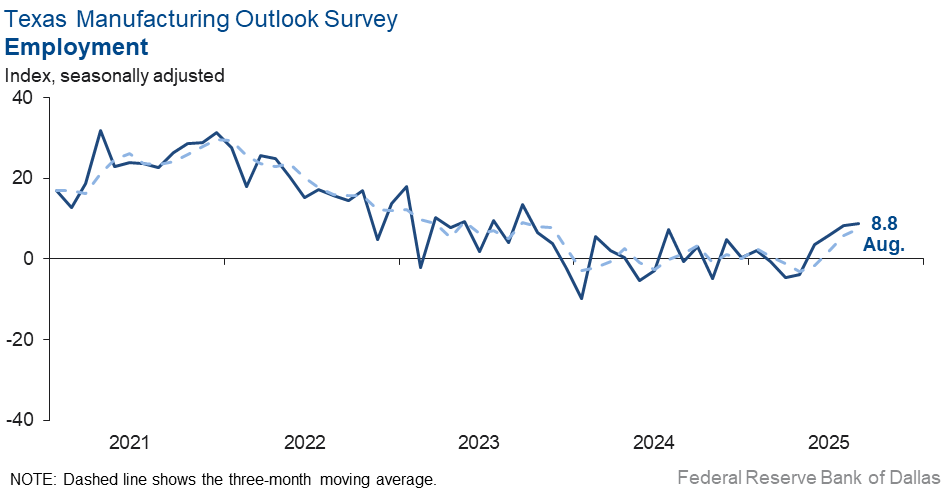
Labor market measures suggested increases in employment and work hours. The employment index held steady at 8.8, with 20 percent of firms noting net hiring and 11 percent noting net layoffs. The hours worked index climbed seven points to 15.0, its highest reading in more than three years.
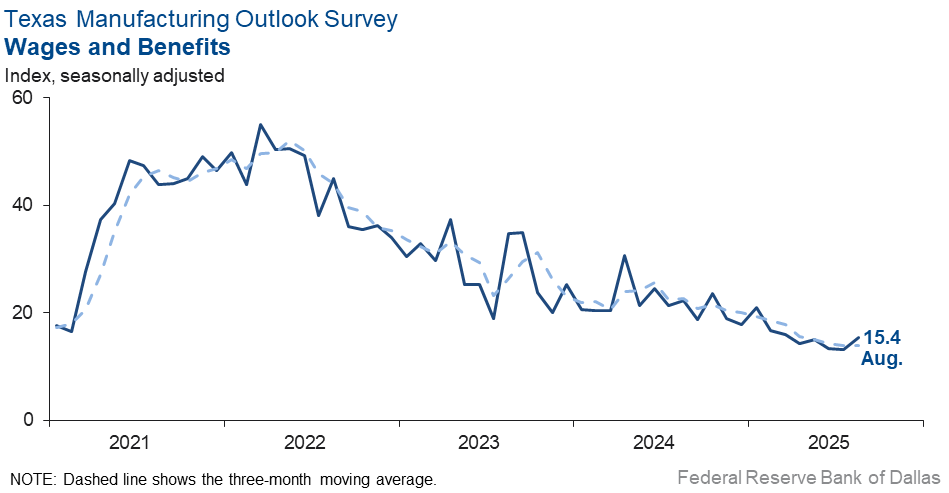
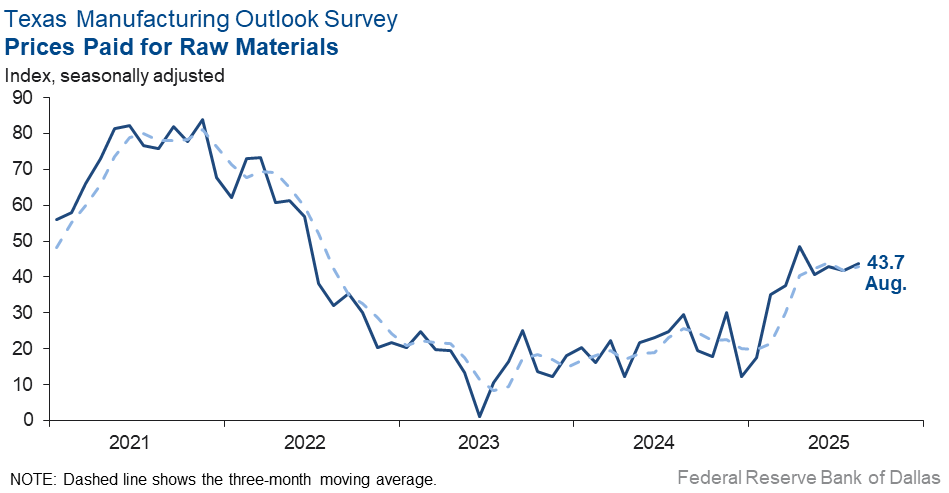
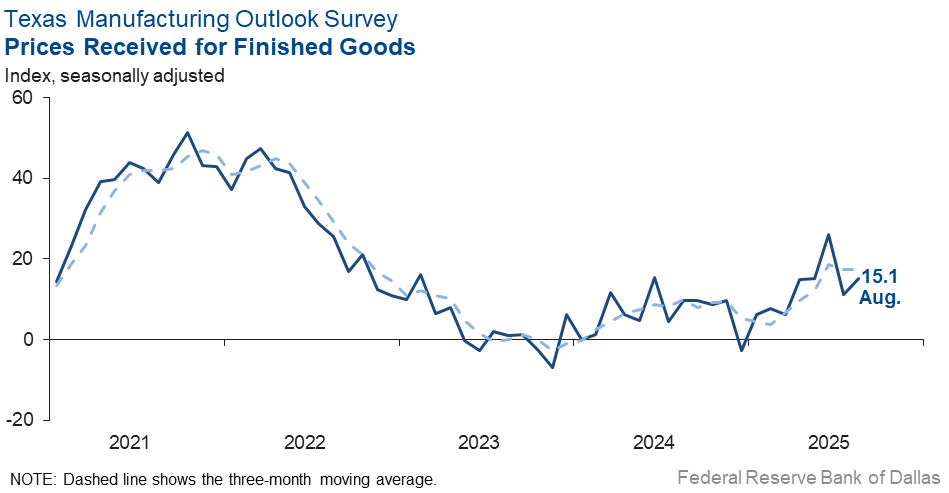
Price and wage pressures picked up slightly. The raw materials prices index edged up to 43.7, well above its average reading of 27.4. The finished goods prices index moved up four points to 15.1, also an elevated reading. The wages and benefits index remained lower than average but inched up to 15.4.
Expectations for manufacturing activity six months from now improved. The future production index rose 10 points to 40.4, while the future general business activity index rose six points to 24.8. Other indexes of future manufacturing activity also increased, with most now residing above their average readings.
Next release: Monday, September 29
Data were collected Aug. 12–20, and 82 of the 116 Texas manufacturers surveyed submitted responses. The Dallas Fed conducts the Texas Manufacturing Outlook Survey monthly to obtain a timely assessment of the state’s factory activity. Firms are asked whether output, employment, orders, prices and other indicators increased, decreased or remained unchanged over the previous month.
Survey responses are used to calculate an index for each indicator. Each index is calculated by subtracting the percentage of respondents reporting a decrease from the percentage reporting an increase. When the share of firms reporting an increase exceeds the share reporting a decrease, the index will be greater than zero, suggesting the indicator has increased over the prior month. If the share of firms reporting a decrease exceeds the share reporting an increase, the index will be below zero, suggesting the indicator has decreased over the prior month. An index will be zero when the number of firms reporting an increase is equal to the number of firms reporting a decrease. Data have been seasonally adjusted as necessary.
Results summary
Historical data are available from June 2004 to the most current release month.
| Business Indicators Relating to Facilities and Products in Texas Current (versus previous month) | ||||||||
| Indicator | Aug Index | Jul Index | Change | Series Average | Trend* | % Reporting Increase | % Reporting No Change | % Reporting Decrease |
Production | 15.3 | 21.3 | –6.0 | 9.6 | 6(+) | 33.1 | 49.1 | 17.8 |
Capacity Utilization | 13.7 | 17.3 | –3.6 | 7.5 | 2(+) | 30.4 | 52.9 | 16.7 |
New Orders | 5.8 | –3.6 | +9.4 | 4.7 | 1(+) | 28.3 | 49.2 | 22.5 |
Growth Rate of Orders | 2.6 | –9.1 | +11.7 | –1.1 | 1(+) | 23.9 | 54.8 | 21.3 |
Unfilled Orders | –5.1 | –12.0 | +6.9 | –2.6 | 12(–) | 13.1 | 68.7 | 18.2 |
Shipments | 14.2 | 2.7 | +11.5 | 7.9 | 2(+) | 34.0 | 46.3 | 19.8 |
Delivery Time | 2.3 | –7.8 | +10.1 | 0.6 | 1(+) | 11.1 | 80.1 | 8.8 |
Finished Goods Inventories | 3.8 | –11.2 | +15.0 | –3.2 | 1(+) | 21.3 | 61.3 | 17.5 |
Prices Paid for Raw Materials | 43.7 | 41.7 | +2.0 | 27.4 | 64(+) | 49.6 | 44.6 | 5.9 |
Prices Received for Finished Goods | 15.1 | 11.1 | +4.0 | 8.7 | 8(+) | 24.3 | 66.5 | 9.2 |
Wages and Benefits | 15.4 | 13.2 | +2.2 | 21.0 | 64(+) | 17.2 | 81.0 | 1.8 |
Employment | 8.8 | 8.4 | +0.4 | 7.3 | 4(+) | 20.0 | 68.8 | 11.2 |
Hours Worked | 15.0 | 7.7 | +7.3 | 3.0 | 2(+) | 23.4 | 68.2 | 8.4 |
Capital Expenditures | 14.6 | 6.8 | +7.8 | 6.6 | 4(+) | 25.1 | 64.4 | 10.5 |
| General Business Conditions Current (versus previous month) | ||||||||
| Indicator | Aug Index | Jul Index | Change | Series Average | Trend** | % Reporting Improved | % Reporting No Change | % Reporting Worsened |
Company Outlook | 3.3 | 4.7 | –1.4 | 4.3 | 2(+) | 24.3 | 54.7 | 21.0 |
General Business Activity | –1.8 | 0.9 | –2.7 | 0.4 | 1(–) | 21.7 | 54.8 | 23.5 |
| Indicator | Aug Index | Jul Index | Change | Series Average | Trend* | % Reporting Increase | % Reporting No Change | % Reporting Decrease |
Outlook Uncertainty | 18.3 | 11.2 | +7.1 | 17.2 | 52(+) | 24.4 | 69.5 | 6.1 |
| Business Indicators Relating to Facilities and Products in Texas Future (six months ahead) | ||||||||
| Indicator | Aug Index | Jul Index | Change | Series Average | Trend* | % Reporting Increase | % Reporting No Change | % Reporting Decrease |
Production | 40.4 | 30.3 | +10.1 | 36.1 | 64(+) | 53.0 | 34.4 | 12.6 |
Capacity Utilization | 40.4 | 27.8 | +12.6 | 33.0 | 64(+) | 50.6 | 39.2 | 10.2 |
New Orders | 36.0 | 23.7 | +12.3 | 33.5 | 34(+) | 48.4 | 39.2 | 12.4 |
Growth Rate of Orders | 28.4 | 18.8 | +9.6 | 24.8 | 27(+) | 40.1 | 48.3 | 11.7 |
Unfilled Orders | 11.6 | –4.2 | +15.8 | 2.8 | 1(+) | 19.6 | 72.4 | 8.0 |
Shipments | 37.2 | 21.0 | +16.2 | 34.5 | 64(+) | 46.4 | 44.4 | 9.2 |
Delivery Time | –1.9 | –5.6 | +3.7 | –1.4 | 6(–) | 7.6 | 82.9 | 9.5 |
Finished Goods Inventories | –1.3 | –5.4 | +4.1 | –0.2 | 6(–) | 14.7 | 69.3 | 16.0 |
Prices Paid for Raw Materials | 47.8 | 47.7 | +0.1 | 33.7 | 65(+) | 52.2 | 43.4 | 4.4 |
Prices Received for Finished Goods | 35.5 | 43.2 | –7.7 | 21.2 | 64(+) | 43.4 | 48.7 | 7.9 |
Wages and Benefits | 42.1 | 37.2 | +4.9 | 39.1 | 64(+) | 42.3 | 57.5 | 0.2 |
Employment | 27.6 | 27.3 | +0.3 | 22.8 | 63(+) | 34.3 | 59.0 | 6.7 |
Hours Worked | 6.8 | 8.5 | –1.7 | 8.7 | 2(+) | 16.8 | 73.2 | 10.0 |
Capital Expenditures | 23.3 | 15.5 | +7.8 | 19.4 | 63(+) | 33.7 | 55.9 | 10.4 |
| General Business Conditions Future (six months ahead) | ||||||||
| Indicator | Aug Index | Jul Index | Change | Series Average | Trend** | % Reporting Increase | % Reporting No Change | % Reporting Worsened |
Company Outlook | 26.8 | 21.6 | +5.2 | 18.3 | 4(+) | 36.8 | 53.2 | 10.0 |
General Business Activity | 24.8 | 19.0 | +5.8 | 12.4 | 4(+) | 34.0 | 56.8 | 9.2 |
*Shown is the number of consecutive months of expansion or contraction in the underlying indicator. Expansion is indicated by a positive index reading and denoted by a (+) in the table. Contraction is indicated by a negative index reading and denoted by a (–) in the table.
**Shown is the number of consecutive months of improvement or worsening in the underlying indicator. Improvement is indicated by a positive index reading and denoted by a (+) in the table. Worsening is indicated by a negative index reading and denoted by a (–) in the table.
Data have been seasonally adjusted as necessary.
- General construction, automotive and durable goods are at the lowest inventory and demand we have seen since 2008-2009 and, in fact, are worse. Interest rates are drastically impacting consumers in these basic materials industries and are killing U.S. manufacturing outside of the tech sector.
- We have started to pay tariffs on products that we receive from international vendors, and we are already pricing in tariff costs to our customers when they request pricing for new/future orders. For existing customer orders, we purchased almost all of the materials that we needed to build our customers’ orders prior to tariff implementation, so there has not been a large tariff impact on our business to date. But these tariffs will increase our costs and will be passed on to our customers’ new orders, which are typically industrial and military users (we sell no products that are for direct consumer use).
- We have largely been shielded from tariffs, but recent volatility in the copper market has affected us. We are paying substantially more for copper sheet, and we can't predict what the price will be in the future.
- It is time to cut interest rates before it is too late. The world is doing it in order to prepare for the effects of trade tensions.
- Labor shortages or difficulty finding workers [are issues affecting our business].
- Stagflation is impacting us and our customers. DOGE [Department of Government Efficiency] and its impact, while needed, have dramatically cut our production pipeline and production activity. I think the counterbalance of tariff income is positive. Inflation, while increasing, won’t be fueled by a slight cut in interest rates.
- Business investment is stifled. We think retailers are digesting the tariff impact with price investment instead of growth.
- We are probably going out of business within 90 days.
- Tariff bingo is tough.
- “Drill, baby, drill” was a great mantra, but it isn’t delivering to the folks in the industry. And what’s with a Federal Reserve that refuses to reduce interest rates? Chair Powell should cut the rate now.
- This is a fairly stable time of the year. We have been fortunate with having work, but I expect it will slow down in the fourth quarter as is the usual pattern.
- I do not fear competition; I crave it. I fear the tariff, the price cap and the subsidy. Give me a level playing field and watch the free market thrive.
- We are currently seeing more business activity, and sales are starting to stabilize at a higher level.
- Tariffs and the continuous contradictory, knee-jerk announcements that are a complete change in governmental/regulatory policy [are issues of concern]. Exclusion from tariffs for companies that are able to pay the government “fee” (if this were a Third World country, we'd call it a bribe) leaves the small companies, which are the lifeblood of the U.S., to carry all the punishment load.
- We have been treading water since the first of the year, and it is starting to get tired. The One Big Beautiful Bill is somewhat of a life preserver, but we need activity in manufacturing to pick up sooner than 2-3 years from now.
- Our industry is closely tied to the building and construction market, which remains softer than in previous years. The transportation industry, namely trailer manufacturing, is down significantly. Building and construction and transportation are the largest markets for our products. However, that downturn is being partially offset by the ongoing trend of onshoring manufactured goods, driven largely by tariffs. One major challenge in recent years has been Mexico’s exemption from Section 232 tariffs, which created a significant disadvantage for U.S. manufacturers in our segment. With that exemption now lifted, we’re seeing a more level playing field. However we are still highly disadvantaged. This change should benefit our industry, particularly as China had been setting up operations in Mexico to bypass tariffs and enter the U.S. market tariff-free. Our industry only enjoys about 30 percent of the protection given by Section 232 tariffs because we have to pay the full duties on our raw materials. However, Section 232 protection is a step in the right direction for strengthening U.S. manufacturing.
- It seems like there is lots of uncertainty in our industry, with these goofy tariffs being a big part of the reason. I am very worried about what the next six months will bring. We have continued to be busy with large projects that have been in the works for a while. If not for them, we would be stupid slow.
- We are still trying to deal with the ever-changing tariffs. The trucking industry remains depressed. The increases currently experienced are directionally correct, but still nowhere near normal levels.
- Growth is predicated on lowering of interest rates.
- We have a lot of work.
Historical Data
Historical data can be downloaded dating back to June 2004.
Indexes
Download indexes for all indicators. For the definitions of all variables, see Data Definitions.
| Unadjusted |
| Seasonally adjusted |
All Data
Download indexes and components of the indexes (percentage of respondents reporting increase, decrease, or no change). For the definitions of all variables, see Data Definitions.
| Unadjusted |
| Seasonally adjusted |
Special questions
For this month’s survey, Texas business executives were asked supplemental questions on demand expectations, pricing power and the impact of tariffs. Results below include responses from participants of all three surveys: Texas Manufacturing Outlook Survey, Texas Service Sector Outlook Survey and Texas Retail Outlook Survey. View individual survey results.
Questions regarding the Texas Business Outlook Surveys can be addressed to Emily Kerr at emily.kerr@dal.frb.org.
Sign up for our email alert to be automatically notified as soon as the latest Texas Manufacturing Outlook Survey is released on the web.