Texas Manufacturing Outlook Survey

Growth moderates in the Texas manufacturing sector
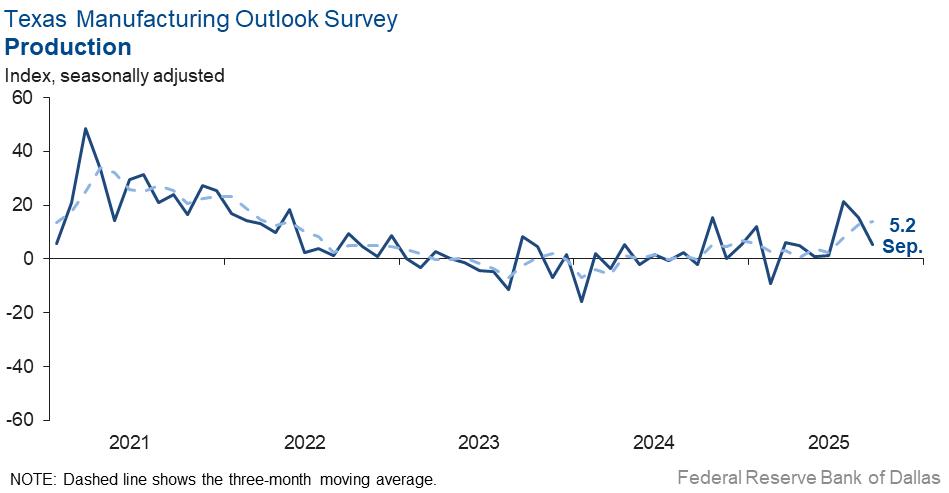
Texas factory activity continued to expand in September, albeit at a slower pace, according to business executives responding to the Texas Manufacturing Outlook Survey. The production index, a key measure of state manufacturing conditions, came in at 5.2, down 10 points from August and indicative of below-average output growth.
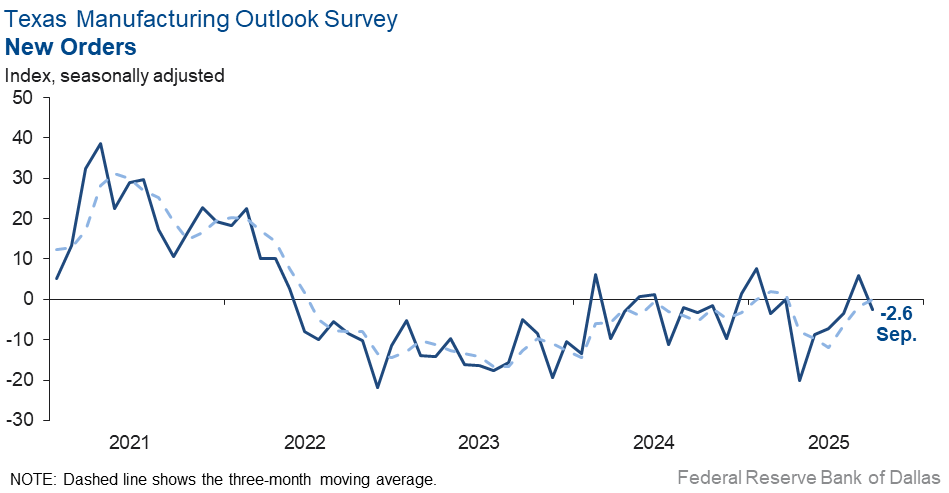
Other measures of manufacturing activity also moved down this month, with most pointing to notably slower growth than in August. The capacity utilization index slipped to 3.9 from 13.7. The shipments index retreated eight points to 6.7. The new orders index fell eight points to -2.6, with the negative reading indicating a slight decline in demand in September after an uptick in August.
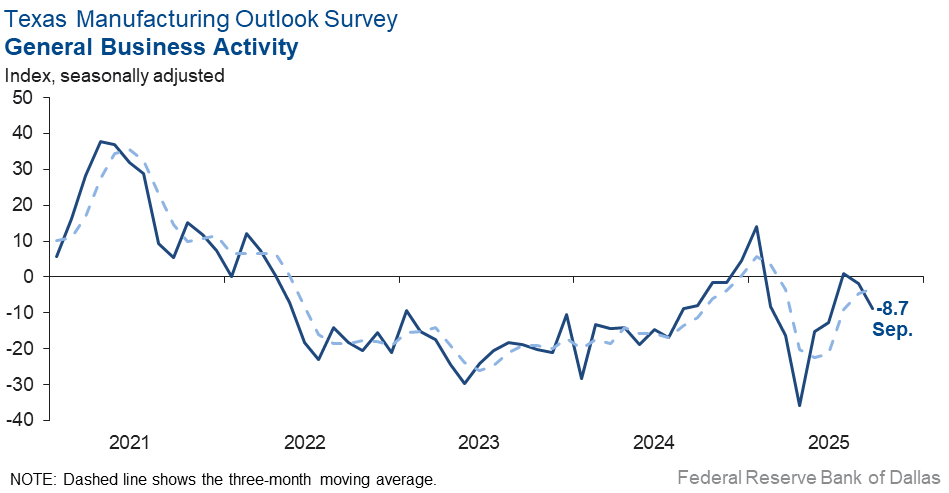
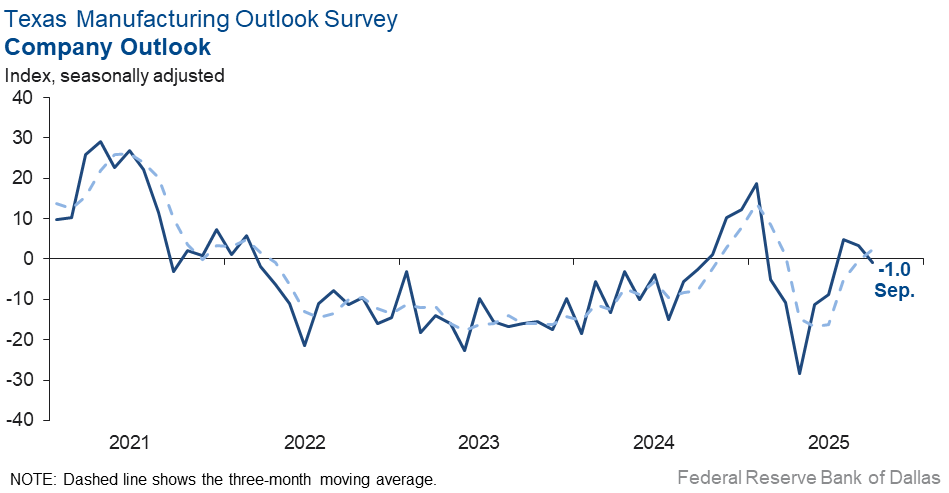
Perceptions of broader business conditions worsened somewhat this month, as the general business activity index fell seven points to -8.7. Outlooks were stable, with the company outlook index coming in near zero in September. The outlook uncertainty index edged down to 13.9, a slightly below-average reading.
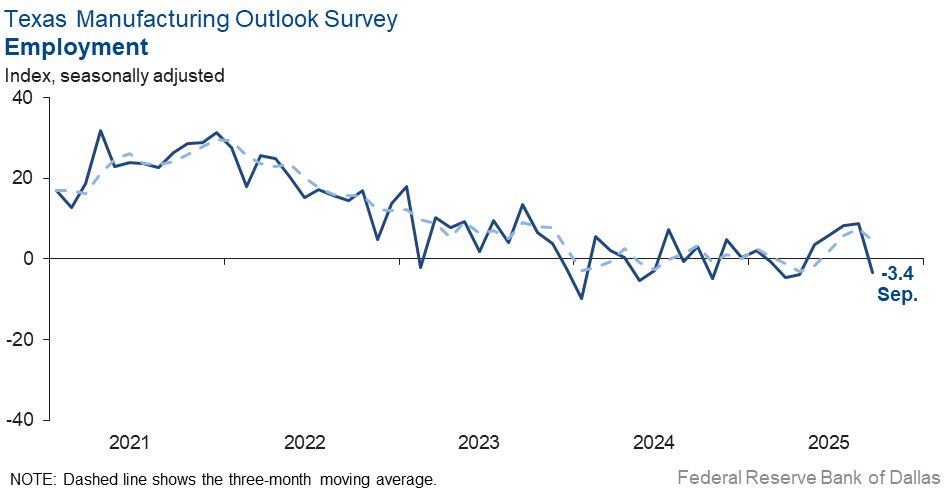
Labor market measures suggested a slight decline in employment and a slight increase in work hours. The employment index dropped 12 points to -3.4, its lowest reading since April. Thirteen percent of firms noted net hiring, and 16 percent noted net layoffs. The hours worked index also slipped 12 points but remained positive at 3.4, suggesting somewhat longer workweeks in September.
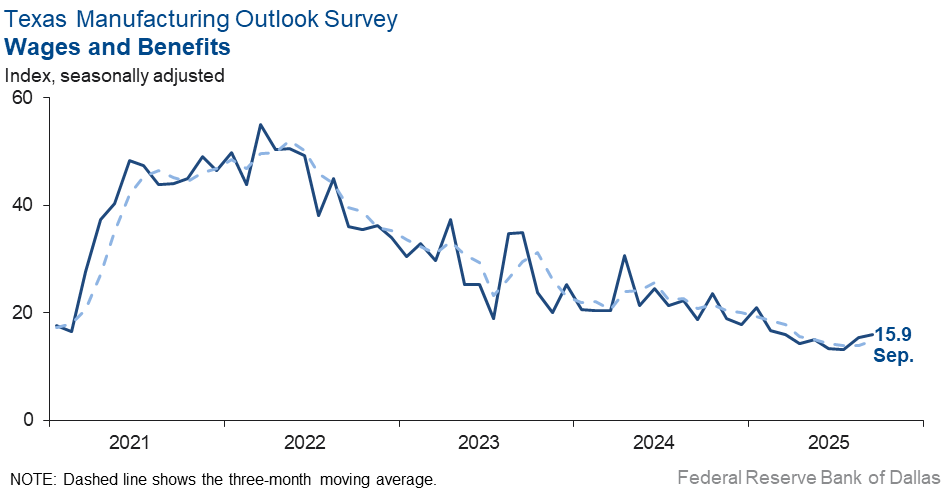
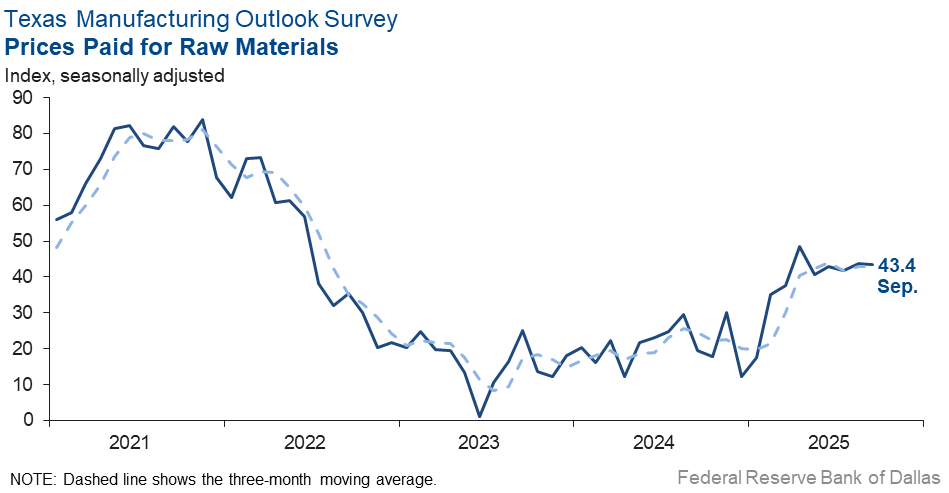
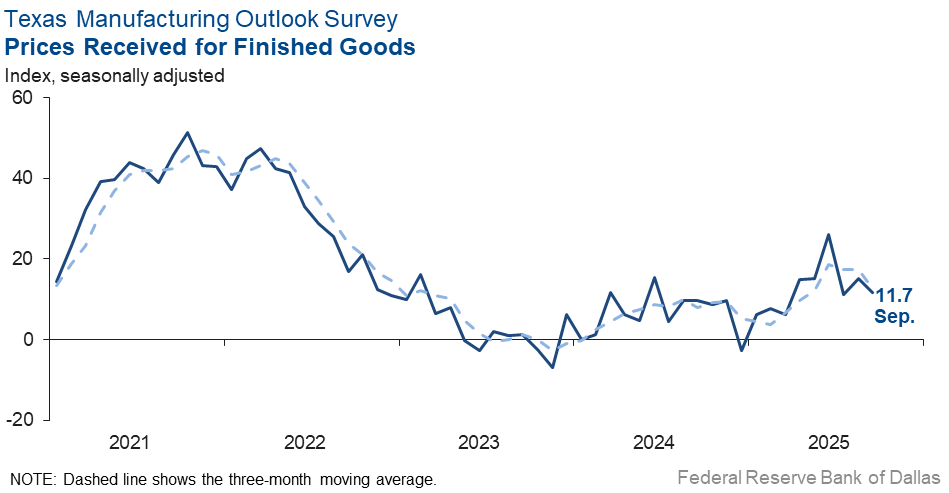
Price and wage pressures were largely unchanged this month. The raw materials prices index remined elevated at 43.4. The finished goods prices index edged down to 11.7. The wages and benefits index held steady at 15.9, slightly below its average reading.
Expectations for manufacturing activity six months from now remained positive, though optimism waned somewhat. The future production index fell to 31.6 from 40.4, while the future general business activity dropped 16 points to 8.4. Most other indexes of future manufacturing activity also moved down but remained positive, still indicating increased activity six months ahead.
Next release: Monday, October 27
Data were collected Sep. 16–24, and 72 of the 116 Texas manufacturers surveyed submitted responses. The Dallas Fed conducts the Texas Manufacturing Outlook Survey monthly to obtain a timely assessment of the state’s factory activity. Firms are asked whether output, employment, orders, prices and other indicators increased, decreased or remained unchanged over the previous month.
Survey responses are used to calculate an index for each indicator. Each index is calculated by subtracting the percentage of respondents reporting a decrease from the percentage reporting an increase. When the share of firms reporting an increase exceeds the share reporting a decrease, the index will be greater than zero, suggesting the indicator has increased over the prior month. If the share of firms reporting a decrease exceeds the share reporting an increase, the index will be below zero, suggesting the indicator has decreased over the prior month. An index will be zero when the number of firms reporting an increase is equal to the number of firms reporting a decrease. Data have been seasonally adjusted as necessary.
Results summary
Historical data are available from June 2004 to the most current release month.
| Business Indicators Relating to Facilities and Products in Texas Current (versus previous month) | ||||||||
| Indicator | Sep Index | Aug Index | Change | Series Average | Trend* | % Reporting Increase | % Reporting No Change | % Reporting Decrease |
Production | 5.2 | 15.3 | –10.1 | 9.6 | 7(+) | 25.9 | 53.4 | 20.7 |
Capacity Utilization | 3.9 | 13.7 | –9.8 | 7.4 | 3(+) | 23.8 | 56.2 | 19.9 |
New Orders | –2.6 | 5.8 | –8.4 | 4.7 | 1(–) | 27.0 | 43.4 | 29.6 |
Growth Rate of Orders | –6.4 | 2.6 | –9.0 | –1.1 | 1(–) | 21.9 | 49.8 | 28.3 |
Unfilled Orders | –8.4 | –5.1 | –3.3 | –2.6 | 13(–) | 8.0 | 75.6 | 16.4 |
Shipments | 6.7 | 14.2 | –7.5 | 7.9 | 3(+) | 30.2 | 46.3 | 23.5 |
Delivery Time | –8.2 | 2.3 | –10.5 | 0.6 | 1(–) | 3.0 | 85.8 | 11.2 |
Finished Goods Inventories | –9.7 | 3.8 | –13.5 | –3.2 | 1(–) | 11.1 | 68.1 | 20.8 |
Prices Paid for Raw Materials | 43.4 | 43.7 | –0.3 | 27.5 | 65(+) | 45.1 | 53.2 | 1.7 |
Prices Received for Finished Goods | 11.7 | 15.1 | –3.4 | 8.7 | 9(+) | 20.5 | 70.7 | 8.8 |
Wages and Benefits | 15.9 | 15.4 | +0.5 | 21.0 | 65(+) | 16.2 | 83.5 | 0.3 |
Employment | –3.4 | 8.8 | –12.2 | 7.2 | 1(–) | 12.7 | 71.3 | 16.1 |
Hours Worked | 3.4 | 15.0 | –11.6 | 3.0 | 3(+) | 18.3 | 66.8 | 14.9 |
Capital Expenditures | 13.3 | 14.6 | –1.3 | 6.6 | 5(+) | 21.9 | 69.5 | 8.6 |
| General Business Conditions Current (versus previous month) | ||||||||
| Indicator | Sep Index | Aug Index | Change | Series Average | Trend** | % Reporting Improved | % Reporting No Change | % Reporting Worsened |
Company Outlook | –1.0 | 3.3 | –4.3 | 4.2 | 1(–) | 19.9 | 59.2 | 20.9 |
General Business Activity | –8.7 | –1.8 | –6.9 | 0.3 | 2(–) | 17.9 | 55.5 | 26.6 |
| Indicator | Sep Index | Aug Index | Change | Series Average | Trend* | % Reporting Increase | % Reporting No Change | % Reporting Decrease |
Outlook Uncertainty | 13.9 | 18.3 | –4.4 | 17.2 | 53(+) | 26.4 | 61.1 | 12.5 |
| Business Indicators Relating to Facilities and Products in Texas Future (six months ahead) | ||||||||
| Indicator | Sep Index | Aug Index | Change | Series Average | Trend* | % Reporting Increase | % Reporting No Change | % Reporting Decrease |
Production | 31.6 | 40.4 | –8.8 | 36.1 | 65(+) | 45.1 | 41.4 | 13.5 |
Capacity Utilization | 23.8 | 40.4 | –16.6 | 33.0 | 65(+) | 38.7 | 46.3 | 14.9 |
New Orders | 34.3 | 36.0 | –1.7 | 33.5 | 35(+) | 49.0 | 36.3 | 14.7 |
Growth Rate of Orders | 32.7 | 28.4 | +4.3 | 24.8 | 28(+) | 44.4 | 44.0 | 11.7 |
Unfilled Orders | –0.8 | 11.6 | –12.4 | 2.7 | 1(–) | 12.0 | 75.2 | 12.8 |
Shipments | 30.0 | 37.2 | –7.2 | 34.5 | 65(+) | 44.5 | 41.0 | 14.5 |
Delivery Time | –0.8 | –1.9 | +1.1 | –1.4 | 7(–) | 7.3 | 84.6 | 8.1 |
Finished Goods Inventories | –10.3 | –1.3 | –9.0 | –0.3 | 7(–) | 5.9 | 77.9 | 16.2 |
Prices Paid for Raw Materials | 47.1 | 47.8 | –0.7 | 33.7 | 66(+) | 52.2 | 42.7 | 5.1 |
Prices Received for Finished Goods | 39.7 | 35.5 | +4.2 | 21.3 | 65(+) | 48.5 | 42.6 | 8.8 |
Wages and Benefits | 28.4 | 42.1 | –13.7 | 39.0 | 65(+) | 32.8 | 62.8 | 4.4 |
Employment | 12.7 | 27.6 | –14.9 | 22.8 | 64(+) | 31.9 | 48.8 | 19.2 |
Hours Worked | 3.2 | 6.8 | –3.6 | 8.7 | 3(+) | 14.6 | 74.0 | 11.4 |
Capital Expenditures | 12.5 | 23.3 | –10.8 | 19.4 | 64(+) | 27.5 | 57.5 | 15.0 |
| General Business Conditions Future (six months ahead) | ||||||||
| Indicator | Sep Index | Aug Index | Change | Series Average | Trend** | % Reporting Increase | % Reporting No Change | % Reporting Worsened |
Company Outlook | 11.7 | 26.8 | –15.1 | 18.3 | 5(+) | 31.9 | 47.9 | 20.2 |
General Business Activity | 8.4 | 24.8 | –16.4 | 12.3 | 5(+) | 26.9 | 54.6 | 18.5 |
*Shown is the number of consecutive months of expansion or contraction in the underlying indicator. Expansion is indicated by a positive index reading and denoted by a (+) in the table. Contraction is indicated by a negative index reading and denoted by a (–) in the table.
**Shown is the number of consecutive months of improvement or worsening in the underlying indicator. Improvement is indicated by a positive index reading and denoted by a (+) in the table. Worsening is indicated by a negative index reading and denoted by a (–) in the table.
Data have been seasonally adjusted as necessary.
Comments from survey respondents
Survey participants are given the opportunity to submit comments on current issues that may be affecting their businesses. Some comments have been edited for grammar and clarity.
- I may have to close the company. Orders have stopped coming in, and we do not know why.
- Orders have been put on hold, and we are not receiving any new [purchase orders] since Aug. 15 on open RFQ's [requests for quotation].
- Political and interest rate instability are killing us. We are fortunate that our raw ingredients are stable by price and supply chain availability. The non-profit food relief "business" is a train wreck.
- We are still concerned over employment and labor issues.
- We are seeing demand decline.
- We see the oil industry slowing and are more hesitant to invest in their business. We believe that the uncertainty of government decisions is affecting their business decisions, which in turn will affect our business.
- We should have our best month of the year in September. Orders are strong, plus we are working on some good new projects.
- Relief! Rates are easing, finally. Tariffs are of little consequence. Labor is steady. We might even turn a profit by year-end!
- After careful evaluation of prevailing economic conditions, including the current level of interest rates and unpredictability of tariffs, our company continues to hold and not proceed upon our expansion plans. The cost of financing at existing rates has materially impacted the feasibility of these projects, and we believe it is prudent to delay implementation until interest rates are reduced to more sustainable and affordable levels.. We remain committed to our operations in Texas and to continued long-term growth. However, further expansion (building addition, inventory expansion, capital equipment acquisition) will be contingent upon a more favorable borrowing environment that supports capital investment and job creation.
- The interest rates for mortgages are keeping potential new homeowners out of the market. Homebuilders do not want to build up excess inventory, and therefore our business of producing materials for homebuilders has dropped off significantly. In addition, roughly 30 percent of buyers are falling out of the homebuying process due to inability to qualify for mortgages (credit card debt).
- We are still neutral on our current status, but incoming orders are trending down when this time of year they should be up. A few tariff surcharges are starting to show up, but not enough to try to pass along. Competition in the packaging industry has prices declining somewhat.
- We need interest rates to fall more than a quarter percentage point.
- Incoming orders have definitely slowed way down, and all we can attribute it to is the crazy tariff-induced environment we are living in. Instead of Washington, D.C. policies increasing business and making it better, they seem to be adding way too much uncertainty and making things worse. We have continued to be busy because of robust incoming orders earlier in the summer. If things don't change quickly, we may soon be looking at reducing hours and possibly cutting back on the number of employees, which will be a shame given how hard it is to get good workers up to speed with your manufacturing processes.
- The trucking industry has now reduced its production forecast for 2026 to essentially be flat with 2025. This remains at a depressed level versus industry averages.
Historical Data
Historical data can be downloaded dating back to June 2004.
Indexes
Download indexes for all indicators. For the definitions of all variables, see Data Definitions.
| Unadjusted |
| Seasonally adjusted |
All Data
Download indexes and components of the indexes (percentage of respondents reporting increase, decrease, or no change). For the definitions of all variables, see Data Definitions.
| Unadjusted |
| Seasonally adjusted |
Special questions
For this month’s survey, Texas business executives were asked supplemental questions on wages, prices, outlook concerns, tax reform and remote work. Results below include responses from participants of all three surveys: Texas Manufacturing Outlook Survey, Texas Service Sector Outlook Survey and Texas Retail Outlook Survey. View individual survey results.
Questions regarding the Texas Business Outlook Surveys can be addressed to Emily Kerr at emily.kerr@dal.frb.org.
Sign up for our email alert to be automatically notified as soon as the latest Texas Manufacturing Outlook Survey is released on the web.