Texas Manufacturing Outlook Survey

Modest output growth continues in the Texas manufacturing sector
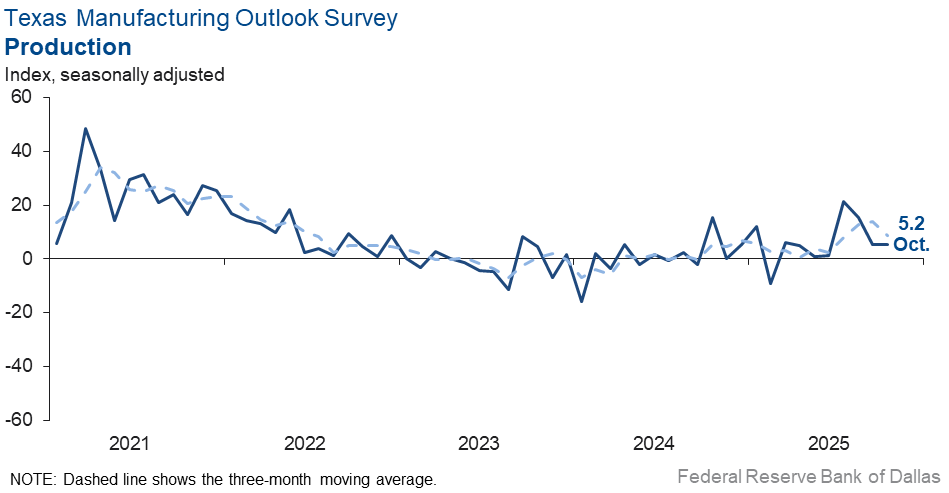
Texas factory activity continued to expand in October, according to business executives responding to the Texas Manufacturing Outlook Survey. The production index, a key measure of state manufacturing conditions, was unchanged at 5.2, indicating below-average output growth for the second consecutive month.
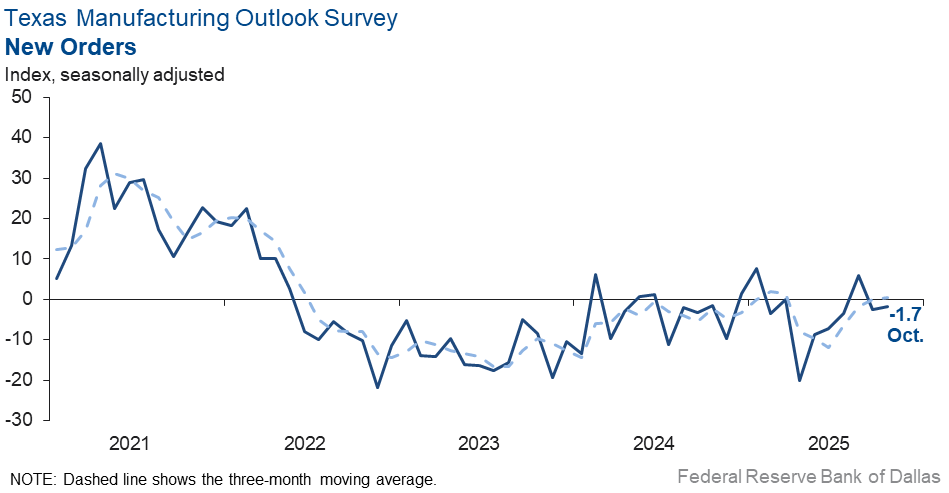
Other measures of manufacturing activity moved down or held steady this month. The new orders index was little changed at -1.7, with the negative reading indicating a slight decline in demand in October. The capacity utilization index slipped to -1.1 from 3.9. The shipments index held fairly steady at 5.8.
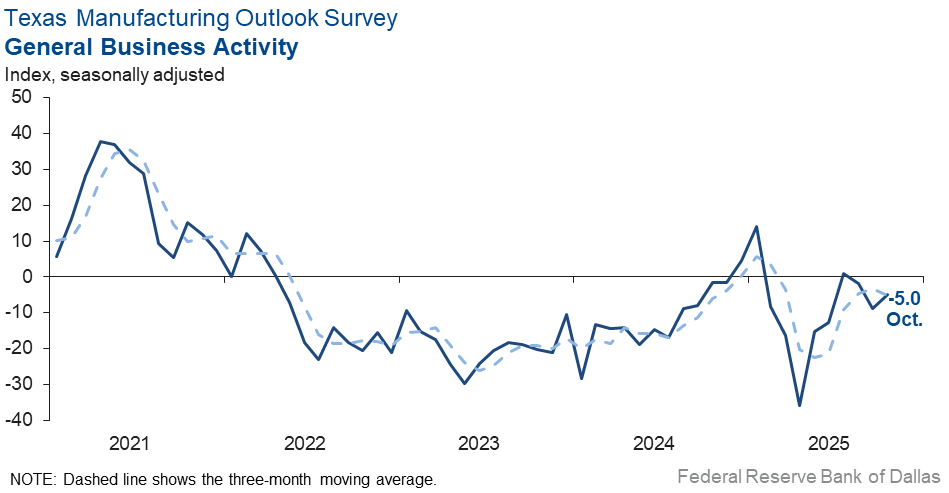
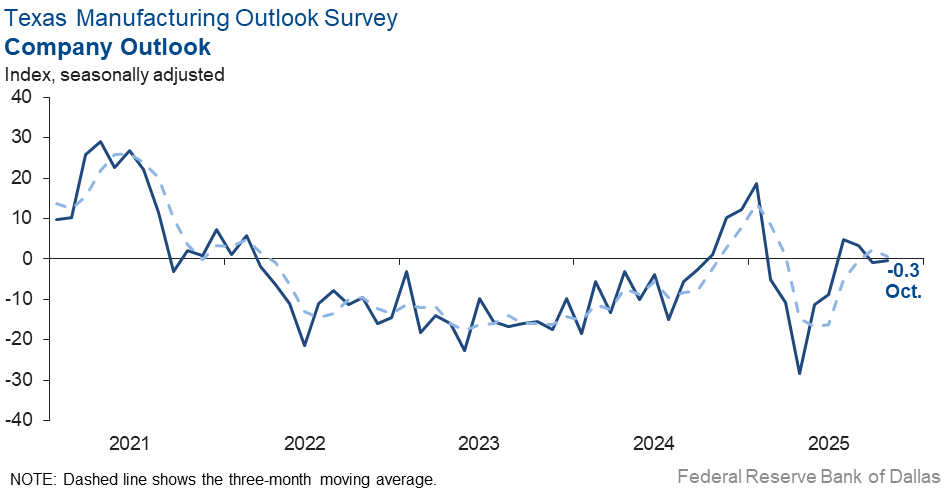
Perceptions of broader business conditions worsened somewhat this month. The general business activity index increased four points but remained in negative territory at -5.0. Outlooks were stable, with the company outlook index coming in at -0.3 in October. However, the outlook uncertainty index increased eight points to 22.2.
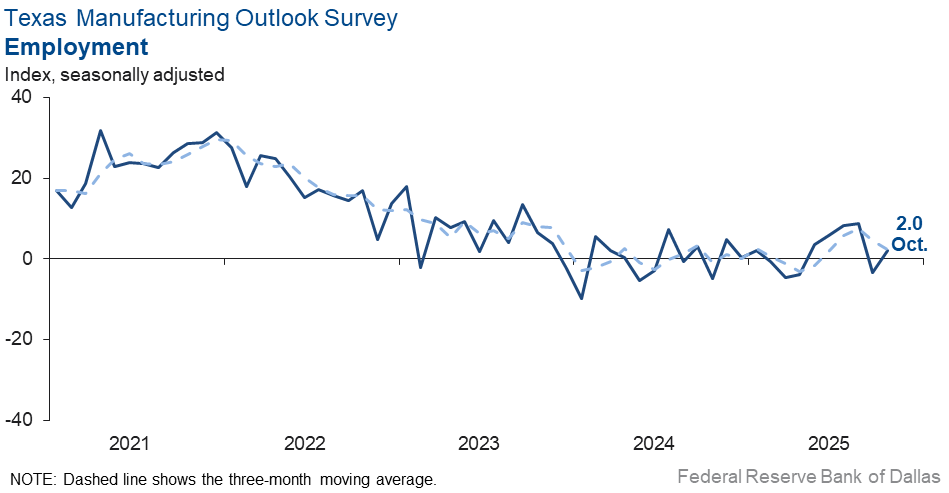
Labor market measures suggested a slight increase in employment, but a contraction in work hours in October. The employment index rose five points to 2.0. Eighteen percent of firms noted net hiring, and 16 percent noted net layoffs. The hours worked index retreated nine points to -5.5, suggesting shorter workweeks in October.
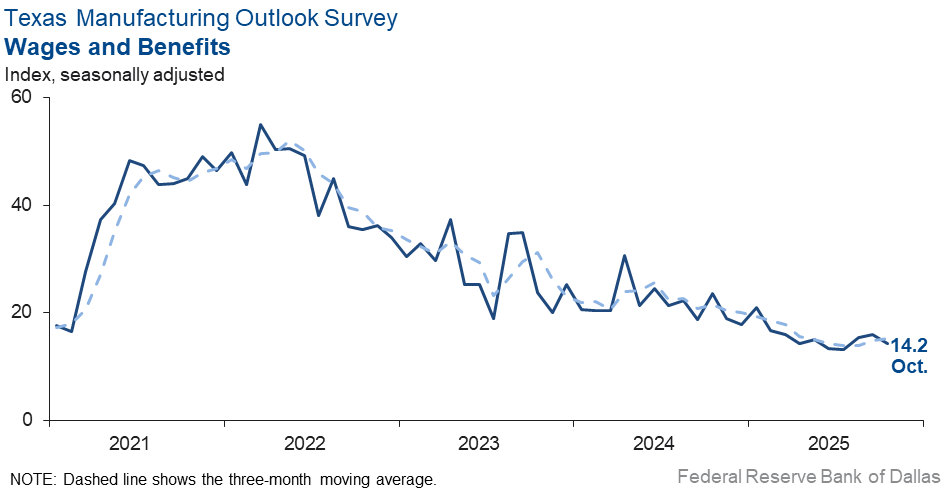
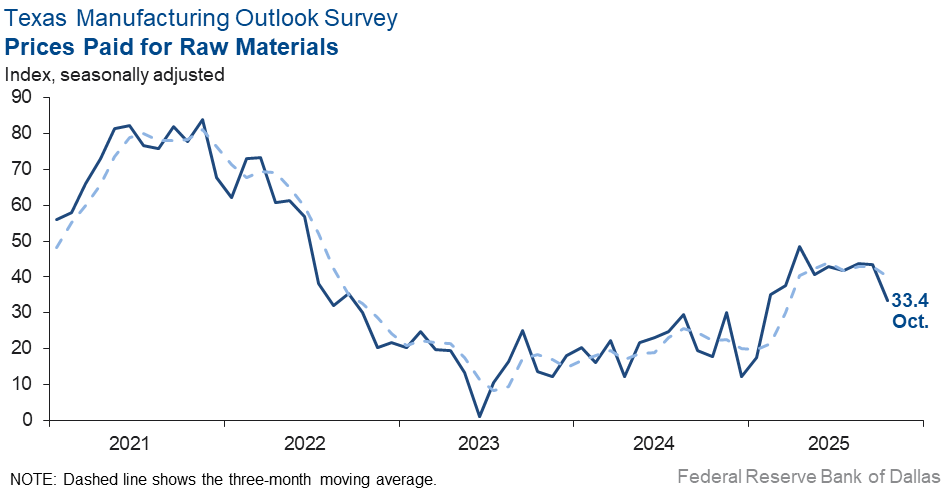
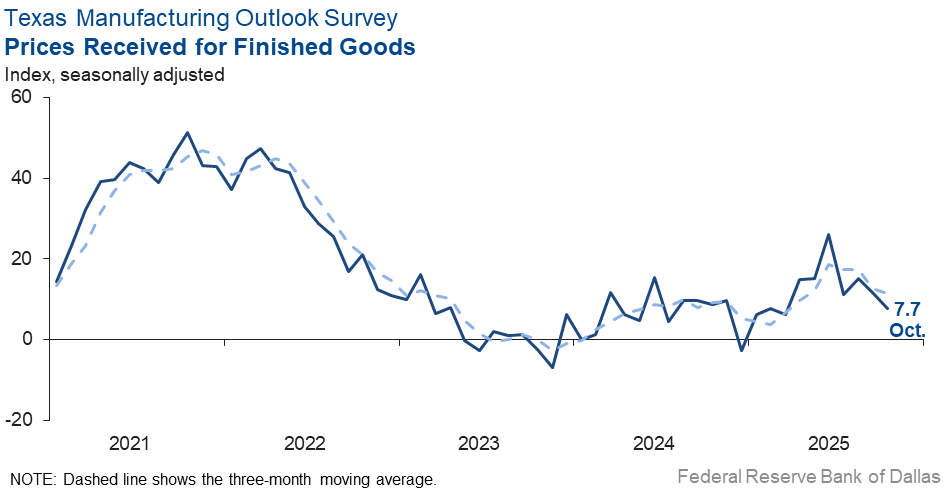
Price and wage pressures eased this month. The raw materials prices index fell ten points to 33.4. The finished goods prices index edged down to 7.7 from 11.7. The wages and benefits index fell two points to 14.2, below its average reading.
Expectations for manufacturing activity six months from now remained positive, though optimism waned. The future production index fell to 21.0 from 31.6, while the future general business activity index edged down to 7.0. Most other indexes of future manufacturing activity also moved down but remained positive, still indicating increased activity six months ahead.
Next release: Monday, November 24
Data were collected Oct. 14–22, and 73 of the 115 Texas manufacturers surveyed submitted responses. The Dallas Fed conducts the Texas Manufacturing Outlook Survey monthly to obtain a timely assessment of the state’s factory activity. Firms are asked whether output, employment, orders, prices and other indicators increased, decreased or remained unchanged over the previous month.
Survey responses are used to calculate an index for each indicator. Each index is calculated by subtracting the percentage of respondents reporting a decrease from the percentage reporting an increase. When the share of firms reporting an increase exceeds the share reporting a decrease, the index will be greater than zero, suggesting the indicator has increased over the prior month. If the share of firms reporting a decrease exceeds the share reporting an increase, the index will be below zero, suggesting the indicator has decreased over the prior month. An index will be zero when the number of firms reporting an increase is equal to the number of firms reporting a decrease. Data have been seasonally adjusted as necessary.
Results summary
Historical data are available from June 2004 to the most current release month.
| Business Indicators Relating to Facilities and Products in Texas Current (versus previous month) | ||||||||
| Indicator | Oct Index | Sep Index | Change | Series Average | Trend* | % Reporting Increase | % Reporting No Change | % Reporting Decrease |
Production | 5.2 | 5.2 | 0.0 | 9.6 | 8(+) | 24.0 | 57.2 | 18.8 |
Capacity Utilization | –1.1 | 3.9 | –5.0 | 7.4 | 1(–) | 16.8 | 65.3 | 17.9 |
New Orders | –1.7 | –2.6 | +0.9 | 4.7 | 2(–) | 24.7 | 48.9 | 26.4 |
Growth Rate of Orders | –3.7 | –6.4 | +2.7 | –1.1 | 2(–) | 18.5 | 59.3 | 22.2 |
Unfilled Orders | –6.4 | –8.4 | +2.0 | –2.6 | 14(–) | 10.8 | 72.0 | 17.2 |
Shipments | 5.8 | 6.7 | –0.9 | 7.8 | 4(+) | 29.7 | 46.5 | 23.9 |
Delivery Time | –7.2 | –8.2 | +1.0 | 0.5 | 2(–) | 6.6 | 79.6 | 13.8 |
Finished Goods Inventories | –11.0 | –9.7 | –1.3 | –3.2 | 2(–) | 12.3 | 64.4 | 23.3 |
Prices Paid for Raw Materials | 33.4 | 43.4 | –10.0 | 27.5 | 66(+) | 36.4 | 60.6 | 3.0 |
Prices Received for Finished Goods | 7.7 | 11.7 | –4.0 | 8.7 | 10(+) | 16.0 | 75.7 | 8.3 |
Wages and Benefits | 14.2 | 15.9 | –1.7 | 21.0 | 66(+) | 17.0 | 80.2 | 2.8 |
Employment | 2.0 | –3.4 | +5.4 | 7.2 | 1(+) | 17.7 | 66.6 | 15.7 |
Hours Worked | –5.5 | 3.4 | –8.9 | 3.0 | 1(–) | 13.8 | 66.9 | 19.3 |
Capital Expenditures | 4.8 | 13.3 | –8.5 | 6.6 | 6(+) | 14.6 | 75.6 | 9.8 |
| General Business Conditions Current (versus previous month) | ||||||||
| Indicator | Oct Index | Sep Index | Change | Series Average | Trend** | % Reporting Improved | % Reporting No Change | % Reporting Worsened |
Company Outlook | –0.3 | –1.0 | +0.7 | 4.2 | 2(–) | 17.0 | 65.7 | 17.3 |
General Business Activity | –5.0 | –8.7 | +3.7 | 0.3 | 3(–) | 18.4 | 58.2 | 23.4 |
| Indicator | Oct Index | Sep Index | Change | Series Average | Trend* | % Reporting Increase | % Reporting No Change | % Reporting Decrease |
Outlook Uncertainty | 22.2 | 13.9 | +8.3 | 17.2 | 54(+) | 33.3 | 55.6 | 11.1 |
| Business Indicators Relating to Facilities and Products in Texas Future (six months ahead) | ||||||||
| Indicator | Oct Index | Sep Index | Change | Series Average | Trend* | % Reporting Increase | % Reporting No Change | % Reporting Decrease |
Production | 21.0 | 31.6 | –10.6 | 36.1 | 66(+) | 38.6 | 43.8 | 17.6 |
Capacity Utilization | 17.5 | 23.8 | –6.3 | 32.9 | 66(+) | 33.3 | 50.9 | 15.8 |
New Orders | 18.3 | 34.3 | –16.0 | 33.5 | 36(+) | 39.0 | 40.3 | 20.7 |
Growth Rate of Orders | 8.2 | 32.7 | –24.5 | 24.8 | 29(+) | 29.0 | 50.2 | 20.8 |
Unfilled Orders | –8.9 | –0.8 | –8.1 | 2.7 | 2(–) | 11.8 | 67.5 | 20.7 |
Shipments | 18.5 | 30.0 | –11.5 | 34.4 | 66(+) | 36.4 | 45.7 | 17.9 |
Delivery Time | –1.4 | –0.8 | –0.6 | –1.4 | 8(–) | 9.5 | 79.6 | 10.9 |
Finished Goods Inventories | 3.1 | –10.3 | +13.4 | –0.3 | 1(+) | 16.7 | 69.7 | 13.6 |
Prices Paid for Raw Materials | 46.1 | 47.1 | –1.0 | 33.8 | 67(+) | 49.2 | 47.6 | 3.1 |
Prices Received for Finished Goods | 37.3 | 39.7 | –2.4 | 21.4 | 66(+) | 44.8 | 47.8 | 7.5 |
Wages and Benefits | 41.5 | 28.4 | +13.1 | 39.0 | 66(+) | 43.4 | 54.7 | 1.9 |
Employment | 18.9 | 12.7 | +6.2 | 22.7 | 65(+) | 30.6 | 57.7 | 11.7 |
Hours Worked | 7.2 | 3.2 | +4.0 | 8.7 | 4(+) | 14.0 | 79.2 | 6.8 |
Capital Expenditures | 26.8 | 12.5 | +14.3 | 19.4 | 65(+) | 33.0 | 60.8 | 6.2 |
| General Business Conditions Future (six months ahead) | ||||||||
| Indicator | Oct Index | Sep Index | Change | Series Average | Trend** | % Reporting Increase | % Reporting No Change | % Reporting Worsened |
Company Outlook | 7.1 | 11.7 | –4.6 | 18.2 | 6(+) | 26.2 | 54.7 | 19.1 |
General Business Activity | 7.0 | 8.4 | –1.4 | 12.3 | 6(+) | 25.9 | 55.2 | 18.9 |
*Shown is the number of consecutive months of expansion or contraction in the underlying indicator. Expansion is indicated by a positive index reading and denoted by a (+) in the table. Contraction is indicated by a negative index reading and denoted by a (–) in the table.
**Shown is the number of consecutive months of improvement or worsening in the underlying indicator. Improvement is indicated by a positive index reading and denoted by a (+) in the table. Worsening is indicated by a negative index reading and denoted by a (–) in the table.
Data have been seasonally adjusted as necessary.
Comments from survey respondents
Survey participants are given the opportunity to submit comments on current issues that may be affecting their businesses. Some comments have been edited for grammar and clarity.
- Overall uncertainty about the strength of the economy is our largest concern. We believe the risk of a recession has increased, although it is hard to quantify. Lower economic opportunities, especially for younger people, is putting downward pressure on our future sales.
- We are considering closing our company at the end of the year and filing for bankruptcy. We have had a huge drop in sales, and I think it's due to the loss of government funding. I don't think I can recover the company from it.
- Our sales outlook is slightly down for 2026.
- Customers are delaying projects to 2026, and requests for quotes have decreased.
- Our customers want to buy, but they lack cash on hand. Multiple competitor closures are funneling demand, but our customers lack liquidity to fund required deposits and interim payments.
- There’s a slowdown of commercial construction bid requests.
- Sales have been strong and steady over the past few months. We hope this trend continues.
- The free market is prevailing despite the central planners' well-intentioned but misguided tariff policies.
- Up and down, back and forth. We are thankful for the work, but the waves continue.
- We expect some gain as well as some loss going forward in 2026 and through the remainder of the current year. We do believe the good will outweigh the bad overall. The DFW area continues to thrive, Texas remains a good place to do business, and the U.S. remains favorable for business as opposed to many world markets. We're thankful we are where we are─geographically and economically.
- Tariffs. We manufacture in the U.S., but input materials come from China. We don't have $600 million to get relief from tariffs like some companies do.
- Business is steady at very slow; no uptick in sight at this time.
- We suspect other countries, including Mexico, Vietnam and Cambodia are cheating and not paying full Section 232 tariffs on aluminum-extruded products coming into the U.S. This has been reported to the Commerce Department. They are producing two invoices, one for the raw aluminum and another for the other portions of their prices resulting in not paying the full Section 232. If this is allowed to continue our industry will lose jobs and shutter equipment. Most of the foreign countries are subsidizing exports to the U.S. to the detriment of our industry.
- We have gotten very slow and we worry about the general state of our industry. We have a few large jobs that are keeping people busy in the plant, but soon if things don't change there will need to be some significant reduction in hours worked on the plant floor. There is just not much going on right now, and we believe it’s all tied to the chaos and uncertainty coming from Washington. We are hearing about significant price increases on materials coming soon due to the effect of tariffs.
- Tariff costs (a tax) are having an impact of slowing down economic activity in all sectors. It’s all to do with economic uncertainty.
- We are very unsure of how the holiday season will play out. Input prices continue to increase as duties and tariffs take effect and remain in place. We are unsure of demand, and we will also need to increase our prices due to rising costs.
- The interest rate reduction is positive. There’s a need to improve the government shutdown and trade turmoil, and the outlook would be very promising.
- Continued volatility with import tariffs and interest rates continue to stifle the trucking market. Trucking companies continue to struggle, and there is a regular cadence of bankruptcies being reported.
- Business is up, yet we are also affected by the government shutdown in our ability to work with regulators to approve next steps.
Historical Data
Historical data can be downloaded dating back to June 2004.
Indexes
Download indexes for all indicators. For the definitions of all variables, see Data Definitions.
| Unadjusted |
| Seasonally adjusted |
All Data
Download indexes and components of the indexes (percentage of respondents reporting increase, decrease, or no change). For the definitions of all variables, see Data Definitions.
| Unadjusted |
| Seasonally adjusted |
Special questions
For this month’s survey, Texas business executives were asked supplemental questions on credit conditions. Results below include responses from participants of all three surveys: Texas Manufacturing Outlook Survey, Texas Service Sector Outlook Survey and Texas Retail Outlook Survey. View individual survey results.
Questions regarding the Texas Business Outlook Surveys can be addressed to Jesus Cañas.
Sign up for our email alert to be automatically notified as soon as the latest Texas Manufacturing Outlook Survey is released on the web.