Texas Manufacturing Outlook Survey

Growth resumes in Texas manufacturing
This month’s data release includes annual seasonal factor revisions. Once per year, the Federal Reserve Bank of Dallas revises the historical data for the Texas Manufacturing Outlook Survey after calculating new seasonal adjustment factors. Annual seasonal revisions result in slight changes in the seasonally adjusted series. Read more information on seasonal adjustment.
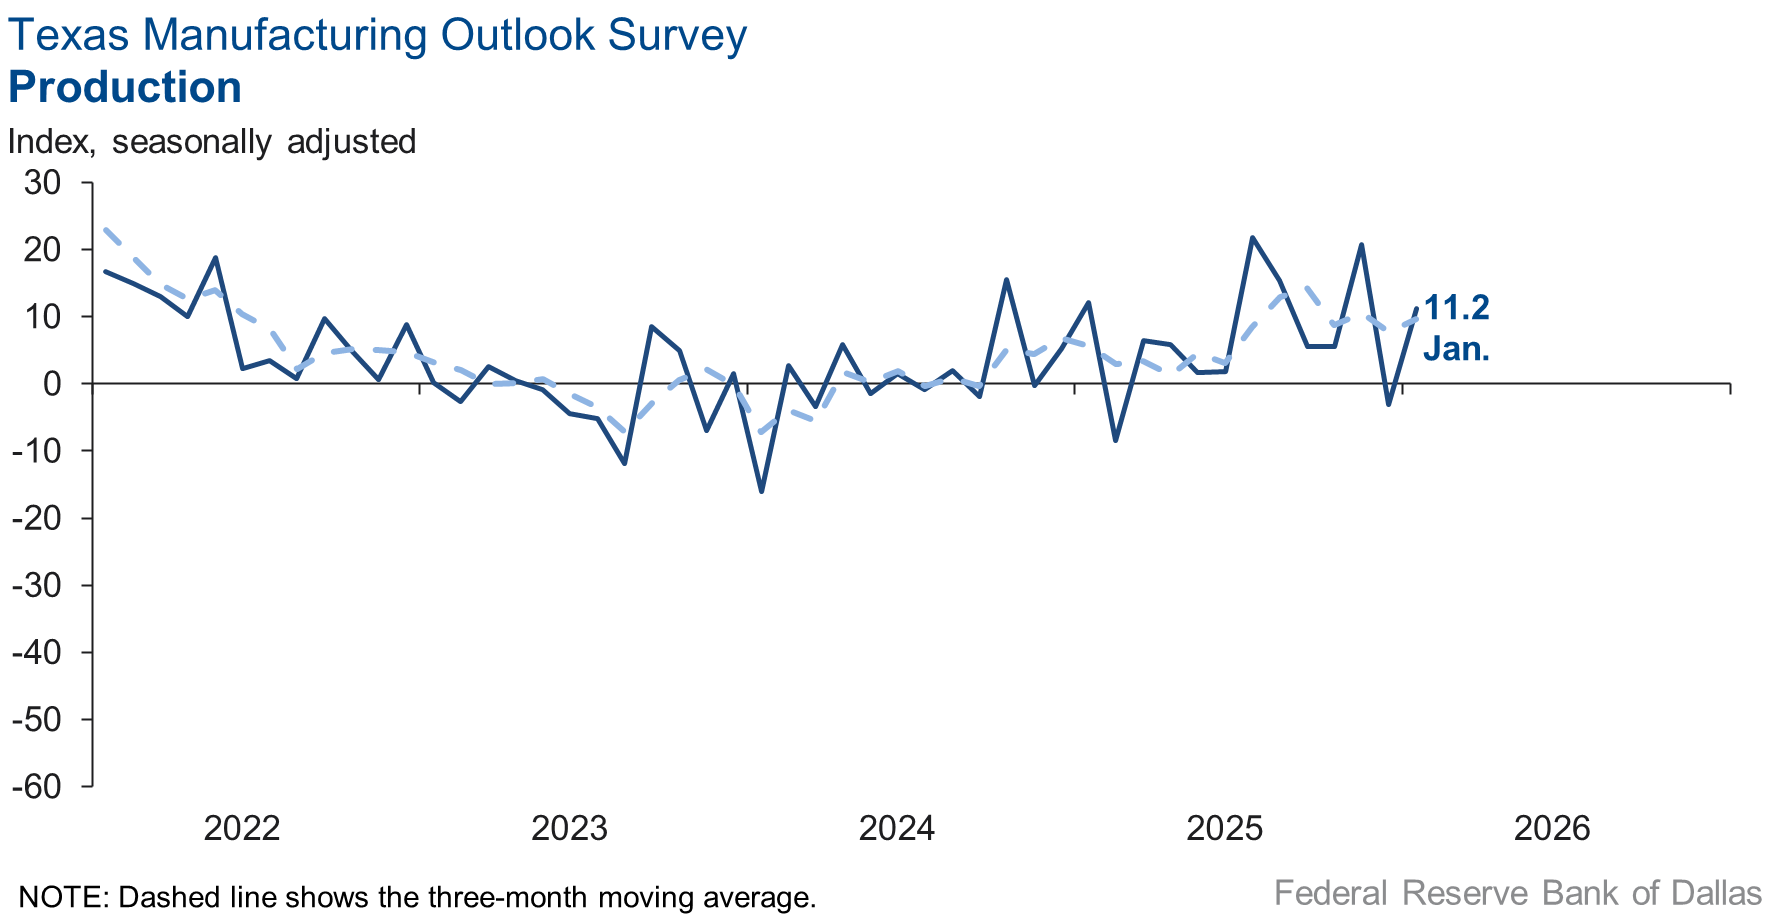
Texas factory activity expanded solidly in January after contracting in December, according to business executives responding to the Texas Manufacturing Outlook Survey. The production index, a key measure of state manufacturing conditions, jumped to 11.2 from -3.0, a reading suggestive of an above-average pace of output expansion.
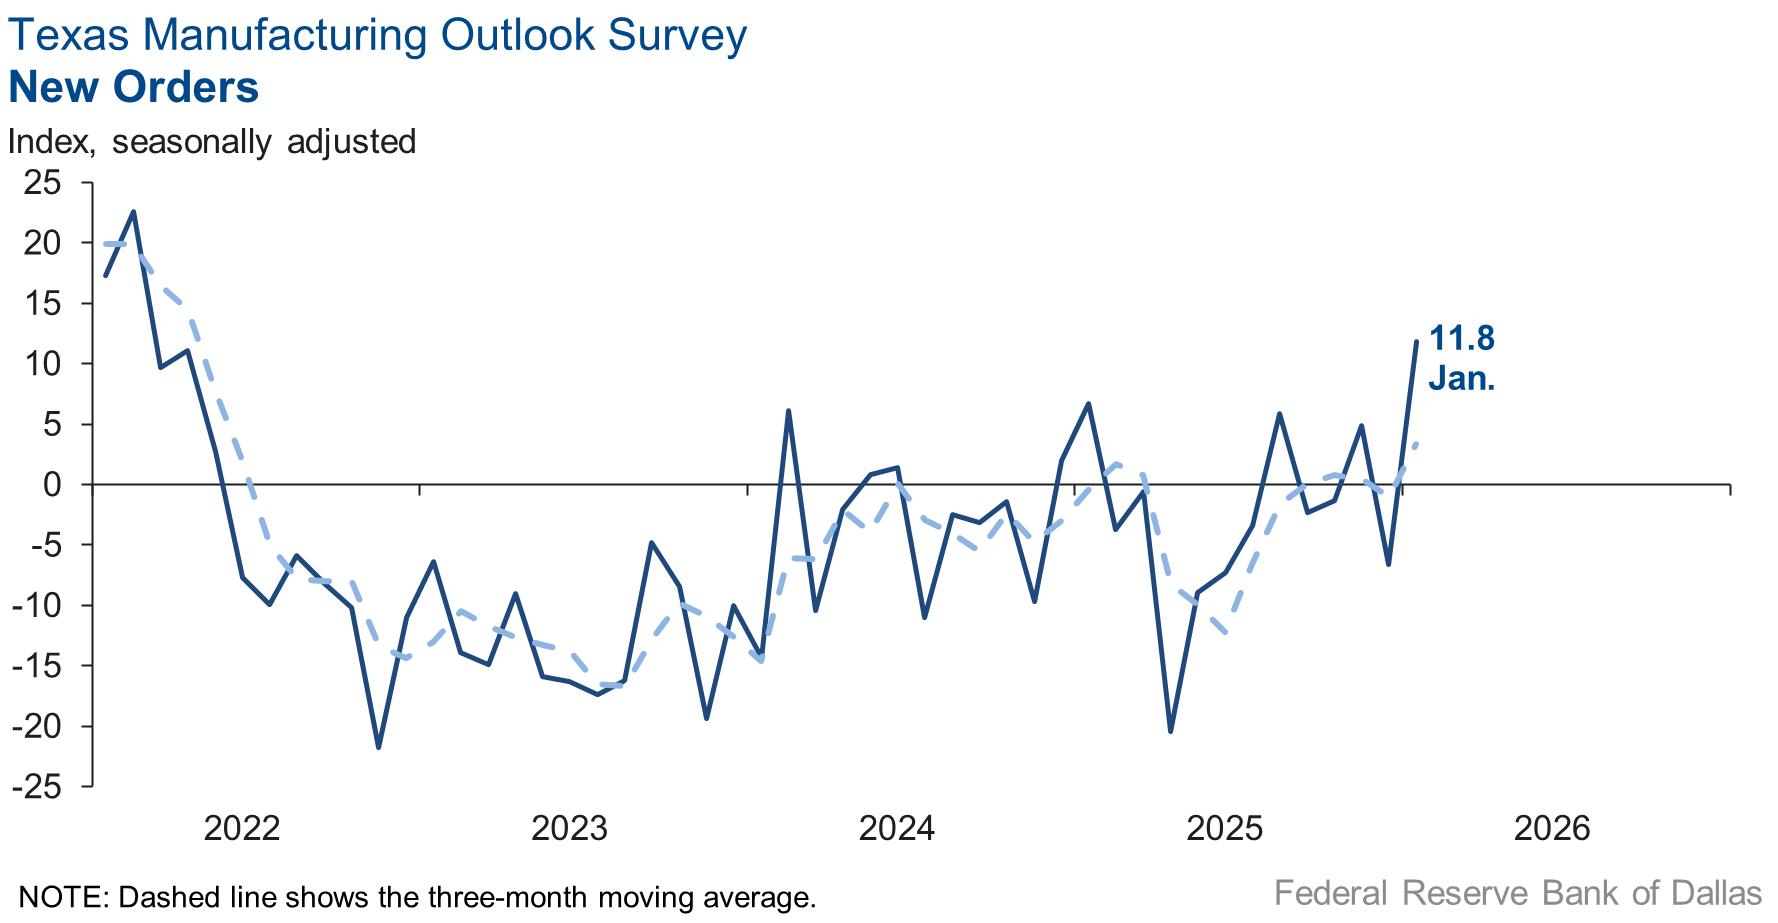
Other measures of manufacturing activity also rebounded this month. The new orders index increased 18 points to 11.8, and the capacity utilization index moved up 12 points to 7.1. The shipments index increased to 12.0 from -10.5.
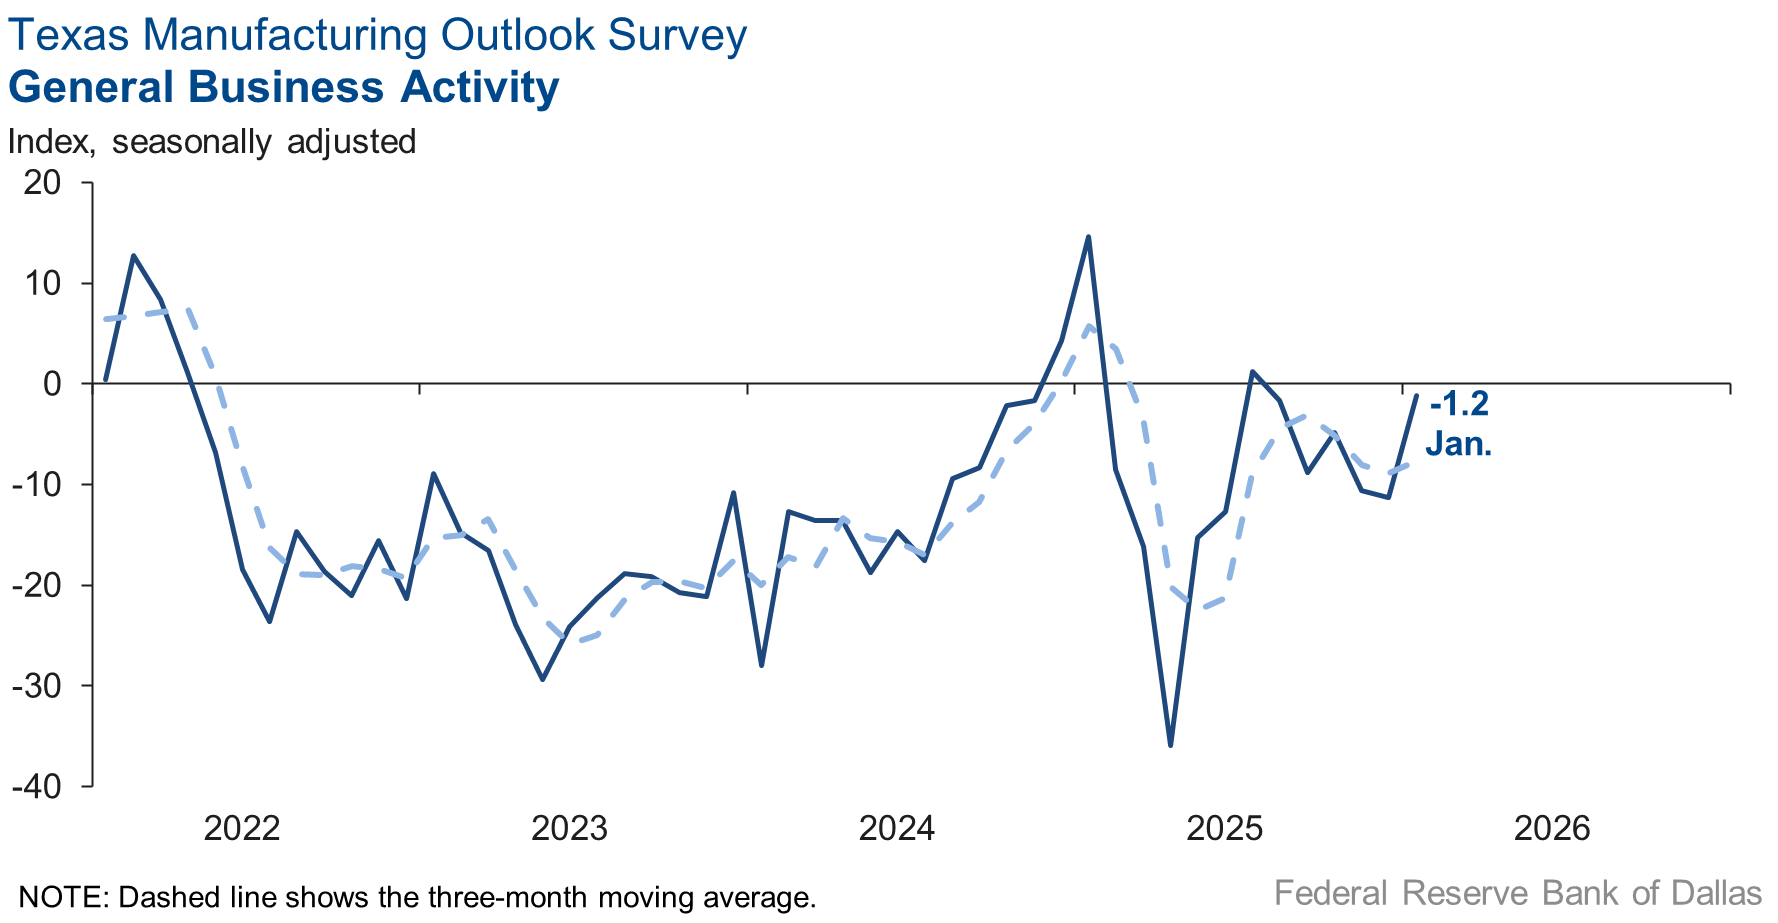
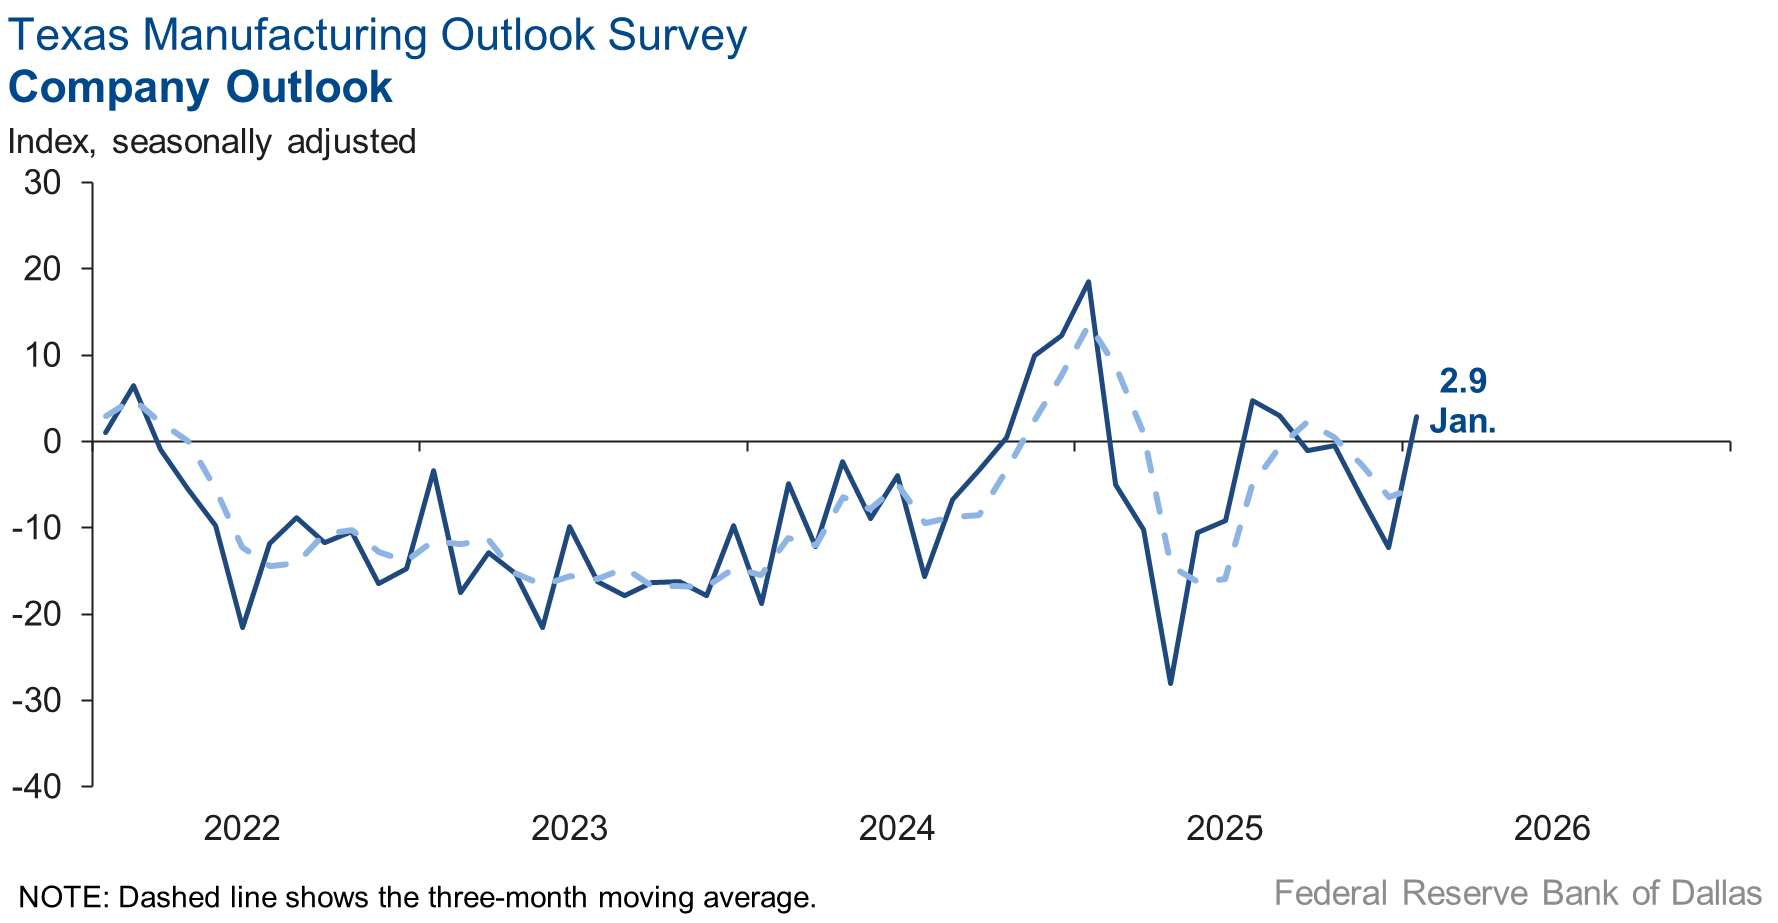
Perceptions of broader business conditions stabilized in January. The general business activity index increased 10 points to -1.2, with the near-zero reading indicating no change in activity from December. The company outlook index rebounded into positive territory, coming in at 2.9, up from -12.3, with the low January reading signaling a slight improvement in company outlooks. The outlook uncertainty index increased to 4.8 but remained well below its average reading.
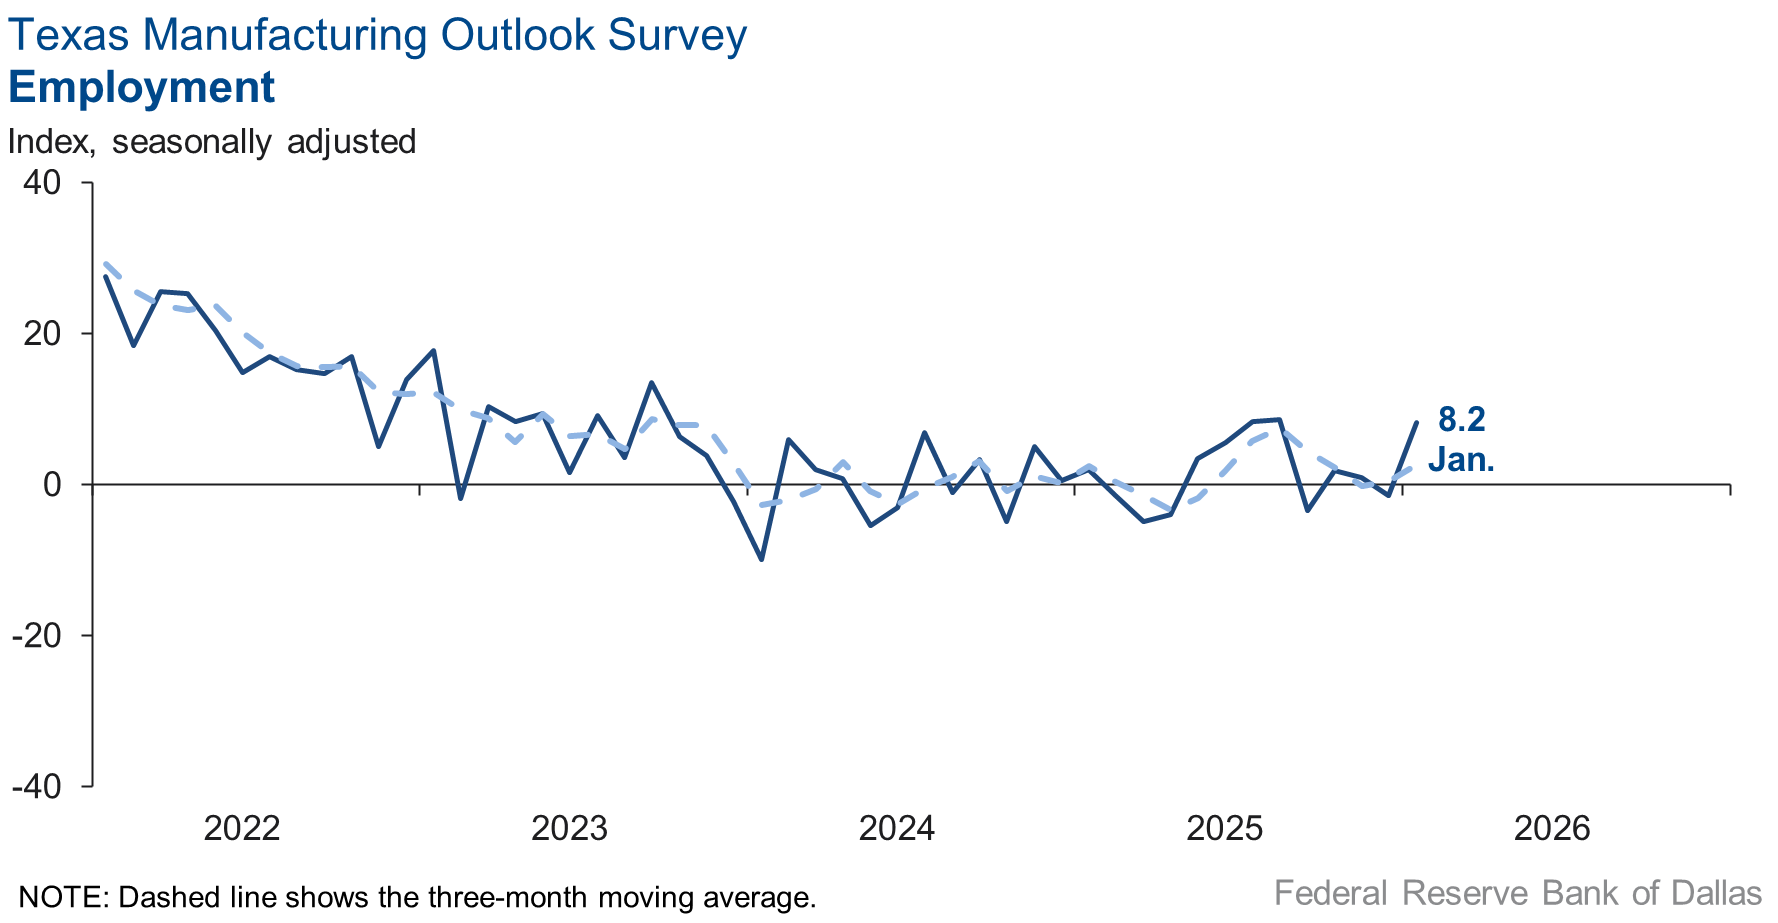
Employment growth resumed in January, while work hours were flat. The employment index increased 10 points to 8.2. The hours worked index moved up to 0.7 from -7.8, with the near-zero reading indicating no change this month.
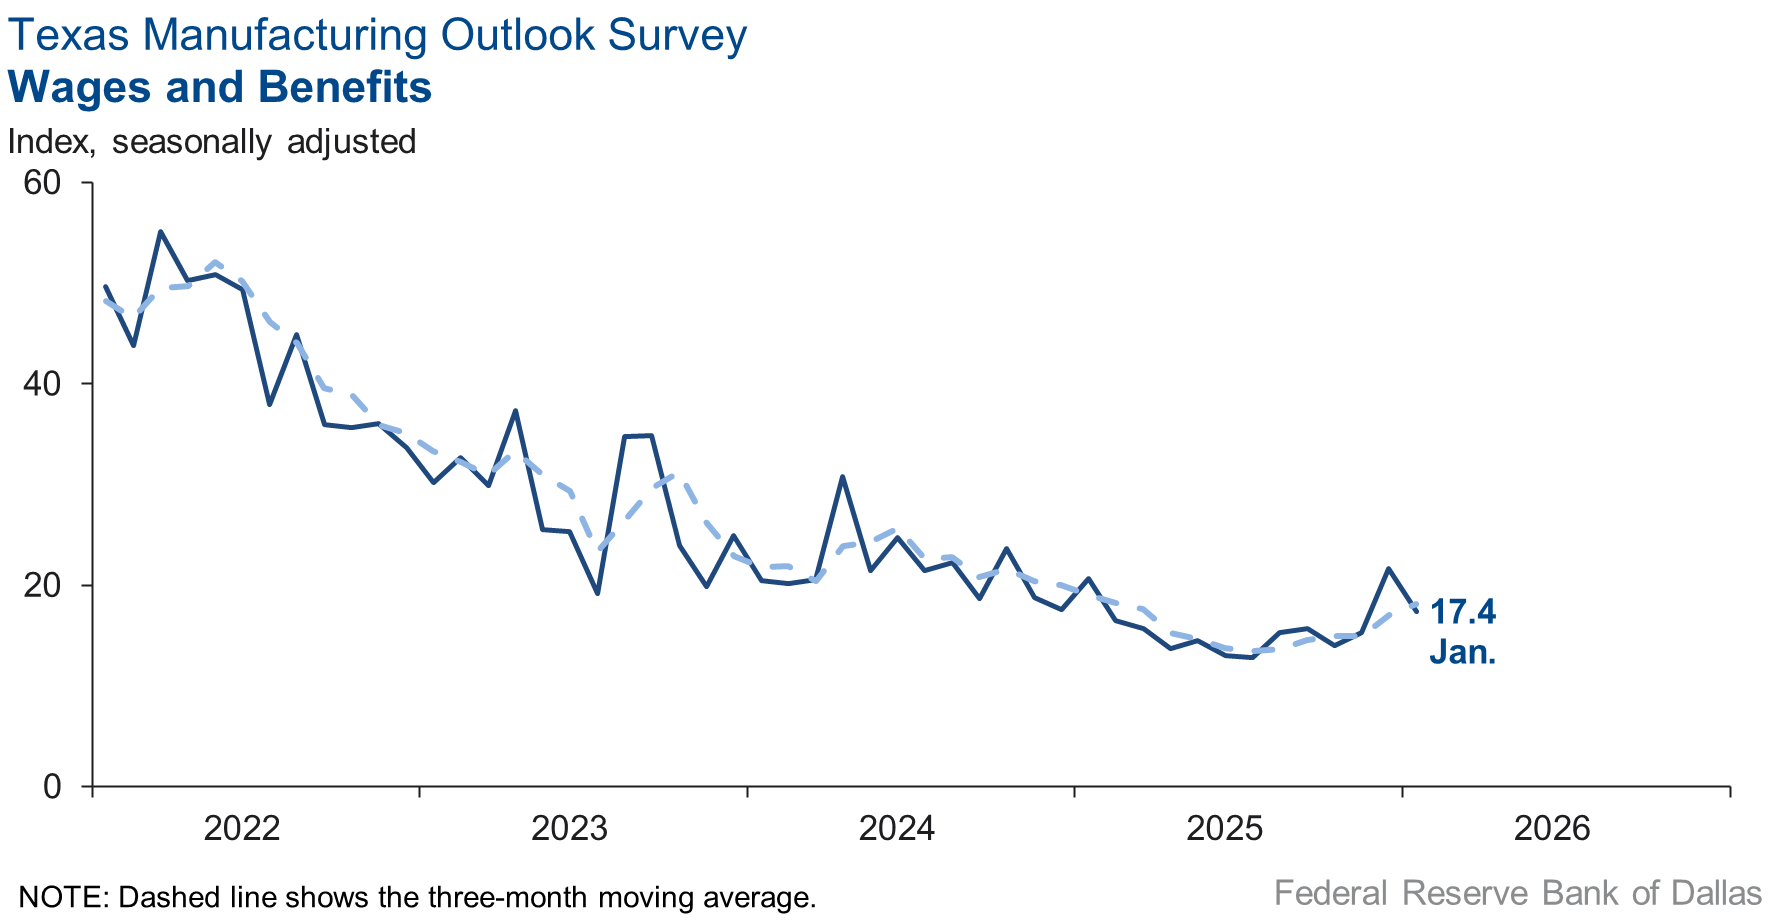
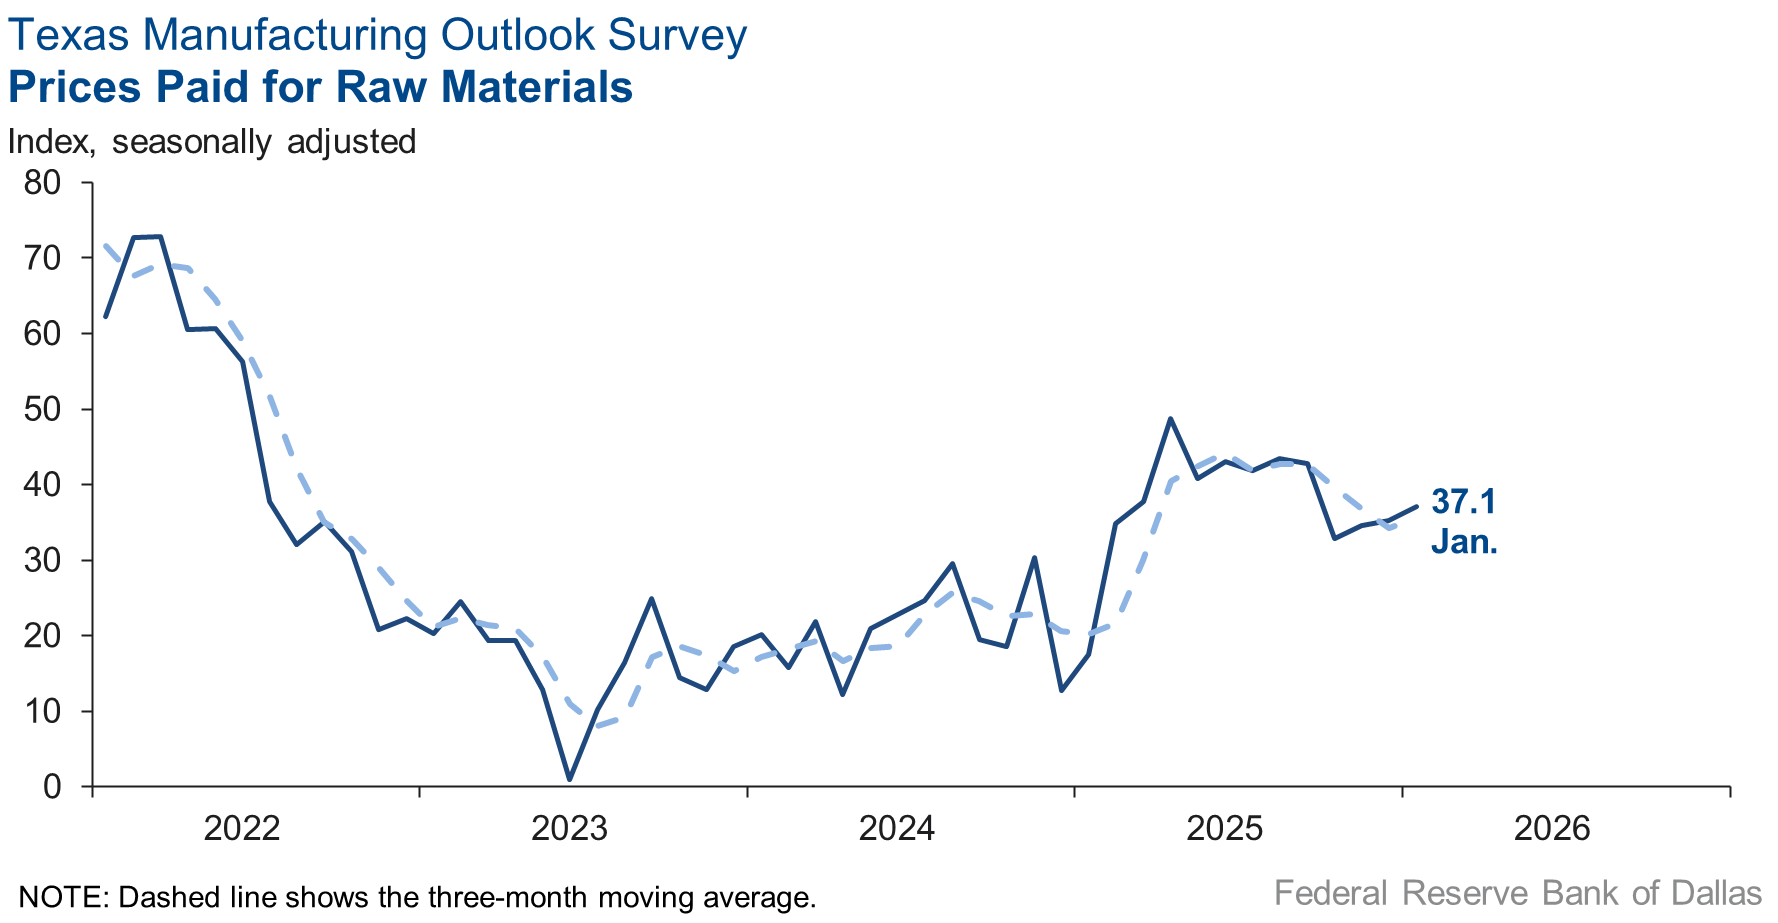
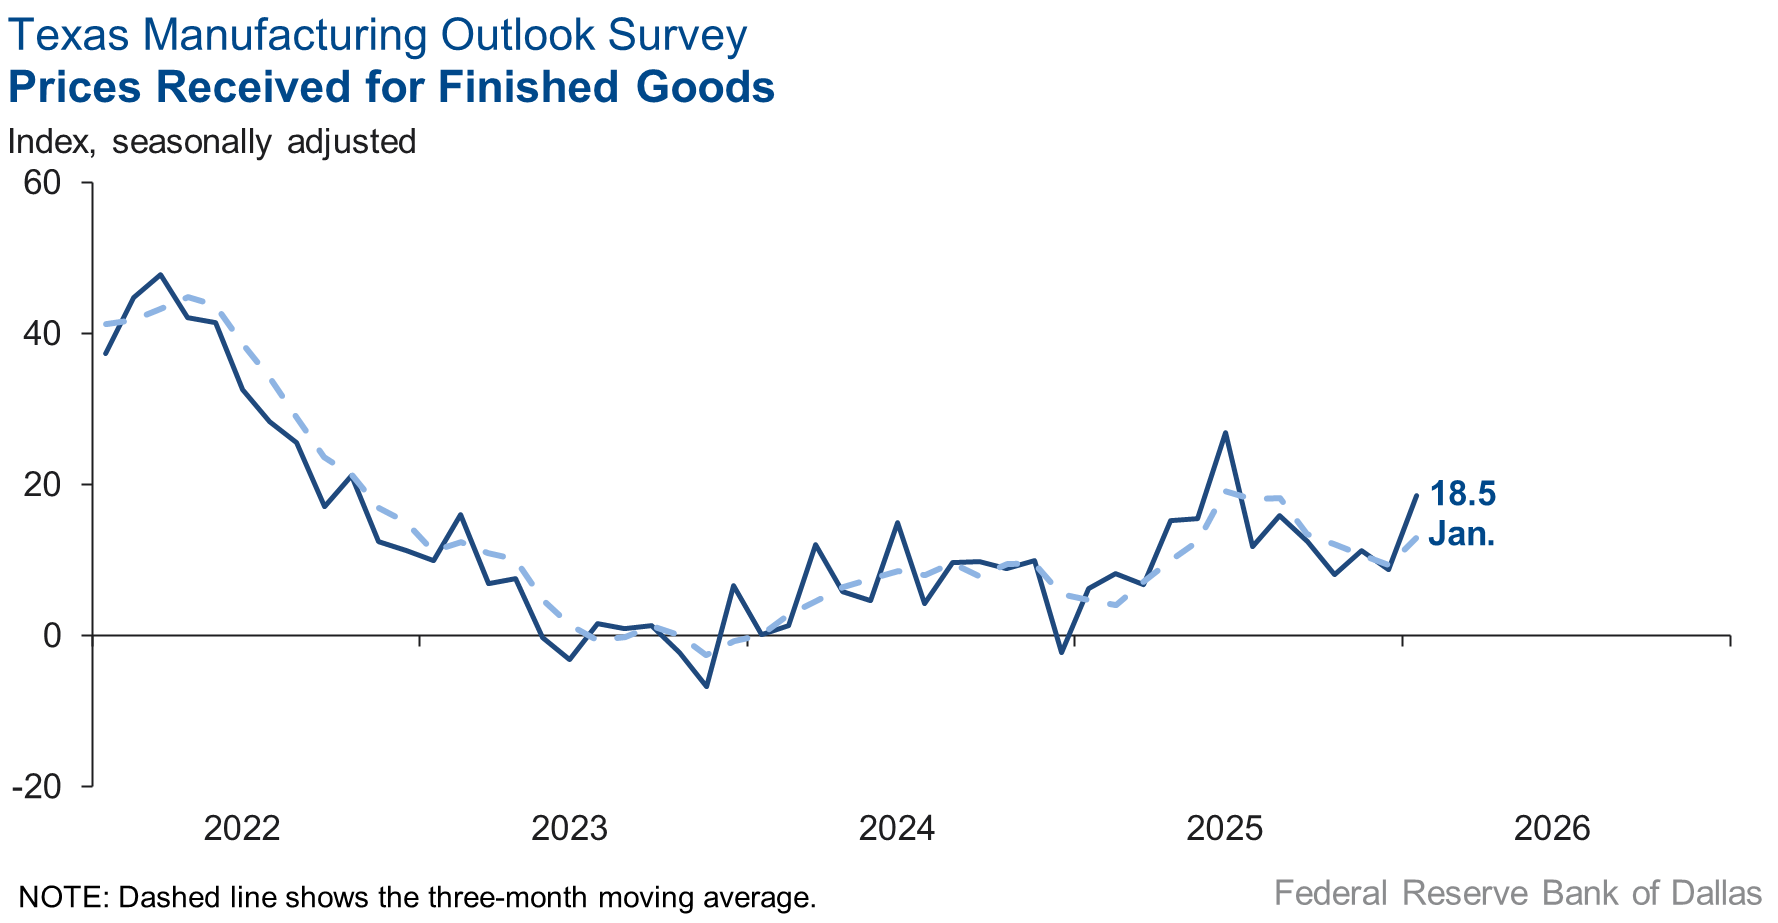
Selling price pressures increased, while input price pressures were little changed and wage growth slowed slightly. The finished goods prices index rose 10 points to 18.5. The raw materials prices index was largely unchanged at 37.1, and the wages and benefits index fell four points to 17.4.
Expectations are for increased manufacturing activity six months from now. The future production index was largely unchanged at 29.2, and the future general business activity index increased six points to 16.6. Other indexes of future manufacturing activity showed mixed movements but remained in positive territory, indicating increased activity six months ahead.
Next release: Monday, February 23
Data were collected Jan. 13–21, and 82 of the 116 Texas manufacturers surveyed submitted responses. The Dallas Fed conducts the Texas Manufacturing Outlook Survey monthly to obtain a timely assessment of the state’s factory activity. Firms are asked whether output, employment, orders, prices and other indicators increased, decreased or remained unchanged over the previous month.
Survey responses are used to calculate an index for each indicator. Each index is calculated by subtracting the percentage of respondents reporting a decrease from the percentage reporting an increase. When the share of firms reporting an increase exceeds the share reporting a decrease, the index will be greater than zero, suggesting the indicator has increased over the prior month. If the share of firms reporting a decrease exceeds the share reporting an increase, the index will be below zero, suggesting the indicator has decreased over the prior month. An index will be zero when the number of firms reporting an increase is equal to the number of firms reporting a decrease. Data have been seasonally adjusted as necessary.
Results summary
Historical data are available from June 2004 to the most current release month.
| Business Indicators Relating to Facilities and Products in Texas Current (versus previous month) | ||||||||
| Indicator | Jan Index | Dec Index | Change | Series Average | Trend* | % Reporting Increase | % Reporting No Change | % Reporting Decrease |
Production | 11.2 | –3.0 | +14.2 | 9.6 | 1(+) | 29.7 | 51.8 | 18.5 |
Capacity Utilization | 7.1 | –4.6 | +11.7 | 7.4 | 1(+) | 25.5 | 56.0 | 18.4 |
New Orders | 11.8 | –6.6 | +18.4 | 4.6 | 1(+) | 31.1 | 49.6 | 19.3 |
Growth Rate of Orders | –6.7 | –16.9 | +10.2 | –1.2 | 5(–) | 18.0 | 57.3 | 24.7 |
Unfilled Orders | –6.1 | –13.4 | +7.3 | –2.7 | 17(–) | 8.9 | 76.1 | 15.0 |
Shipments | 12.0 | –10.5 | +22.5 | 7.8 | 1(+) | 28.4 | 55.2 | 16.4 |
Delivery Time | –2.7 | 4.0 | –6.7 | 0.5 | 1(–) | 7.8 | 81.7 | 10.5 |
Finished Goods Inventories | –12.2 | –13.5 | +1.3 | –3.3 | 5(–) | 12.2 | 63.4 | 24.4 |
Prices Paid for Raw Materials | 37.1 | 35.2 | +1.9 | 27.6 | 69(+) | 41.7 | 53.7 | 4.6 |
Prices Received for Finished Goods | 18.5 | 8.8 | +9.7 | 8.8 | 13(+) | 23.9 | 70.7 | 5.4 |
Wages and Benefits | 17.4 | 21.7 | –4.3 | 20.9 | 69(+) | 18.5 | 80.3 | 1.1 |
Employment | 8.2 | –1.4 | +9.6 | 7.1 | 1(+) | 21.5 | 65.2 | 13.3 |
Hours Worked | 0.7 | –7.8 | +8.5 | 3.0 | 1(+) | 18.0 | 64.6 | 17.3 |
Capital Expenditures | 8.2 | 8.4 | –0.2 | 6.7 | 9(+) | 17.3 | 73.5 | 9.1 |
| General Business Conditions Current (versus previous month) | ||||||||
| Indicator | Jan Index | Dec Index | Change | Series Average | Trend** | % Reporting Improved | % Reporting No Change | % Reporting Worsened |
Company Outlook | 2.9 | –12.3 | +15.2 | 4.1 | 1(+) | 17.8 | 67.3 | 14.9 |
General Business Activity | –1.2 | –11.3 | +10.1 | 0.2 | 6(–) | 21.1 | 56.6 | 22.3 |
| Indicator | Jan Index | Dec Index | Change | Series Average | Trend* | % Reporting Increase | % Reporting No Change | % Reporting Decrease |
Outlook Uncertainty | 4.8 | 0.0 | +4.8 | 16.9 | 1(+) | 20.7 | 63.4 | 15.9 |
| Business Indicators Relating to Facilities and Products in Texas Future (six months ahead) | ||||||||
| Indicator | Jan Index | Dec Index | Change | Series Average | Trend* | % Reporting Increase | % Reporting No Change | % Reporting Decrease |
Production | 29.2 | 32.9 | –3.7 | 36.0 | 69(+) | 39.0 | 51.2 | 9.8 |
Capacity Utilization | 25.1 | 28.0 | –2.9 | 32.8 | 69(+) | 36.5 | 52.1 | 11.4 |
New Orders | 32.0 | 29.6 | +2.4 | 33.5 | 39(+) | 42.2 | 47.6 | 10.2 |
Growth Rate of Orders | 24.9 | 24.1 | +0.8 | 24.7 | 29(+) | 35.8 | 53.3 | 10.9 |
Unfilled Orders | 0.6 | 1.7 | –1.1 | 2.7 | 2(+) | 9.0 | 82.6 | 8.4 |
Shipments | 28.4 | 33.2 | –4.8 | 34.3 | 69(+) | 40.3 | 47.8 | 11.9 |
Delivery Time | 3.2 | 5.2 | –2.0 | –1.3 | 2(+) | 9.7 | 83.7 | 6.5 |
Finished Goods Inventories | 11.7 | 4.2 | +7.5 | –0.2 | 2(+) | 20.8 | 70.1 | 9.1 |
Prices Paid for Raw Materials | 35.9 | 36.1 | –0.2 | 33.9 | 70(+) | 41.2 | 53.5 | 5.3 |
Prices Received for Finished Goods | 37.7 | 31.9 | +5.8 | 21.5 | 69(+) | 41.6 | 54.5 | 3.9 |
Wages and Benefits | 32.0 | 41.3 | –9.3 | 39.0 | 260(+) | 34.5 | 63.0 | 2.5 |
Employment | 18.1 | 21.1 | –3.0 | 22.7 | 68(+) | 30.8 | 56.5 | 12.7 |
Hours Worked | –1.3 | 3.0 | –4.3 | 8.6 | 1(–) | 8.2 | 82.3 | 9.5 |
Capital Expenditures | 22.0 | 17.8 | +4.2 | 19.4 | 68(+) | 35.1 | 51.7 | 13.1 |
| General Business Conditions Future (six months ahead) | ||||||||
| Indicator | Jan Index | Dec Index | Change | Series Average | Trend** | % Reporting Increase | % Reporting No Change | % Reporting Worsened |
Company Outlook | 23.2 | 16.9 | +6.3 | 18.2 | 9(+) | 32.6 | 58.0 | 9.4 |
General Business Activity | 16.6 | 11.1 | +5.5 | 12.3 | 9(+) | 28.2 | 60.2 | 11.6 |
*Shown is the number of consecutive months of expansion or contraction in the underlying indicator. Expansion is indicated by a positive index reading and denoted by a (+) in the table. Contraction is indicated by a negative index reading and denoted by a (–) in the table.
**Shown is the number of consecutive months of improvement or worsening in the underlying indicator. Improvement is indicated by a positive index reading and denoted by a (+) in the table. Worsening is indicated by a negative index reading and denoted by a (–) in the table.
Data have been seasonally adjusted as necessary.
Comments from survey respondents
Survey participants are given the opportunity to submit comments on current issues that may be affecting their businesses. Some comments have been edited for grammar and clarity.
- We continue to see a lot of uncertainty in the market. The economy seems to be doing well, although the job market is tough if you are looking for a job. We have seen our employee retention slowly increase, most likely because of the poor job market. With the invasion of Venezuela, random threats against other countries, potential to blow up NATO between Greenland and Ukraine, there is general unease about where the economy will be in a year.
- End markets are still highly uncertain in durable goods, building and construction, and automotive. As interest rates continue to fall, we are hopeful for increasing activity. China's economic policies and influence on the global market are still driving significant uncertainty for large exporters from the U.S.
- There seems to be a reluctance to initiate any substantial new work projects.
- We saw recent uptick in orders for the first half of 2026. The full-year volume is still expected to be relatively flat vs. 2025.
- On top of previous challenges, some customers have gone out of business. Others are struggling with cash flow and are demanding or taking longer terms to pay their orders. This has strained our cash flow.
- It was a slow fall, but business seems to be picking up, and we have a few new accounts commencing in first quarter 2026.
- The growing stigma related to doing business with nonprofit organizations, the general political climate and diminished funding for our customers to buy threaten our business.
- We’ve seen a definite reduction in corporate headquarters work and commercial office buildings. Hospitality has slowed, and we’ve seen increases in health care and data center work.
- Let the market pick winners and losers.
- December sales ended stronger than usual, and this trend has continued in January resulting in optimism for 2026.
- Business is booming and for that we are pleased. We are buying new equipment to increase production, since we are falling behind on our inventory requirements, and sales have increased significantly.
- The economy is booming. Markets are at new highs. Inflation is contained. Tariffs are working. Our expansion efforts into new markets have been effective. We are pleased to say that for the first time in a very long time our crystal ball is indicating extremely encouraging times for our operation in 2026.
- Our increase in sales volumes is attributable to new business we landed, not higher volumes from existing customers. High metals prices (copper and aluminum) make it difficult to pass costs to customers. Wildly swinging tariff threats and tariffs, ICE acting illegally and brutally and the unchecked authority and aggressive behavior from the executive branch continue to increase uncertainty and volatility. We have no capital expenditures planned in 2026 due to uncertainty and volatility.
- There are indicators that new home construction will increase in the second half of the year, which will increase demand for our products.
- The only thing certain is the uncertainty. It is very hard to plan. We have stopped all capital expenditures and expansion plans.
- Looks like we are starting off 2026 with more of the same slowness. Optimism is falling.
- We continue to be negatively impacted by widespread circumvention of Section 232 tariffs. Foreign producers are exploiting the customs process by submitting two invoices: one reflecting only a partial value of the raw aluminum and a second invoice covering the remaining value of the finished aluminum extrusions. This practice significantly understates the true import value and enables product to enter the U.S. market at prices below domestic levels. In addition, our industry is being severely harmed by finished goods and parts entering the United States under Harmonized Tariff Schedule 7600 classifications at prices below domestic production costs, effectively bypassing the intent of the tariffs. We also have credible reports that Chinese aluminum extrusions continue to be transshipped through Vietnam, Cambodia, Malaysia and Mexico before entering the U.S. market, further undermining fair trade and enforcement efforts.
- Demand continues slow for reasons we cannot figure out. It's as if our customers just don't need us right now. We know we will be busier in six months because of a large job we typically get and work on during the summer; however, without those kinds of jobs our everyday work just keeps getting smaller and smaller. I still think a lot has to do with the chaos coming out of Washington.
- Our busiest time (in terms of production, orders and capacity utilization) is in fourth quarter, December and November, so January is down from last month but up about 50 percent from last January. We are seeing strong order volume and input and raw material prices are steady (no increases). We are feeling much better about business in January and first quarter 2026 relative to how we felt in January 2025. We are still unsure how the market and demand will be six months from now and not sure if this is a temporary positive bump.
- Trucking segment indicators appear to be improving, driving up new orders. We have concern pertaining to raw material costs increasing such as copper. We remain cautious of the recovery.
- We are expecting improved sales, but if that’s not realized in six months, we will scale back everything.
Historical Data
Historical data can be downloaded dating back to June 2004.
Indexes
Download indexes for all indicators. For the definitions of all variables, see Data Definitions.
| Unadjusted |
| Seasonally adjusted |
All Data
Download indexes and components of the indexes (percentage of respondents reporting increase, decrease, or no change). For the definitions of all variables, see Data Definitions.
| Unadjusted |
| Seasonally adjusted |
Special questions
For this month’s survey, Texas business executives were asked supplemental questions on labor market conditions and capital expenditures. Results below include responses from participants from both the Texas Manufacturing Outlook Survey and Texas Service Sector Outlook Survey. View individual survey results.
Questions regarding the Texas Business Outlook Surveys can be addressed to Jesus Cañas.
Sign up for our email alert to be automatically notified as soon as the latest Texas Manufacturing Outlook Survey is released on the web.