
Texas Service Sector Outlook Survey
Growth in Texas service sector activity continues
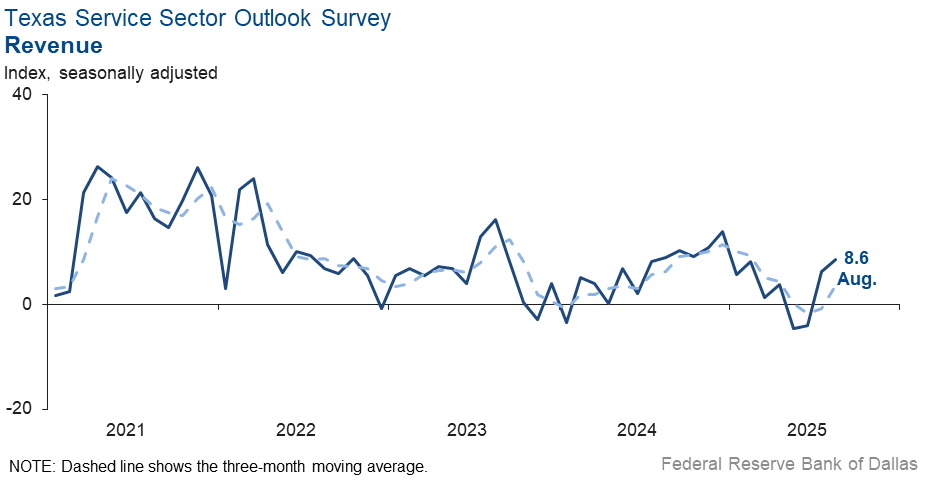
Texas service sector activity expanded at a slightly faster pace in August, according to business executives responding to the Texas Service Sector Outlook Survey. The revenue index, a key measure of state service sector conditions, increased to 8.6 in August from 6.3 last month.
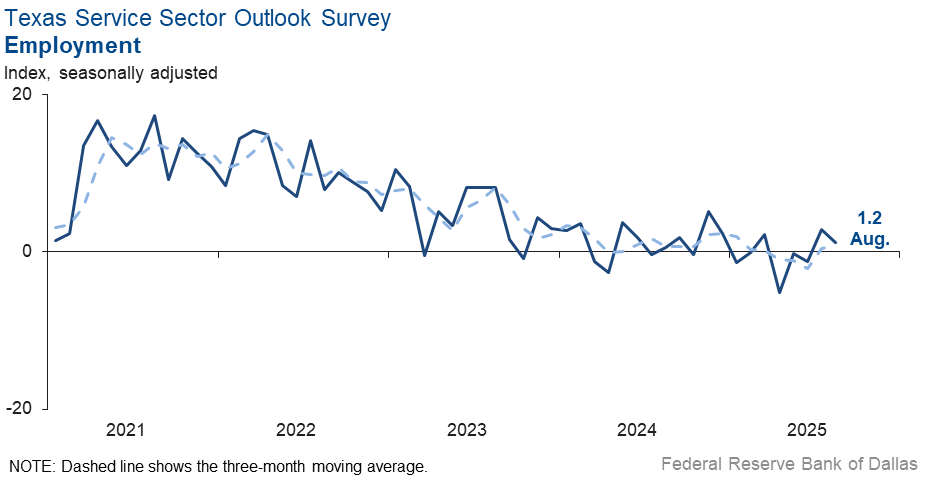
Labor market measures indicated flat employment and a modest increase in hours worked in August. The employment index edged down to 1.2 from 2.8 in July. The near-zero reading signals little change in employment over the period. The part-time employment index edged up to -2.7 from -3.8, while the hours worked index increased two points to 5.1.
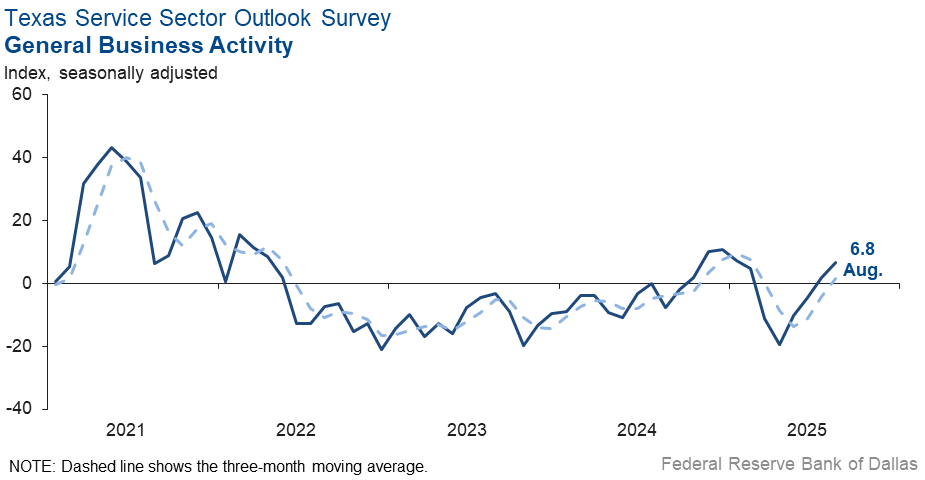
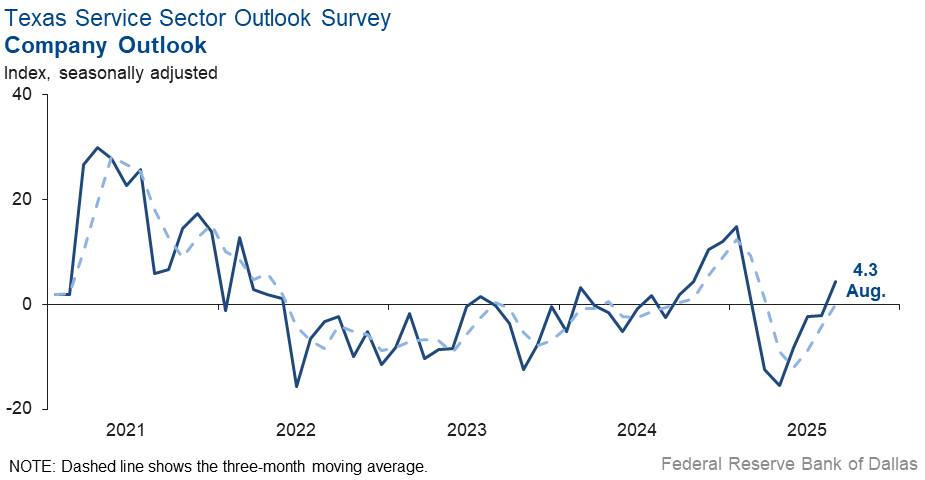
Perceptions of broader business conditions improved in August. The general business activity index increased five points to 6.8, and the company outlook index rose six points to 4.3, its first positive reading in six months. The outlook uncertainty index fell two points to 11.2.
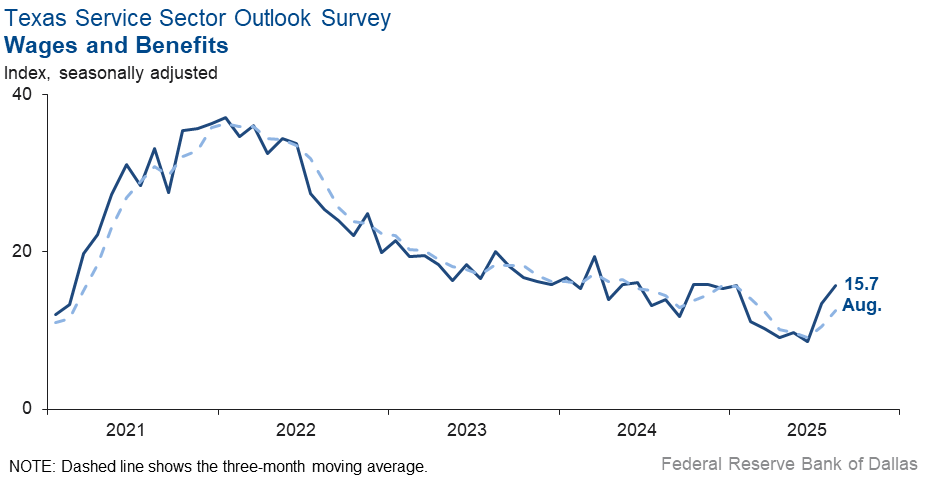
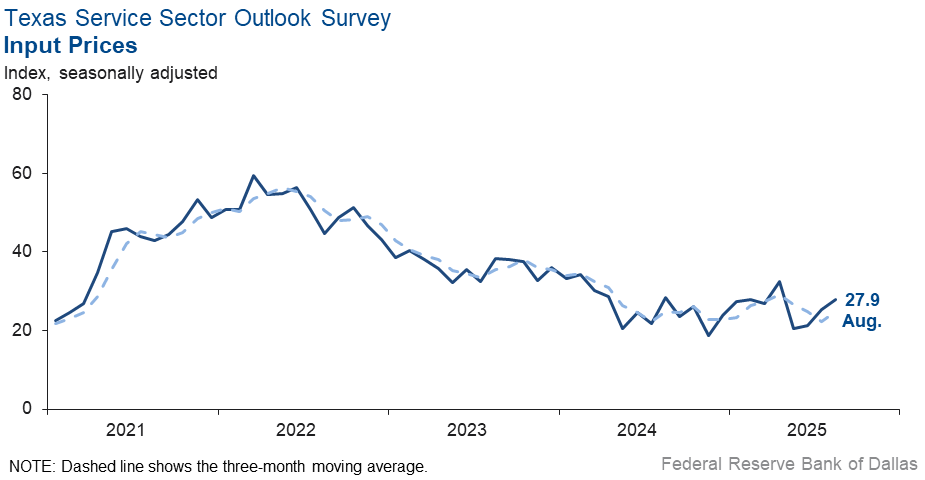
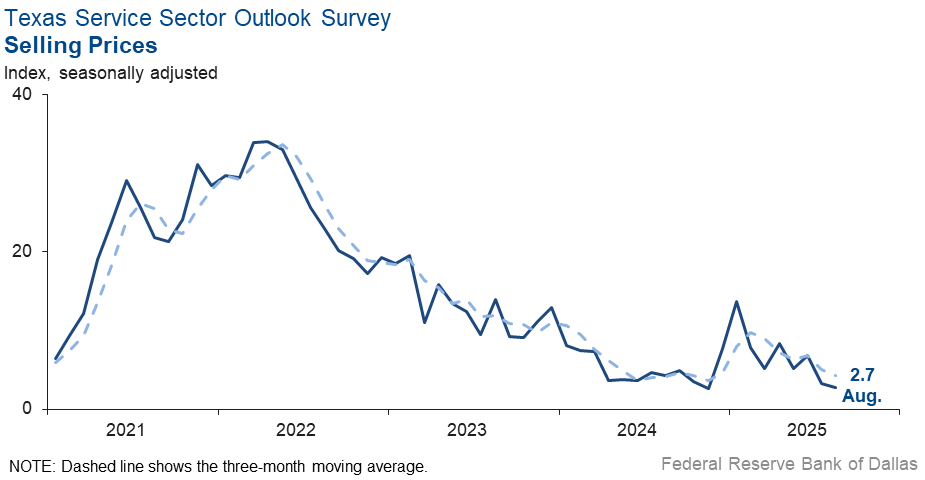
Input price and wage pressures increased slightly , while selling price growth was stable. The input prices index increased to 27.9 from 25.3, and the wages and benefits index rose two points to 15.7. The selling prices index was relatively unchanged at 2.7.
Respondents’ expectations regarding future business activity improved. The future general business activity index was relatively unchanged at 10.7, while the future revenue index increased three points to 33.8. Other future service sector activity indexes such as employment and capital expenditures, remained in positive territory, reflecting expectations for continued growth in the next six months.

Texas Retail Outlook Survey
Texas retail sales dip again
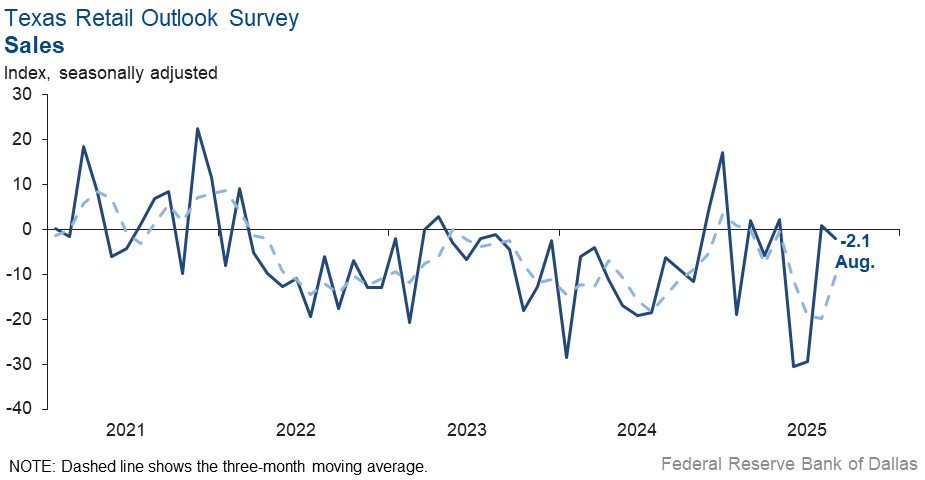
Retail sales declined in August, according to business executives responding to the Texas Retail Outlook Survey. The sales index, a key measure of state retail activity, fell three points to -2.1. Retailers’ inventories fell for the seventh consecutive month, with the index remaining in negative territory at -2.7 in August.
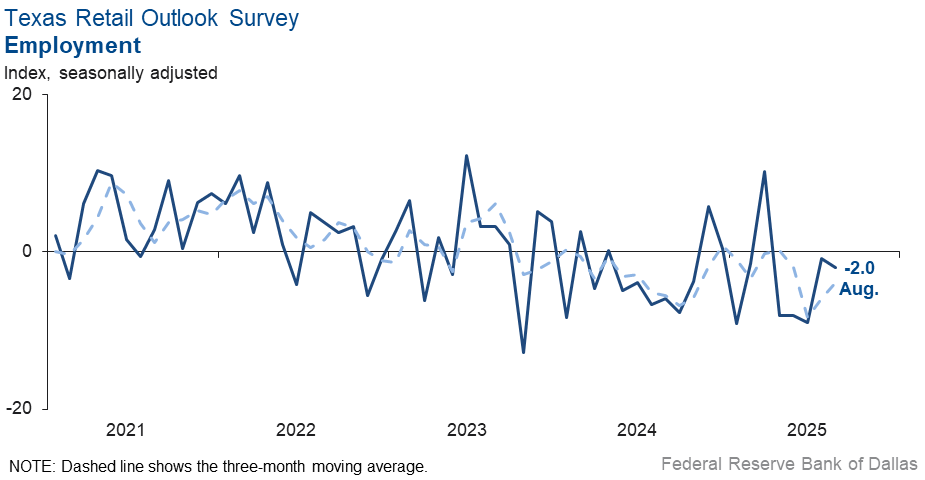
Labor market indicators reflected a contraction in retail employment and hours worked. The employment index dipped to -2.0 from -0.8, while the part-time employment index dropped 18 points to -15.5. The hours worked index retreated four points to -3.6.
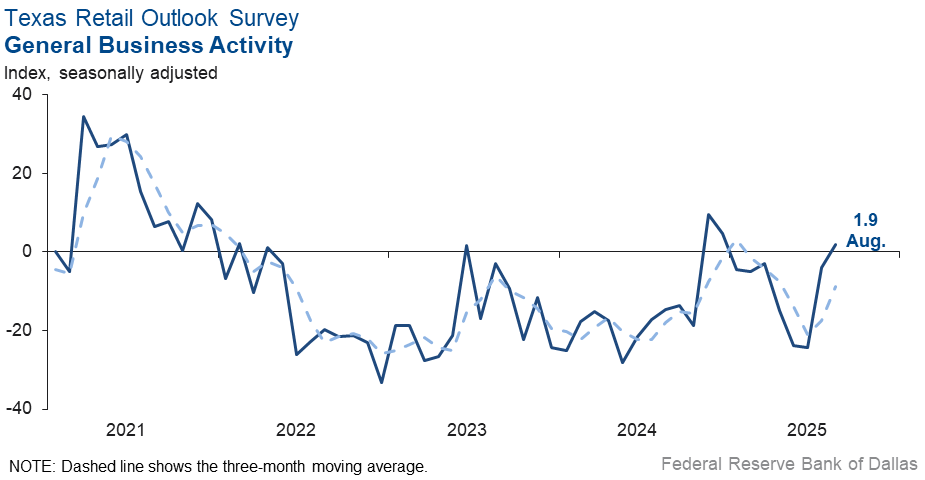
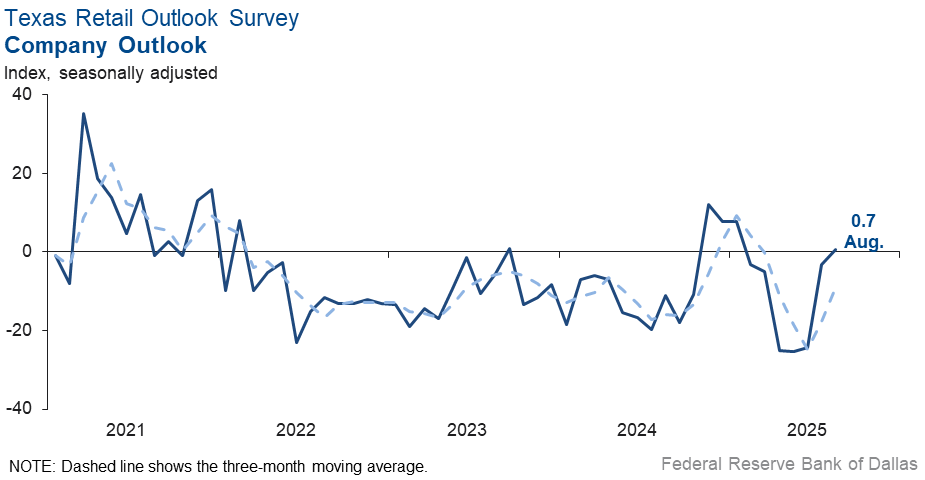
Perceptions of broader business conditions improved in August while company outlooks stabilized. The general business activity index moved back into positive territory to 1.9 from -4.0, while the company outlook index moved up four points to 0.7 in August, with the near-zero reading indicating little change in company outlooks from July. The outlook uncertainty index fell eight points to a below-average reading of 8.2.
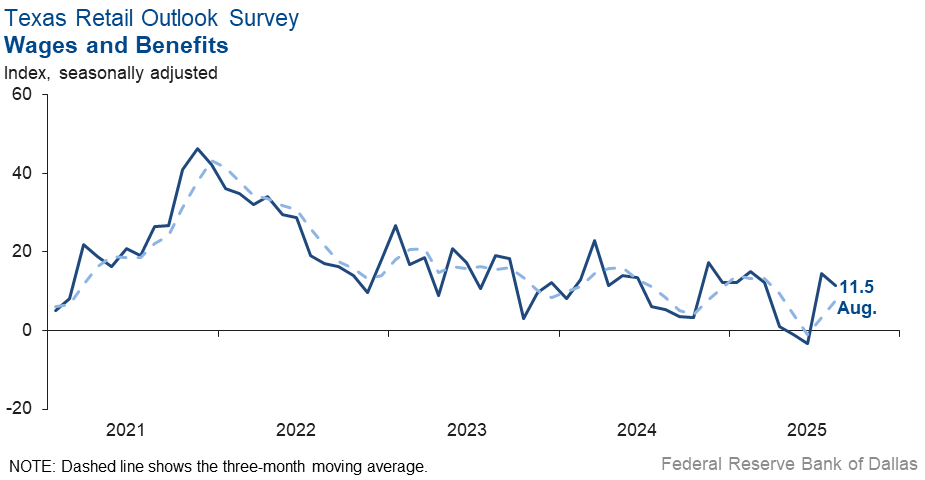
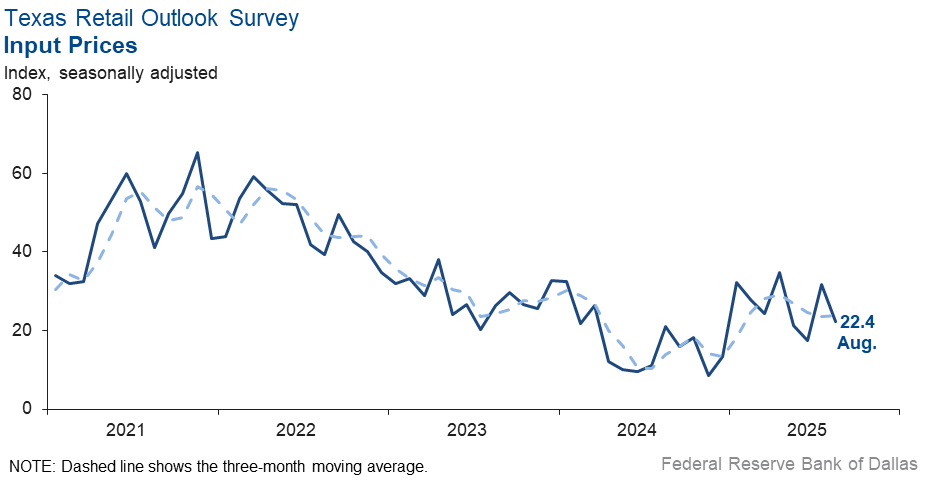
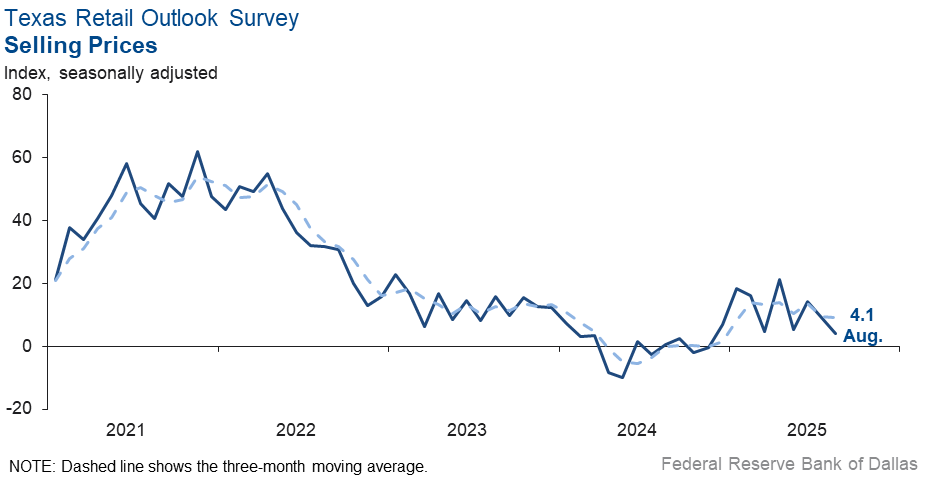
Input prices, selling prices and wage pressures eased this month. The input prices index fell nine points to 22.4, while the selling prices index dipped five points to 4.1. The wages and benefits index fell three points to 11.5.
Expectations for future retail activity improved in August. The future general business activity index ticked down two points but remained in positive territory at 13.4, while the future sales index moved sideways to 29.6. Other future retail activity indexes, such as employment and capital expenditures, remained in positive territory.
Next release: September 30, 2025
Data were collected August 12–20, and 252 of the 355 Texas service sector business executives surveyed submitted responses. The Dallas Fed conducts the Texas Service Sector Outlook Survey monthly to obtain a timely assessment of the state’s service sector activity. Firms are asked whether revenue, employment, prices, general business activity and other indicators increased, decreased or remained unchanged over the previous month.
Survey responses are used to calculate an index for each indicator. Each index is calculated by subtracting the percentage of respondents reporting a decrease from the percentage reporting an increase. When the share of firms reporting an increase exceeds the share reporting a decrease, the index will be greater than zero, suggesting the indicator has increased over the prior month. If the share of firms reporting a decrease exceeds the share reporting an increase, the index will be below zero, suggesting the indicator has decreased over the prior month. An index will be zero when the number of firms reporting an increase is equal to the number of firms reporting a decrease. Data have been seasonally adjusted as necessary.
Data have been seasonally adjusted as necessary.
Texas Service Sector Outlook Survey
Historical data are available from January 2007 to the most current release month.
| Business Indicators Relating to Facilities and Products in Texas Current (versus previous month) | ||||||||
| Indicator | Aug Index | Jul Index | Change | Series Average | Trend* | % Reporting Increase | % Reporting No Change | % Reporting Decrease |
Revenue | 8.6 | 6.3 | +2.3 | 10.3 | 2(+) | 29.1 | 50.4 | 20.5 |
Employment | 1.2 | 2.8 | –1.6 | 6.0 | 2(+) | 14.3 | 72.6 | 13.1 |
Part–Time Employment | –2.7 | –3.8 | +1.1 | 1.3 | 6(–) | 4.6 | 88.1 | 7.3 |
Hours Worked | 5.1 | 3.2 | +1.9 | 2.5 | 2(+) | 10.3 | 84.5 | 5.2 |
Wages and Benefits | 15.7 | 13.4 | +2.3 | 15.6 | 63(+) | 20.1 | 75.5 | 4.4 |
Input Prices | 27.9 | 25.3 | +2.6 | 27.8 | 64(+) | 32.3 | 63.3 | 4.4 |
Selling Prices | 2.7 | 3.3 | –0.6 | 7.5 | 61(+) | 12.9 | 76.9 | 10.2 |
Capital Expenditures | 5.8 | 12.1 | –6.3 | 9.8 | 61(+) | 13.2 | 79.4 | 7.4 |
| General Business Conditions Current (versus previous month) | ||||||||
| Indicator | Aug Index | Jul Index | Change | Series Average | Trend** | % Reporting Improved | % Reporting No Change | % Reporting Worsened |
Company Outlook | 4.3 | –2.1 | +6.4 | 4.1 | 1(+) | 20.0 | 64.3 | 15.7 |
General Business Activity | 6.8 | 2.0 | +4.8 | 2.1 | 2(+) | 20.5 | 65.8 | 13.7 |
| Indicator | Aug Index | Jul Index | Change | Series Average | Trend* | % Reporting Increase | % Reporting No Change | % Reporting Decrease |
Outlook Uncertainty | 11.2 | 12.8 | –1.6 | 13.6 | 51(+) | 24.6 | 62.0 | 13.4 |
| Business Indicators Relating to Facilities and Products in Texas Future (six months ahead) | ||||||||
| Indicator | Aug Index | Jul Index | Change | Series Average | Trend* | % Reporting Increase | % Reporting No Change | % Reporting Decrease |
Revenue | 33.8 | 31.3 | +2.5 | 37.3 | 64(+) | 46.7 | 40.3 | 12.9 |
Employment | 20.4 | 19.1 | +1.3 | 23.0 | 64(+) | 30.5 | 59.4 | 10.1 |
Part–Time Employment | 5.6 | 3.8 | +1.8 | 6.5 | 2(+) | 10.8 | 84.0 | 5.2 |
Hours Worked | 8.1 | 7.0 | +1.1 | 5.9 | 4(+) | 11.8 | 84.5 | 3.7 |
Wages and Benefits | 38.0 | 34.5 | +3.5 | 37.4 | 64(+) | 40.6 | 56.8 | 2.6 |
Input Prices | 41.3 | 41.4 | –0.1 | 44.3 | 224(+) | 47.7 | 45.9 | 6.4 |
Selling Prices | 21.5 | 20.5 | +1.0 | 24.4 | 64(+) | 30.5 | 60.5 | 9.0 |
Capital Expenditures | 17.3 | 13.5 | +3.8 | 22.5 | 63(+) | 27.0 | 63.4 | 9.7 |
| General Business Conditions Future (six months ahead) | ||||||||
| Indicator | Aug Index | Jul Index | Change | Series Average | Trend** | % Reporting Improved | % Reporting No Change | % Reporting Worsened |
Company Outlook | 11.9 | 13.8 | –1.9 | 15.4 | 4(+) | 29.7 | 52.5 | 17.8 |
General Business Activity | 10.7 | 9.8 | +0.9 | 11.9 | 3(+) | 27.7 | 55.3 | 17.0 |
Historical data are available from January 2007 to the most current release month.
| Business Indicators Relating to Facilities and Products in Texas Retail (versus previous month) | ||||||||
| Indicator | Aug Index | Jul Index | Change | Series Average | Trend* | % Reporting Increase | % Reporting No Change | % Reporting Decrease |
| Retail Activity in Texas | ||||||||
Sales | –2.1 | 0.8 | –2.9 | 2.8 | 1(–) | 23.9 | 50.1 | 26.0 |
Employment | –2.0 | –0.8 | –1.2 | 1.4 | 5(–) | 14.3 | 69.4 | 16.3 |
Part–Time Employment | –15.5 | 2.0 | –17.5 | –1.6 | 1(–) | 1.5 | 81.5 | 17.0 |
Hours Worked | –3.6 | 0.6 | –4.2 | –2.3 | 1(–) | 6.8 | 82.8 | 10.4 |
Wages and Benefits | 11.5 | 14.4 | –2.9 | 11.1 | 2(+) | 19.1 | 73.3 | 7.6 |
Input Prices | 22.4 | 31.6 | –9.2 | 22.6 | 64(+) | 29.9 | 62.6 | 7.5 |
Selling Prices | 4.1 | 9.0 | –4.9 | 13.0 | 9(+) | 24.4 | 55.3 | 20.3 |
Capital Expenditures | –0.1 | 8.3 | –8.4 | 7.4 | 1(–) | 9.4 | 81.1 | 9.5 |
Inventories | –2.7 | –2.1 | –0.6 | 2.6 | 7(–) | 21.7 | 53.9 | 24.4 |
| Companywide Retail Activity | ||||||||
Companywide Sales | –10.7 | –15.3 | +4.6 | 3.9 | 4(–) | 20.8 | 47.8 | 31.5 |
Companywide Internet Sales | –10.0 | –9.0 | –1.0 | 3.5 | 6(–) | 16.1 | 57.8 | 26.1 |
| General Business Conditions, Retail Current (versus previous month) | ||||||||
| Indicator | Aug Index | Jul Index | Change | Series Average | Trend** | % Reporting Improved | % Reporting No Change | % Reporting Worsened |
Company Outlook | 0.7 | –3.3 | +4.0 | 1.0 | 1(+) | 17.2 | 66.3 | 16.5 |
General Business Activity | 1.9 | –4.0 | +5.9 | –2.8 | 1(+) | 19.6 | 62.7 | 17.7 |
| Outlook Uncertainty Current (versus previous month) | ||||||||
| Indicator | Aug Index | Jul Index | Change | Series Average | Trend* | % Reporting Increase | % Reporting No Change | % Reporting Decrease |
Outlook Uncertainty | 8.2 | 16.3 | –8.1 | 11.4 | 13(+) | 22.4 | 63.4 | 14.2 |
| Business Indicators Relating to Facilities and Products in Texas, Retail Future (six months ahead) | ||||||||
| Indicator | Aug Index | Jul Index | Change | Series Average | Trend* | % Reporting Increase | % Reporting No Change | % Reporting Decrease |
| Retail Activity in Texas | ||||||||
Sales | 29.6 | 31.2 | –1.6 | 30.1 | 27(+) | 41.2 | 47.1 | 11.6 |
Employment | 22.4 | 23.4 | –1.0 | 12.7 | 4(+) | 33.2 | 56.0 | 10.8 |
Part–Time Employment | 0.0 | 15.7 | –15.7 | 1.5 | 1() | 7.8 | 84.4 | 7.8 |
Hours Worked | 7.9 | 10.4 | –2.5 | 2.2 | 2(+) | 15.4 | 77.1 | 7.5 |
Wages and Benefits | 35.1 | 34.9 | +0.2 | 29.0 | 64(+) | 41.9 | 51.3 | 6.8 |
Input Prices | 41.3 | 41.4 | –0.1 | 34.0 | 64(+) | 47.7 | 45.9 | 6.4 |
Selling Prices | 17.3 | 13.5 | +3.8 | 28.2 | 64(+) | 27.0 | 63.4 | 9.7 |
Capital Expenditures | 18.5 | 9.5 | +9.0 | 16.4 | 4(+) | 28.9 | 60.7 | 10.4 |
Inventories | 11.8 | 13.0 | –1.2 | 10.6 | 4(+) | 32.4 | 47.0 | 20.6 |
| Companywide Retail Activity | ||||||||
Companywide Sales | 26.7 | 22.2 | +4.5 | 28.4 | 4(+) | 39.9 | 46.8 | 13.2 |
Companywide Internet Sales | 11.2 | 12.8 | –1.6 | 21.0 | 19(+) | 24.6 | 62.0 | 13.4 |
| General Business Conditions, Retail Future (six months ahead) | ||||||||
| Indicator | Aug Index | Jul Index | Change | Series Average | Trend** | % Reporting Improved | % Reporting No Change | % Reporting Worsened |
Company Outlook | 16.5 | 19.8 | –3.3 | 14.7 | 3(+) | 32.9 | 50.7 | 16.4 |
General Business Activity | 13.4 | 15.6 | –2.2 | 10.2 | 2(+) | 27.3 | 58.8 | 13.9 |
*Shown is the number of consecutive months of expansion or contraction in the underlying indicator. Expansion is indicated by a positive index reading and denoted by a (+) in the table. Contraction is indicated by a negative index reading and denoted by a (–) in the table.
**Shown is the number of consecutive months of improvement or worsening in the underlying indicator. Improvement is indicated by a positive index reading and denoted by a (+) in the table. Worsening is indicated by a negative index reading and denoted by a (–) in the table.
Data have been seasonally adjusted as necessary.
Texas Service Sector Outlook Survey
Texas Retail Outlook Survey
Texas Service Sector Outlook Survey
Comments from survey respondents
Survey participants are given the opportunity to submit comments on current issues that may be affecting their businesses. Some comments have been edited for grammar and clarity.
- Financial institutions are lending again, so the need for appraisals is up slightly. The expert witness portion of my practices remains busy. We have a temporary need for a part-time contractor to assist. The increase in clients is driven by sustained networking efforts on our part to diversify the practice. This is to make the practice more recession resistant. High interest rates continue to chill lending. Fees remain stagnant.
- All the data points to future stagflation.
- Political uncertainty in the form of tariffs and high interest rates is the biggest challenge in the market
- We are selling at a fire sale discount to get out of business.
- Employers went dark at the end of July and into August—very few are hiring, and when they are hiring, they are not finding the talent they need and want through traditional job postings and may have to resort to hiring an outside search firm like us. Frequently, they are deciding to reallocate the workload internally and not hire for the job, instead adding the duties to existing employees.
- The current attitude that interest rates are too high is freezing the real estate market. This is locking people into homes for longer than they would like. It is also locking people into holding lots and ranches for longer than they would like. This will eventually lead to a liquidity crunch unless attitudes change. In reality, rates are not too high with inflation, tariffs and a shrinking labor supply, so it is better if the attitude changes.
- Management is about planning and risk management. How is either possible [in the current environment]?
- The economy continues to be positive, and the outlook is beginning to look positive. There are still variables that are difficult to forecast but the general attitude of clients is leaning to the positive. There is an increased feeling that regulatory burdens could begin to ease under the efforts of the current administration. It seems every step to improve the general business environment is met with adversity, mainly due to political unrest and animosity.
- Interest rates [moving] down affects our bank slightly. Cattle prices [are] good for our customers.
- Between regulations and noise about artificial intelligence, there's a lot of uncertainty, which is delaying decisions.
- International relationships and visa processing have drastically reduced our international student population. Uncertainty about grant funding and state and federal regulations and processes increases costs and reduces revenue. Economic uncertainty persists and impacts students' willingness and ability to spend on education.
- U.S. Economy is getting stronger from the sales increase we see; global economy is getting better also but at a slower pace than U.S.
- Small Business Administration protocol changes will dramatically discourage business transfers:
- Seller notes [are] to remain on full standby for the entire life of the SBA guaranteed loan instead of the prior limit of two years.
- Personal guarantees from sellers retaining less than 20 percent following a full change in ownership will hinder successful transitions to new owners.
- Cost increases will hit companies when they renew for fiscal year 2026. We have never seen this kind of increase in 30 years. Business insurance in general for engineering firms (our size, 400+ employees) will go up by 15-25 percent. Umbrella premiums are going up by 50 percent for us. Health insurance premiums for us are going up by 30 percent, even with lowering claims. We are mitigating the expense to employees by absorbing 90 percent of the increase, but passing on cost to clients would equate to 0.8-1 percent price increases. Health insurance is the largest one-year increase we have seen in our history. In today's profitability terms, the cost of health insurance would have cut our margins by 25 percent.
- Our business clients are unable to plan due to the roller coaster environment in Washington.
- We are a consulting firm that works with nonprofits. Our nonprofits are gearing up for greater need with less resources. We are nervous for them and ultimately know it will impact us.
- ChatGPT and cloud services are making us more productive.
- July and August have been better than previous months. We have noticed that companies that needed employees but were not comfortable hiring have moved forward with hiring decisions this summer. Let's hope they keep thinking positively.
- Tariffs and immigration uncertainty still threaten commercial real estate and construction. Consistent and formal policy would allow businesses to plan and react accordingly.
- Finding qualified employees continues to be the one factor limiting expansion. Employees under 40 years seem to be looking for higher wages in lieu of benefits such as 401k contributions, year-end bonus and health insurance.
- We are in consulting engineering. The market has shifted in the last 2-3 months with clients holding back on awarding new projects.
- Things seem to have settled down as it relates to federal transportation policy and grant status which has allowed for consistency. We will see what happens through transportation reauthorization.
- The market really hasn't changed much the last few months. It seems like the private sector is a little reluctant to approve new contracts. The government sector is increasing a little. We are still short-staffed, but the job market is not as competitive as it was last year. We are more optimistic about filling those positions this year than last.
- These are very difficult times to figure which way the real estate market is headed. The uncertainty around the tariffs has everyone wondering what they are going to do to inflation as well as the interest rates. We need clarity soon.
- Inflation/prices rising is not good for consumer spending, which will directly impact our business.
- The collective and compounding impact of persistently high interest rates, tariff-related disruptions, reduced federal spending and labor constraints is starting to impact us and our customers.
- Overall, business environment seems very tough. Consumers [are] not agreeing to price increases. Interest rates are still an issue. Everyone seems to be very cautious.
- Prime leasing season this summer has been a bit disappointing. Most of the renter traffic we've seen in workforce apartments is unqualified and just looking for a place that will take them and all their issues. Immigrants are terrified, keeping their heads down and not moving as much. Phony documents remain common, and artificial intelligence is improving the fakes. Delinquency is stubbornly high. Apartment deal flow is picking up a bit as interest rates moderate, but a lot of equity is being wiped out. Many retail investors who gave their retirement savings to unsophisticated syndicators are just now coming to grips with the fact that it's all gone.
- Still uncertain how the tariffs are going to impact our consumers and their discretionary spending for entertainment.
- Uncertainty about tariff policy continues to make it extremely difficult to make big capital-expenditures decisions. Should we pull the trigger and buy our 2026 fleet now, even though they are charging us a 10 percent tariff surcharge? Or should we wait and see if that goes away in the next six months? So hard to plan.
- We thought after the One Big Beautiful Bill passed and reinstituted bonus depreciation and other capital goods purchase incentives that our business would take off. To some extent it has; July was our best July in our 65-year history. However, we are still down volume-wise this year, and customers are still hesitant to "pull the trigger." We think the fact that our equipment is today at least 50 percent [more expensive] than it was pre-COVID is a major obstacle to many small businesses. You would think interest rates would be a major deterrent, but most of our manufacturers provide 0 percent [on] 48-month retail financing. Tariffs are like any crisi; manufacturers are using even the threat of tariffs as an excuse to raise prices or pass tariffs on or both. While inflation is not clearly in the Fed numbers yet, it is going to be because manufacturers are passing those very significant costs on to the dealers and consumers.
- We are awaiting the impact of tariffs on construction costs and other inputs but also expecting some interest-rate relief and slightly increased capital flows.
- Most business books we are seeing are down 5-25 percent year over year. If owners are not diligent, this may affect their net and capital expenditures for the coming year.
- Good rains and ag prices have helped major employers [in] keeping [the] workforce steady.
- We're in a generally weaker hiring market compared to the spring. The summer can sometimes present a weaker market, but there doesn't feel like much momentum in our pipelines leading into the fall, which we usually expect to bring better market conditions. Tariffs presented a headwind earlier in the year, but persistent restrictive rates now seem to be the primary culprit.
- We are waiting to see the direct impact of tariffs and the indirect impact, such as layoffs.
- We just landed a contract with a Fortune 200 company that will require us to invest an additional $5 million in a building.
- The reason for optimism lies in the current Federal administration’s focus on tightening restrictions around foreign drivers operating semitrucks. Reducing this excess labor capacity—created through prior labor dumping practices—will help balance the market while also improving safety on our roads.
- The economy is getting better.
- People are searching extremely hard to make sure they are not overpaying. The instant price increases on certain categories are shocking.
- We are awaiting the impact tariffs will have on prices and the ability for our patients to be able to [afford] them.
- We are concerned about the impact of tariffs on the general economy.
- We are currently adding new business in Ecuador. We are also growing organically with our client in Panama as they increase their footprint of stores. They are adding new lines of business to their portfolio, and we will support their new openings (4 stores) in 2026. Our customer in Costa Rica is also expanding its operations, and we will be supporting the supply chain starting late September or early October. Fortunately, we are aligned with some very strong domestic brands that continue to outperform their peers in the domestic U.S. market. In turn, this helps drive greater consumer interest in the Latin American markets we serve. As long as the dollar does not increase in strength relative to the other markets, we anticipate good sales growth for the next 6-12 months.
- Signs are pointing [to a] weakening economy, so the Fed can start to cut rates and hopefully start the economy to turn around.
- Vendors are increasing their prices, and we can't absorb the increases. We will increase prices this quarter to keep up with inflation.
Special questions
For this month’s survey, Texas business executives were asked supplemental questions on demand expectations, pricing power and the impact of tariffs. Results below include responses from participants of all three surveys: Texas Manufacturing Outlook Survey, Texas Service Sector Outlook Survey and Texas Retail Outlook Survey. View individual survey results.
Historical Data
Historical data can be downloaded dating back to January 2007.
Indexes
Download indexes for all indicators. For the definitions of all variables, see data definitions.
Texas Service Sector Outlook Survey |
Texas Retail Outlook Survey |
| Unadjusted | Unadjusted |
| Seasonally adjusted | Seasonally adjusted |
All Data
Download indexes and components of the indexes (percentage of respondents reporting increase, decrease, or no change). For the definitions of all variables, see data definitions.
Texas Service Sector Outlook Survey |
Texas Retail Outlook Survey |
| Unadjusted | Unadjusted |
| Seasonally adjusted | Seasonally adjusted |
Questions regarding the Texas Service Sector Outlook Survey can be addressed to Mariam Yousuf at mariam.yousuf@dal.frb.org.
Sign up for our email alert to be automatically notified as soon as the latest Texas Service Sector Outlook Survey is released on the web.