Another benefit of trimming: smaller inflation revisions
With the Dallas Fed’s Trimmed Mean Personal Consumption Expenditures (PCE) inflation rate, what you see in real time is closer to what you get after revision than is the case with the more conventional measure of core inflation, PCE excluding food and energy.
Many of the data series that economists and policymakers work with are subject to revision. Initial releases of real gross domestic product or nonfarm payroll employment are estimates based on incomplete source data; over time, as more complete source data become available, the estimates are revised to paint a more accurate picture. Revisions may also incorporate improvements in statistical agencies’ data sources or methods over time.
The same is true of inflation measures such as the PCE excluding food and energy and the Trimmed Mean PCE inflation rate. Compared with ex-food-and-energy PCE inflation, the trimmed mean is subject to smaller revisions on average and, in particular, is less prone to very large revisions. The accuracy of real-time signals is likely to be important during monetary policy deliberations.
Accuracy of inflation measures
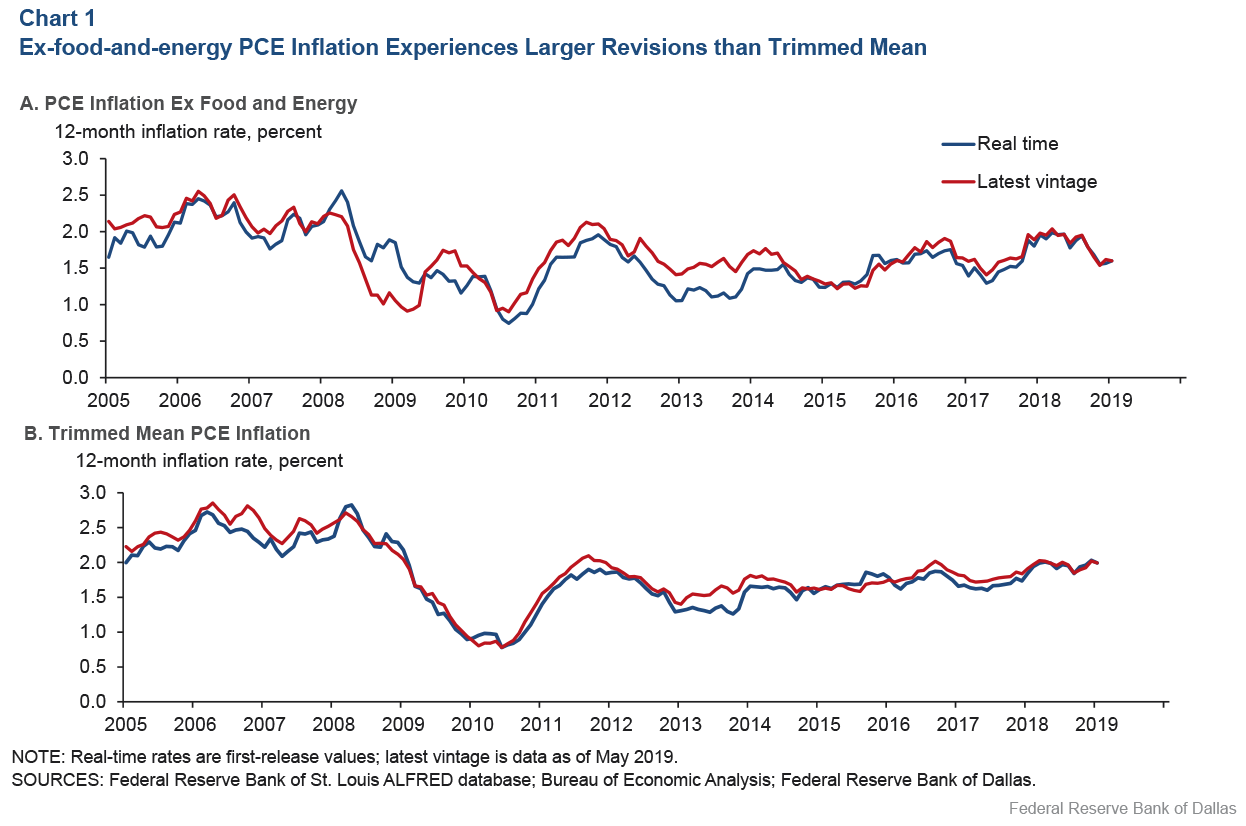
The two panels of Chart 1 show 12-month inflation rates for PCE excluding food and energy (top panel) and the trimmed mean (bottom panel) over the period for which we have real-time trimmed mean data. The red line in each panel represents current data as of today, with observations at earlier dates having gone through multiple revisions. The blue line in each panel represents 12-month inflation rates as they were available in real time, at first release (that is, unrevised). Note that the vertical scales are the same in the upper and lower panels.
The data presented are through May 2019, and so do not reflect the most recent annual revision by the Bureau of Economic Analysis.

On average, over the entire period, the trimmed mean has the edge in terms of revision size—in absolute value, the average revision to 12-month ex-food-and-energy inflation was 0.19 percentage points versus 0.12 percentage points for the trimmed mean. More notable, though, is the difference in the frequency of very large revisions.
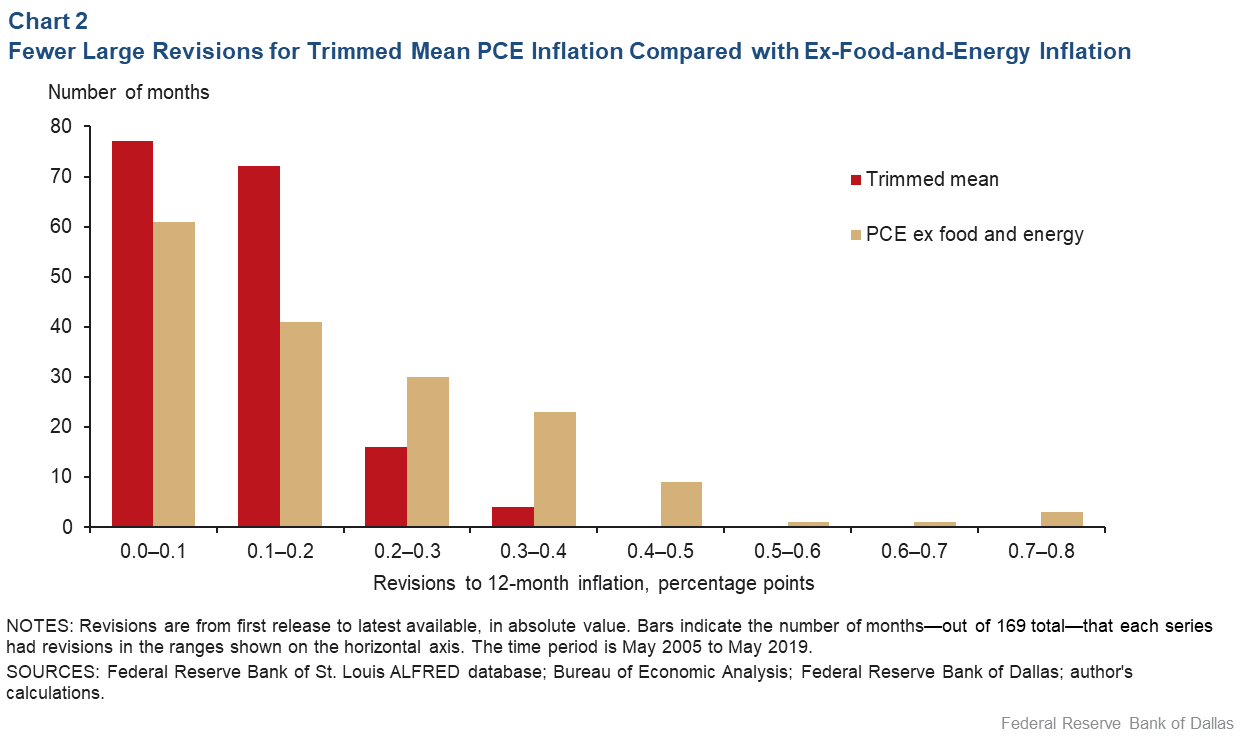
Chart 2 plots a histogram of the revisions to 12-month inflation (in absolute value) reflected in Chart 1; the height of the bars shows the number of months (out of 169 total) in which the revisions fell in the ranges 0.0–0.1 percentage points, 0.1–0.2 percentage points, and so forth.

In almost 90 percent of the months shown in Chart 1, revisions to 12-month trimmed mean inflation are less than 0.2 percentage points in absolute value. For ex-food-and-energy, in contrast, revisions exceed 0.2 percentage points in about 40 percent of the months, including a few months where the revisions were between 0.7 and 0.8 percentage points.
Source of the difference
Unlike the ex-food-and-energy measure, which always excludes prices for food and energy (and only food and energy), the trimmed mean excludes the most extreme price changes in the PCE basket each month, whether they come from food, energy or other categories. As it turns out, trimming the most extreme price changes also leads to less susceptibility to revision.
This benefit from trimming hinges on the correlation between a component series getting substantially revised and its likelihood of being excluded in the trimmed mean. On average, bigger revisions occur in more volatile series, which are more likely to have been excluded from the trimmed mean in the first place.
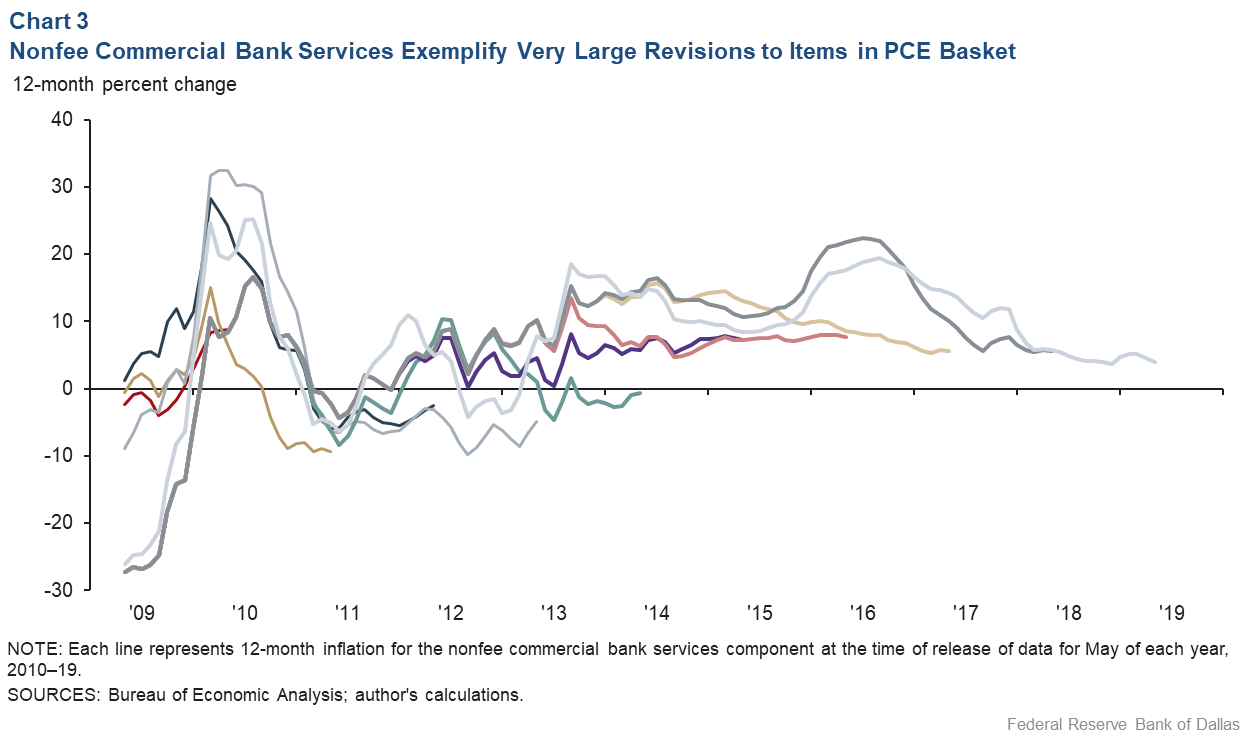
To illustrate just how large the revisions to some series can be, Chart 3 plots various vintages of data for the PCE price index for nonfee commercial bank services, which includes services such as no-fee checking and savings accounts. Each line in the chart displays 12-month inflation in this component series as observed at the time of the release of data for May, covering 2010 to 2019. The revisions over time are large and even switch signs—the observation for May 2013, for example, went from a first release value of negative 4.9 percent to a current estimate of positive 7.8 percent.

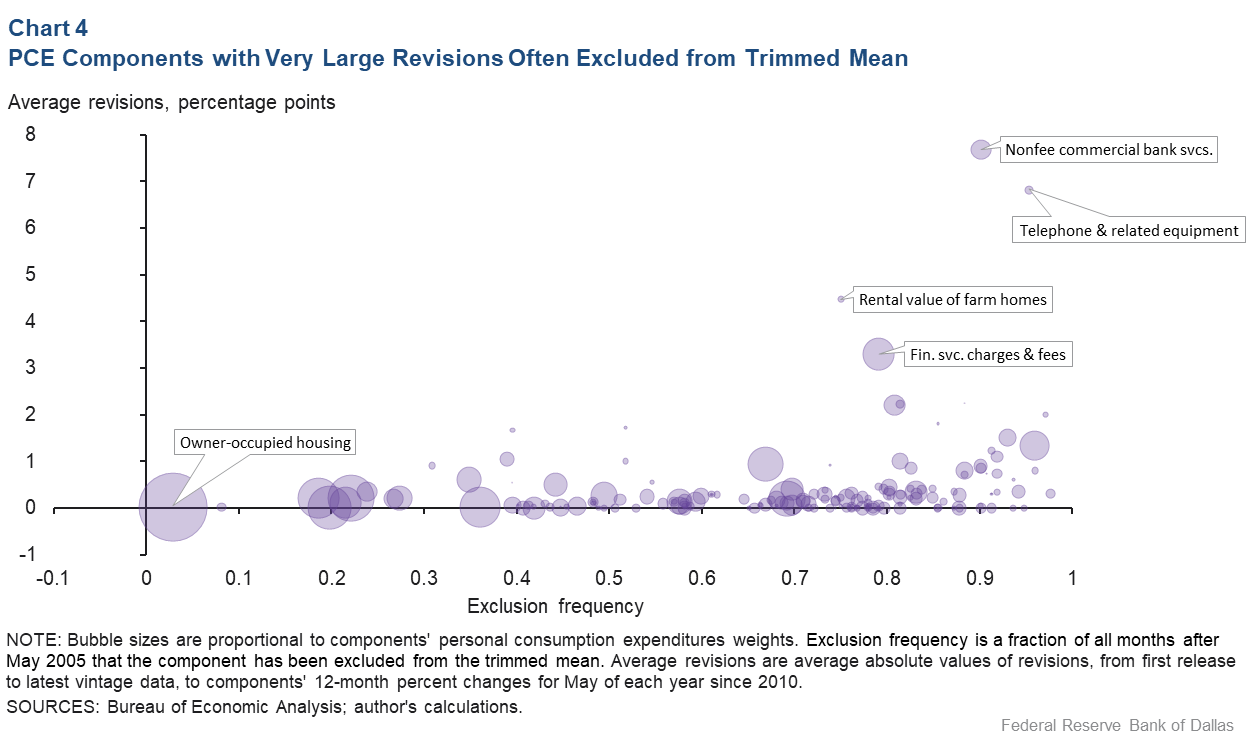
As it turns out, the price index for nonfee commercial bank services is one of the most volatile components in the PCE basket; consequently, it’s been excluded from the trimmed mean about 90 percent of the time. A similar pattern holds, on average, for other components that tend to have very large revisions. Chart 4 demonstrates this pattern.

Each bubble in the chart represents a component in the PCE basket. A bubble’s height measures the typical revision for that component as the average absolute change, from first release to current, in the component’s 12-month inflation rate for May, again covering 2010 to 2019. A bubble’s position on the horizontal axis measures the component’s frequency of exclusion from the trimmed mean over the trimmed mean’s history. Finally, the bubble sizes are proportional to the components’ weights in the PCE basket.
The large bubble at the lower left of the chart is the price index for owner-occupied housing, which has a weight of roughly 11 percent in the PCE basket. The large bubble in the upper right is the price index for nonfee commercial bank services whose revisions were plotted in Chart 3.
Avoiding missteps
Inflation forecasts (and possibly monetary policy choices) would no doubt differ if inflation were known to be one-half or three-quarters of a percent higher or lower than the latest estimates indicate. If the error in measurement is realized only months or years after decisions are made, earlier decisions may come to be viewed as mistakes. Missteps of this sort are less likely when decisions are based on indicators that are less prone to hefty revisions.
The Trimmed Mean PCE inflation rate was designed to filter out transitory noise in headline PCE inflation, thus providing a better gauge of inflation’s trend. Previous Dallas Fed Economics posts argued that, compared with ex-food-and-energy inflation, the trimmed mean provides less-biased real-time signals about headline inflation’s trend and more reliable signals about whether cyclical pressures are building.
As we’ve seen, there is another benefit of the trimmed mean’s design: Compared with the ex-food-and-energy measure, it’s more robust to revisions to the underlying data that go into it.
About the Author
Jim Dolmas
Dolmas is a senior economist and policy advisor in the Research Department at the Federal Reserve Bank of Dallas.
The views expressed are those of the authors and should not be attributed to the Federal Reserve Bank of Dallas or the Federal Reserve System.
