Texas Weekly Employment Estimate provides new, early economic insights
The COVID-19 pandemic-induced economic slowdown is in many ways more like a natural disaster than a typical recession. Job losses have been swift and deep but do not appear to be entirely long-lasting.
In this environment where economic conditions change very quickly and can reverse with the spread of the virus, tracking the Texas economy requires a timelier indicator than standard quarterly and monthly economic measures.
To meet this challenge, the new Texas Weekly Employment Estimate (TWEE) will appear each Friday and reflect workforce changes during the prior week. So, for example, the TWEE for the week ended Aug. 22, the reference week, will be released on Aug. 28. Thus, the TWEE is a timely tool to monitor evolving economic conditions and provides an indication of developments while awaiting release of the U.S. Bureau of Labor Statistics’ establishment survey, to which Texas employers report the number of workers on their payrolls.
Indicator draws on variety of data sources
Most of the data used in the weekly estimate come from private sources, following a similar methodology to the Weekly Economic Index (WEI), which provides a signal regarding the performance of the U.S. economy. The Texas employment estimate is drawn from six data series all constructed for Texas:
- Weekly initial jobless claims: Claims data come from the Texas Workforce Commission and are published by the U.S. Bureau of Labor Statistics.
- Dallas Fed Mobility and Engagement Index (MEI) for Texas: The Texas MEI measures the deviation from normal mobility behaviors induced by COVID-19. It summarizes the information from seven variables based on geolocation data anonymously collected from a large sample of mobile devices to gain insight into the economic impact of the pandemic.
- Debit/credit card consumer spending: Spending data come from Affinity Solutions, a market research firm, via tracktherecovery.org, a joint effort of Harvard and Brown universities and the Bill and Melinda Gates Foundation. The spending information captures roughly 10 percent of all debit and credit card U.S. expenditures.
In the TWEE, only Texas is shown. It overrepresents categories where cards are used more for purchase relative to total consumer spending. For example, restaurants are overrepresented, while motor vehicles are underrepresented. The data are reported relative to the average in January, and as a seven-day moving average.
- Homebase hours worked: The index shows the percent change from January in hours worked by hourly employees at businesses that utilize Homebase software. Homebase is a scheduling and time tracking tool used by more than 100,000 small businesses and their hourly employees. Homebase customers in the U.S. primarily consist of restaurant, food and beverage, retail and services businesses and are largely individual owned/operator managed.
This overrepresents the hardest-hit industries, which have tended to fall further and bounce back faster than the labor market as a whole. The reference period is the median in January for the same day of the week as that surveyed. It is a weekly average.
- Dining traffic: The index shows seated diners at a sample of restaurants on the OpenTable reservations network across all of its channels: online reservations, phone reservations and walk-ins, as a percent of year-ago levels. It is shown as a seven-day moving average.
- Rig count: The data show the weekly Baker Hughes drilling rig count for Texas.
Establishing a baseline index
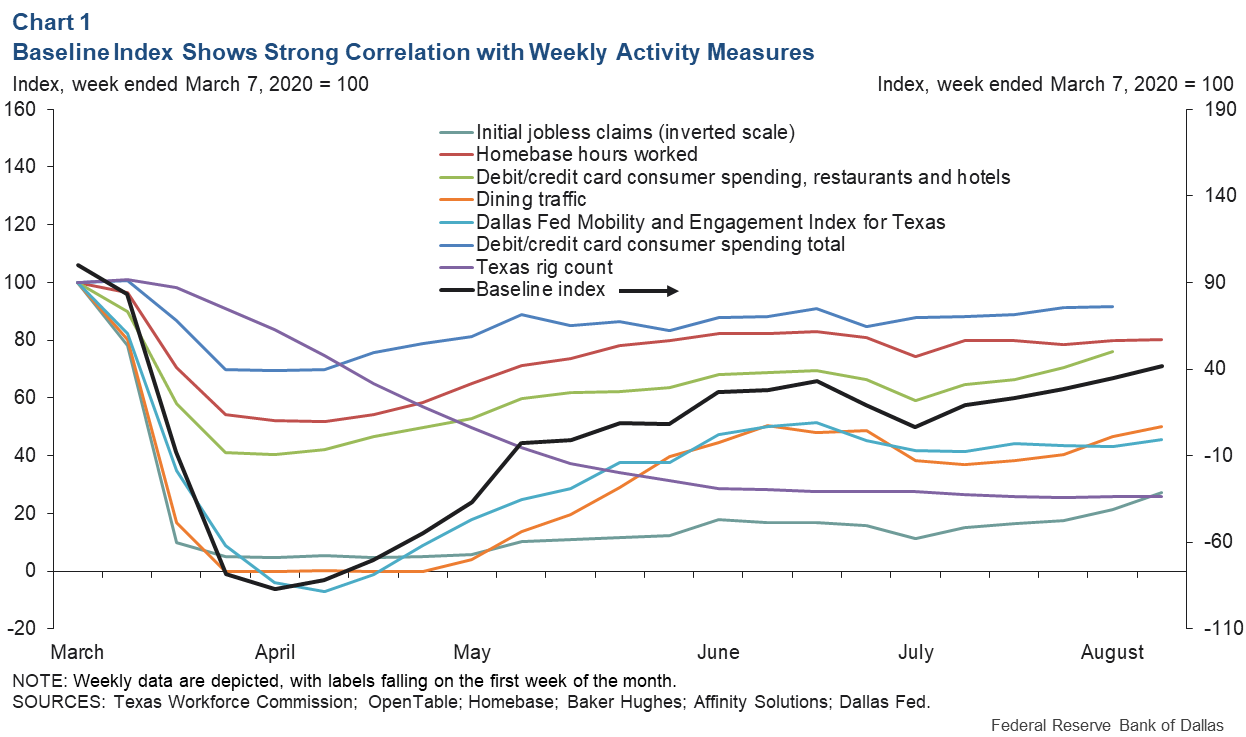
We use principal component analysis—a way to discover and see patterns in datasets—to extract a baseline index that best describes the underlying co-movement of the six data series beginning in the first week of January 2020. Chart 1 shows a strong positive correlation between the baseline index and weekly economic activity measures, which should move in the same direction as the index. For example, the baseline index should go up if dining traffic, hours worked in retail services, and mobility and engagement increase.
The resulting baseline index derived from principal component analysis is unit-less; thus, the level of the series has no specific interpretation. In the WEI, authors use the four-quarter growth of gross domestic product (GDP) from 2008 through fourth quarter 2019 to adjust the baseline index to represent annual real (inflation-adjusted) GDP growth.
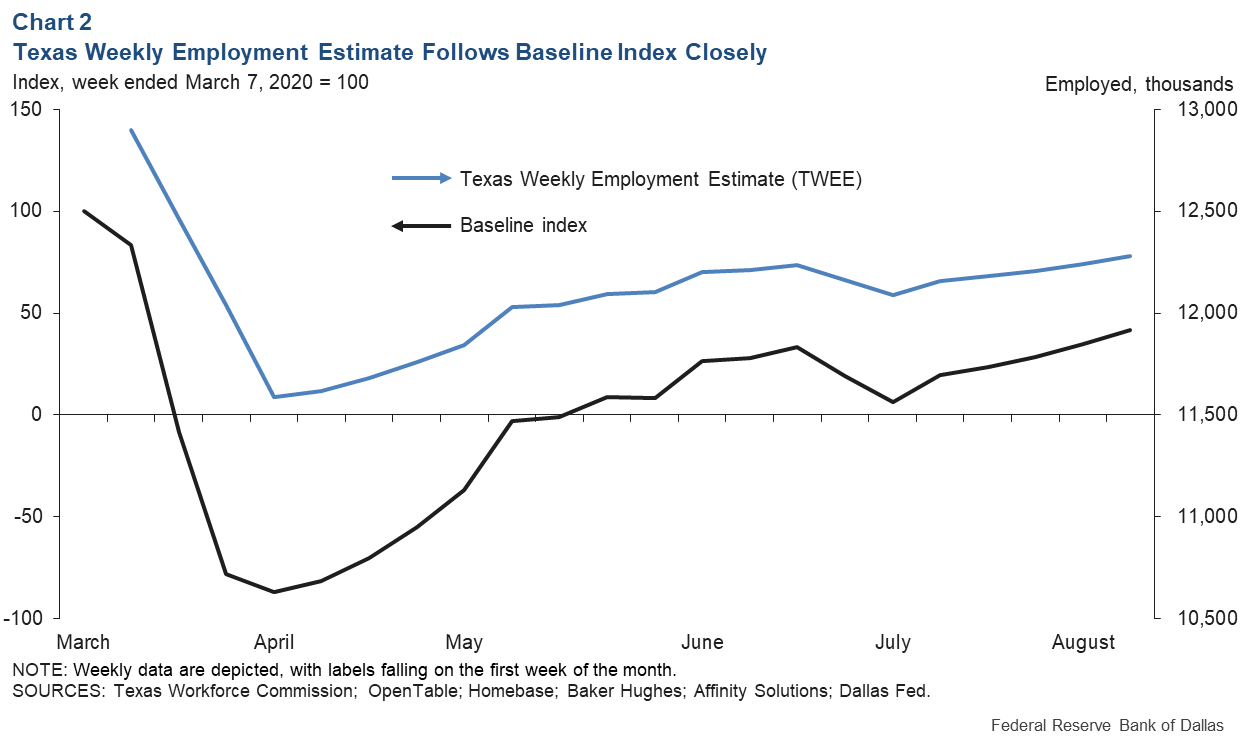
The way we link our baseline index to an economic indicator is by pairing it with employment using a technique of temporal disaggregation called the Chow-Lin method of interpolation and extrapolation. The main goal of our temporal disaggregation is to create a new time series (TWEE) that is consistent with the low-frequency data (Texas monthly employment) while maintaining the short-term behavior of the higher-frequency indicator series (the baseline index).
The technique creates a weekly estimate of jobs that fills the gap between each monthly nonfarm employment release and, at the same time, is bounded by the monthly growth. In the period before traditional jobs data are released, the technique projects weekly growth based on previous job growth and the movement in the baseline index. Thus, the TWEE is consistent with previous employment growth and follows a current summary of real-time economic data for the estimation period.
Chart 2 shows the baseline index and the TWEE resulting from the temporal disaggregation technique. As shown in the chart, we successfully link Texas monthly employment to our weekly baseline index from the first week of March through the last week of June (interpolation) to then project weekly employment behavior into August (extrapolation).
The TWEE shows slight growth in the last week of July and considerable improvement in August after falling from mid-June to mid-July (Chart 3).
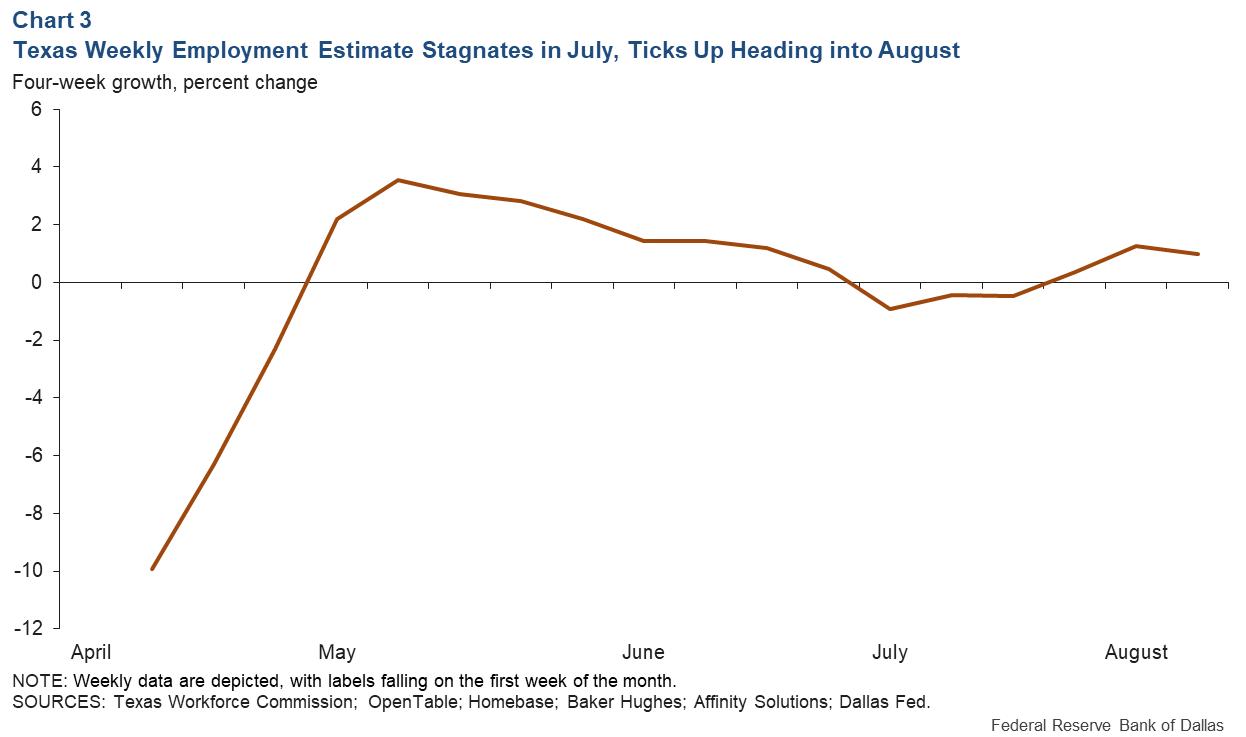
As daily new COVID-19 cases began increasing in the summer, reaching new highs from early June to mid-July, jobs appear to have declined. However, the recent incidence of COVID-19 cases has edged lower and employment activity has increased.
The latest TWEE data should help the public anticipate what official releases will subsequently show and aid in the planning of responses to the rapidly evolving economic conditions.
About the Authors

Jesus Cañas
Cañas is a senior business economist in the Research Department at the Federal Reserve Bank of Dallas.

Keith R. Phillips
Phillips is an assistant vice president and senior economist in the San Antonio Branch of the Federal Reserve Bank of Dallas.

Carlee Crocker
Crocker is a research analyst in the Research Department at the Federal Reserve Bank of Dallas.
The views expressed are those of the authors and should not be attributed to the Federal Reserve Bank of Dallas or the Federal Reserve System.