Surging house prices expected to propel rent increases, push up inflation
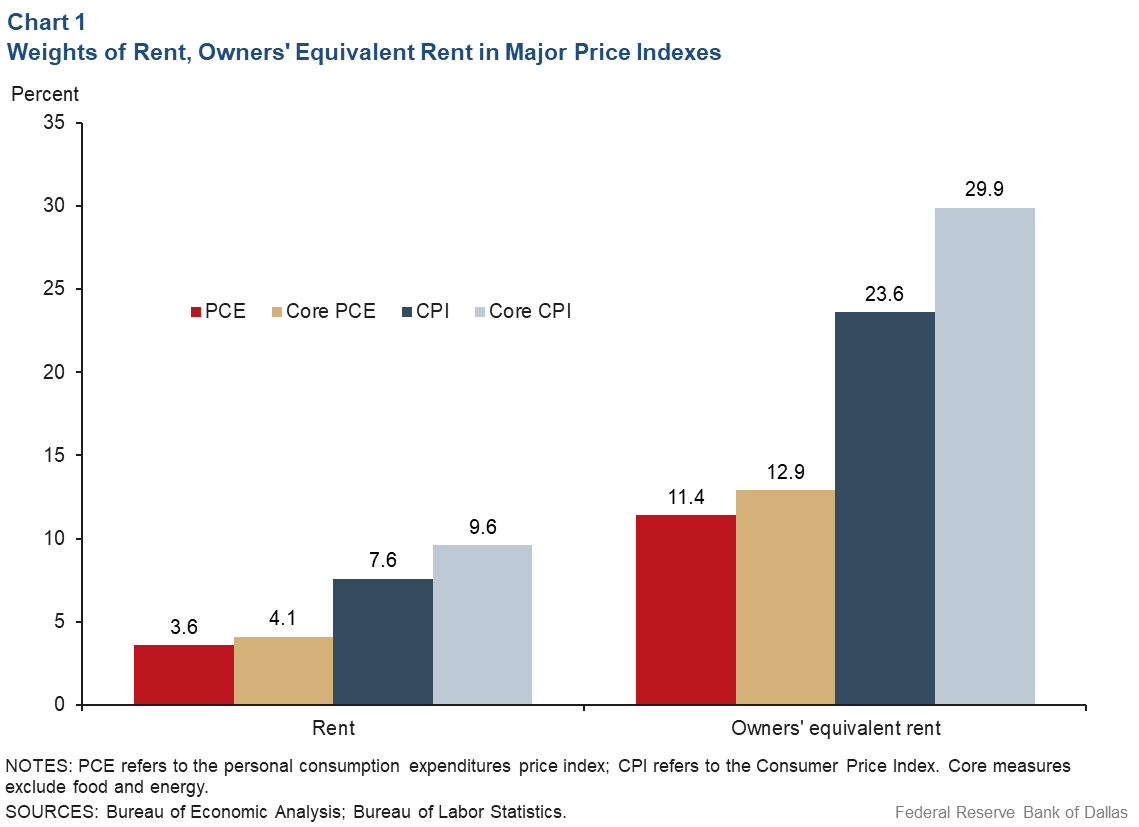
Rent and owners’ equivalent rent (OER)—the amount of rent equivalent to the cost of ownership—are among the most important components of the Consumer Price Index (CPI) and the personal consumption expenditures (PCE) price index (Chart 1).
Since the COVID-19 pandemic began in February 2020, the inflation rates of rent and OER have declined sharply to around 2 percent in recent months, compared with 3.7 and 3.3 percent, respectively, before the pandemic. However, we expect rent inflation and OER inflation to accelerate in the years to come.
There is evidence that house price growth historically has been useful when predicting the inflation rates of rent and OER. Given the recent surge in house prices, both rent inflation and OER inflation are expected to rise in the coming years. We present forecasts of these inflation rates and discuss the implications for overall inflation.
House price growth a leading inflation indicator
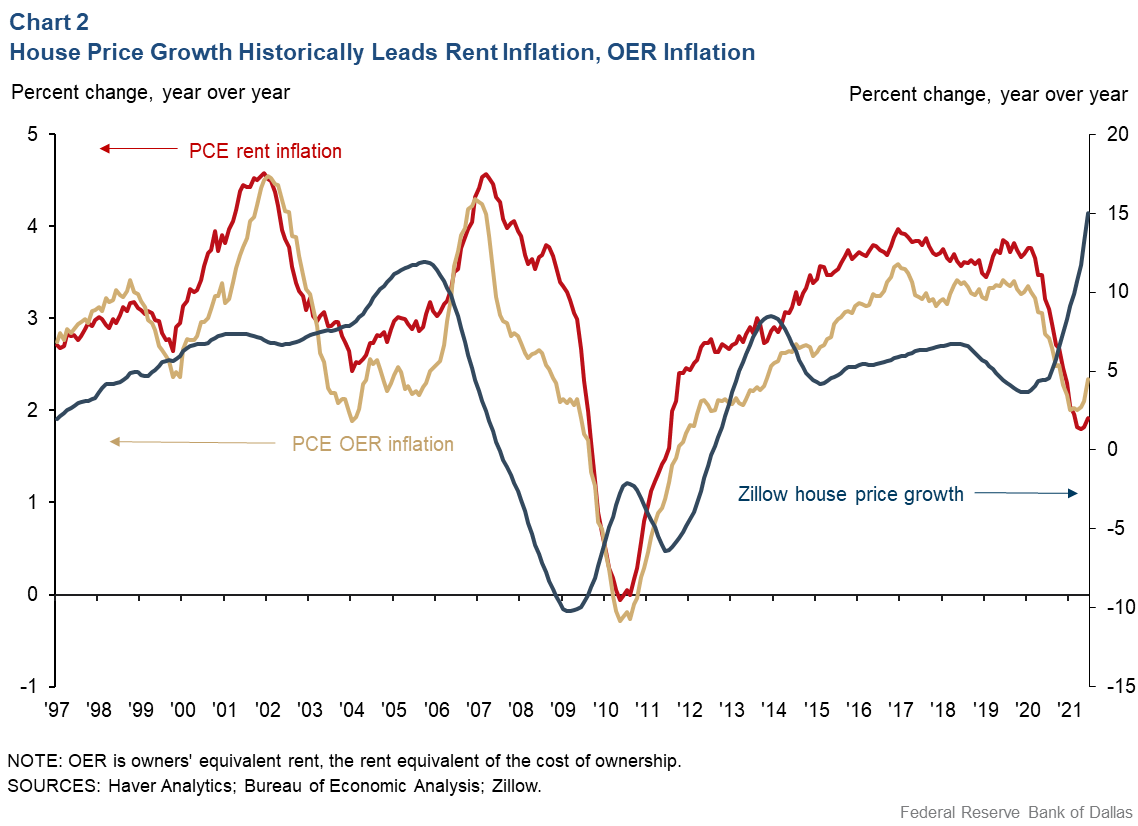
Historically, house price growth (expressed as a 12-month growth rate) has led rent inflation and OER inflation by somewhat less than two years (Chart 2).
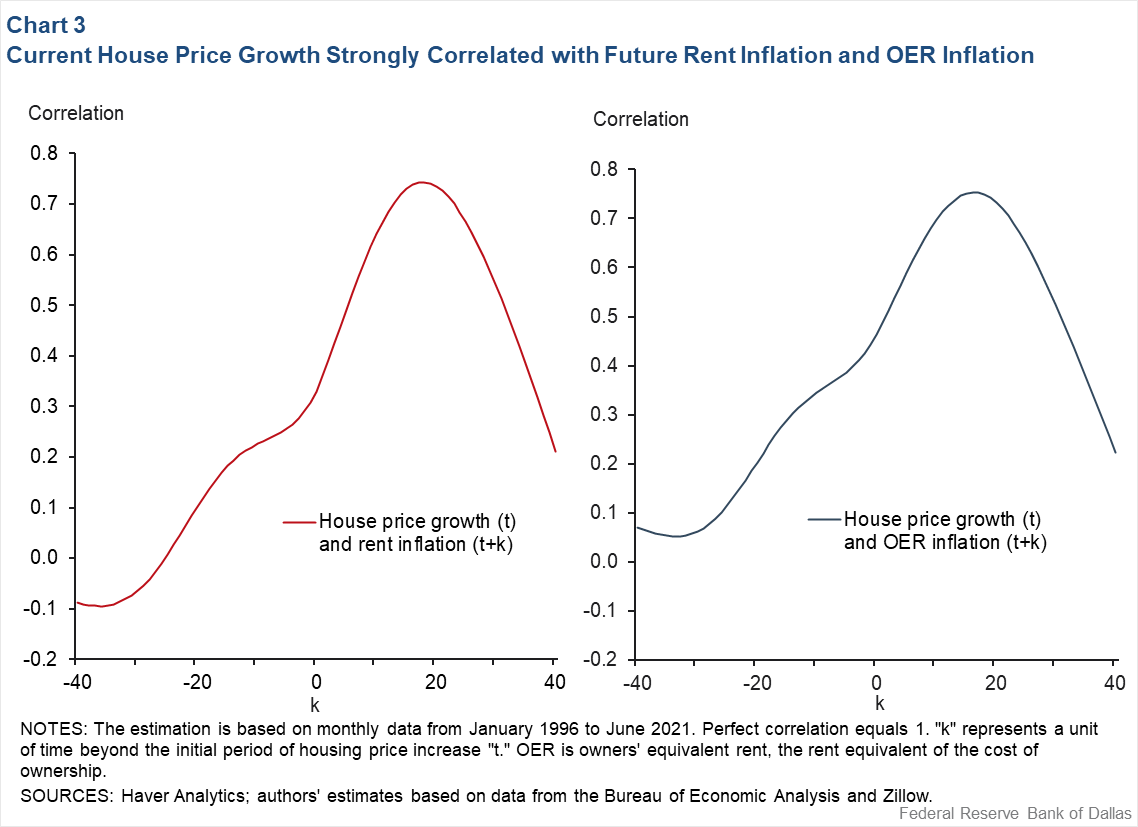
We confirm this relationship by computing the correlation between current rent inflation and past and future house price growth (Chart 3, left panel). This calculation reveals that current house price growth is most strongly correlated with rent inflation 18 months later, with the correlation coefficient reaching 0.74 at its peak.
Likewise, current house price growth is most strongly correlated with OER inflation 16 months later, with a maximum correlation coefficient of 0.75 (Chart 3, right panel). Our analysis focuses on the inflation rates measured in the PCE data; CPI data generate similar results.
Forecasting rent, OER inflation
The high correlations between current house price growth and future inflation of rent and OER suggest that house price growth is useful for forecasting the inflation rates of these housing components. This motivates the use of a vector autoregressive model that captures the dynamic relationships between house price growth, rent inflation and OER inflation. Chart 4 shows forecasts of the 12-month PCE inflation rates for rent and OER through December 2023.
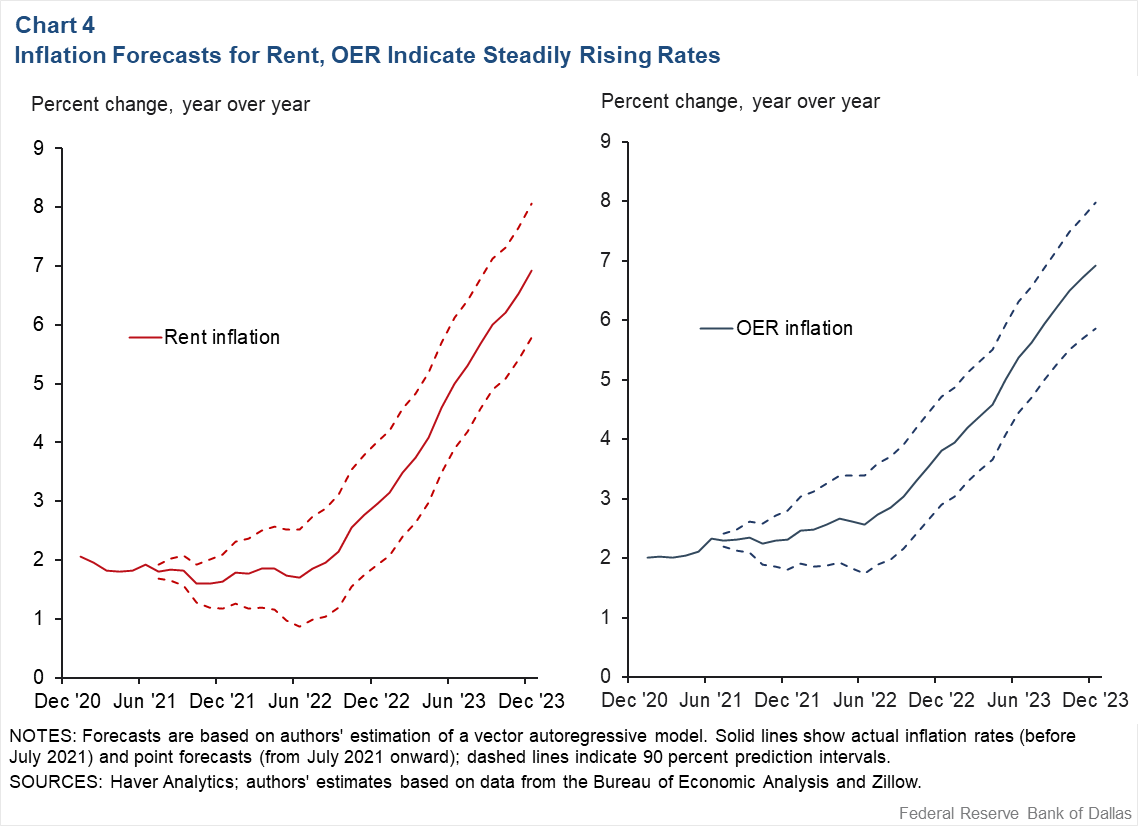
Rent inflation is expected to increase from 1.9 percent in June 2021 to 3.0 percent at year-end 2022 and to 6.9 percent at year-end 2023. The predicted path of OER inflation is higher for 2021 and 2022. OER inflation is expected to rise from 2.3 percent in June 2021 to 3.8 percent by year-end 2022 and to 6.9 percent by year-end 2023. The rates of the increase reached in late 2023 for rents and OER would be the highest in more than 30 years. CPI data yield similar results.
PCE, core PCE inflation
Our forecasting model shows that rent inflation and OER inflation are expected to increase materially in 2022 and 2023. Given their weights in the core PCE price index (which excludes food and energy), rent and OER together are expected to contribute about 0.6 percentage points to 12-month core PCE inflation for 2022 and about 1.2 percentage points for 2023.
These forecasts also suggest that rising inflation for rent and OER could push the overall and core PCE inflation rates above 2 percent in 2023, when current supply bottlenecks and labor shortages may have subsided (Table 1).Table 1: Expected Increase in Overall and Core PCE Inflation Relative to Prepandemic Level
| 2017–19 average | Dec. 2023 forecast | Expected increase in overall PCE inflation | Expected increase in core PCE inflation | |
| Rent inflation | 3.7 | 6.9 | 0.12 | 0.13 |
| OER inflation | 3.3 | 6.9 | 0.41 | 0.46 |
| Total | 0.53 | 0.59 | ||
| NOTES: Column (3) is computed by subtracting column (1) from column (2) and multiplying by the respective weight of rent and OER in the overall PCE price index. Column (4) is computed similarly based on the weights of rent and OER in the core PCE price index. Core inflation measures exclude food and energy. SOURCES: Authors’ estimates based on data from the Bureau of Economic Analysis and Zillow. |
||||
Table 1 shows that, all else equal, the acceleration in rent and OER inflation by December 2023 would raise overall and core PCE inflation by about 0.5–0.6 percentage points relative to their prepandemic levels of 1.8 percent.
About the Authors

Xiaoqing Zhou
Zhou is a senior economist in the Research Department at the Federal Reserve Bank of Dallas.

Jim Dolmas
Dolmas is an economic policy advisor and senior economist in the Research Department at the Federal Reserve Bank of Dallas.
The views expressed are those of the authors and should not be attributed to the Federal Reserve Bank of Dallas or the Federal Reserve System.