What might inflation look like next year?
A spike in a narrow set of prices—notably for autos, airfares and hotels—has driven the rapid increase in inflation in 2021. Still, the inflation rate excluding these categories, as well as food, energy and housing services, was 2.8 percent over the 12 months ended in August 2021, up from 1.7 percent in February 2020.
This suggests the underlying pace of inflation has been strong, although more moderate than the headline rate. If inflation excluding these categories continues at 2.8 percent in 2022, core personal consumption expenditures (PCE) inflation is likely to be in the range of 2.2 percent to 3.2 percent, given a plausible range of scenarios for auto and housing prices.
In our baseline scenario, core inflation is 2.6 percent in 2022. If this occurs, core inflation will have averaged 2.4 percent over the last five years, moderately above the Fed’s 2.0 percent inflation target.
Extreme price movements in 2020, 2021
Recent inflation rates have increased to their highest levels since the early 1990s. In August, the 12-month PCE inflation rate was 4.3 percent compared with 1.3 percent at year-end 2020, while core PCE (the rate excluding food and energy) was 3.6 percent compared with 1.5 percent at year-end.
Sharp price increases in two categories drove the rapid price rise. Services that were depressed due to the pandemic—hotels and motels, public transportation (including airfare) and recreation—quickly rebounded in summer 2021. Secondly, motor vehicles, parts and rentals reflected price pressures from severe supply constraints and a semiconductor shortage. A third category, housing, will come into play later.
The pandemic category price index rose at a 34 percent annualized rate from February through August 2021 (Chart 1).
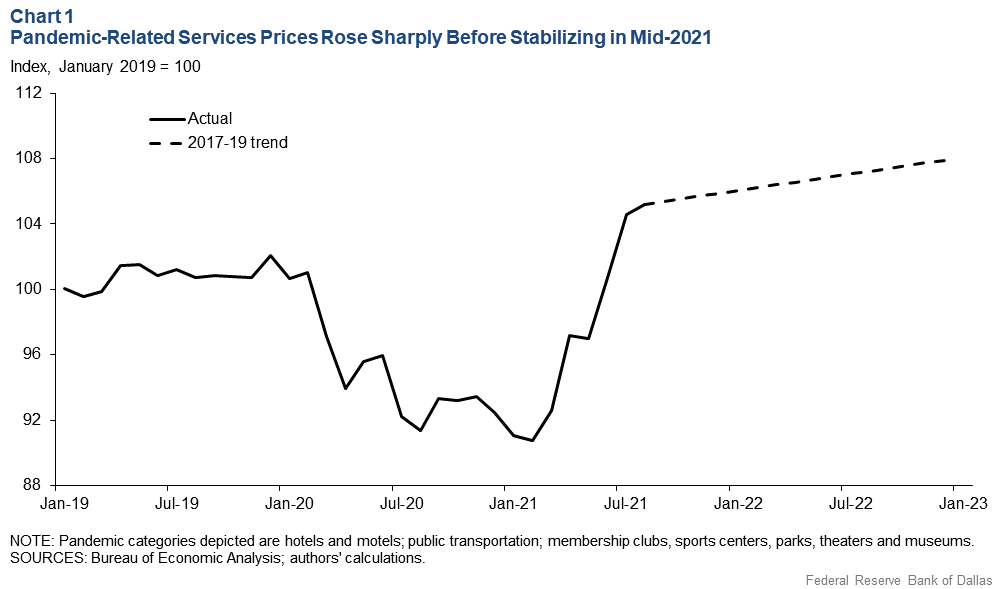
However, as of August, this index completely retraced the pandemic-related declines of 2020 and is roughly back to a level that would have been expected absent the outbreak. This suggests that these price pressures are likely to abate as the sector’s rebound is probably complete.
The motor vehicle category price index rose 29 percent from February to August 2021, but unlike the pandemic category price index, it remains significantly elevated from the prepandemic trend (Chart 2).
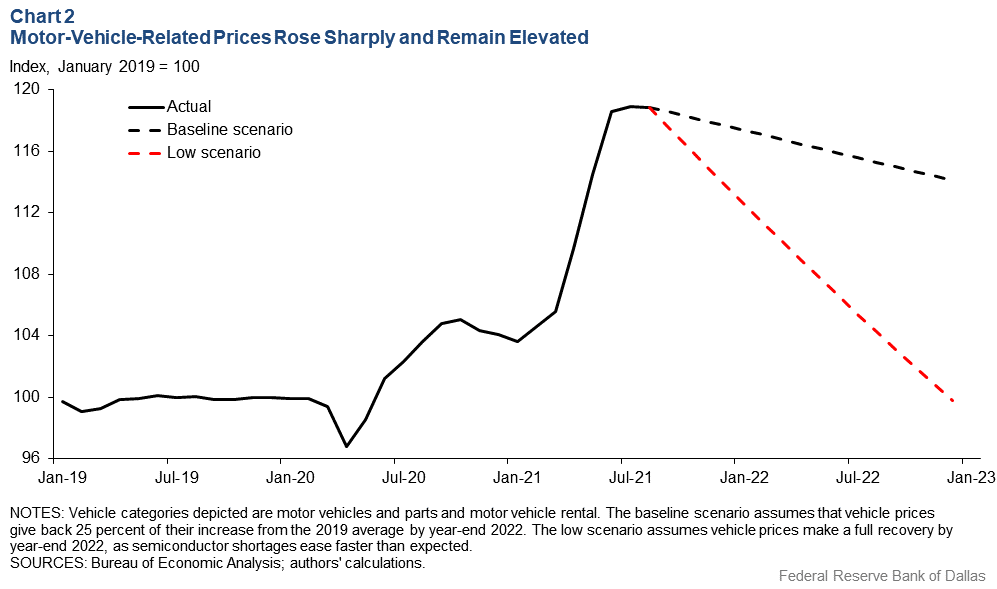
As supply constraints eventually ease and production of new vehicles ramps up, prices are likely to at least partially moderate, but there is considerable uncertainty surrounding the extent and pace of the price correction.
Housing prices appear poised to accelerate
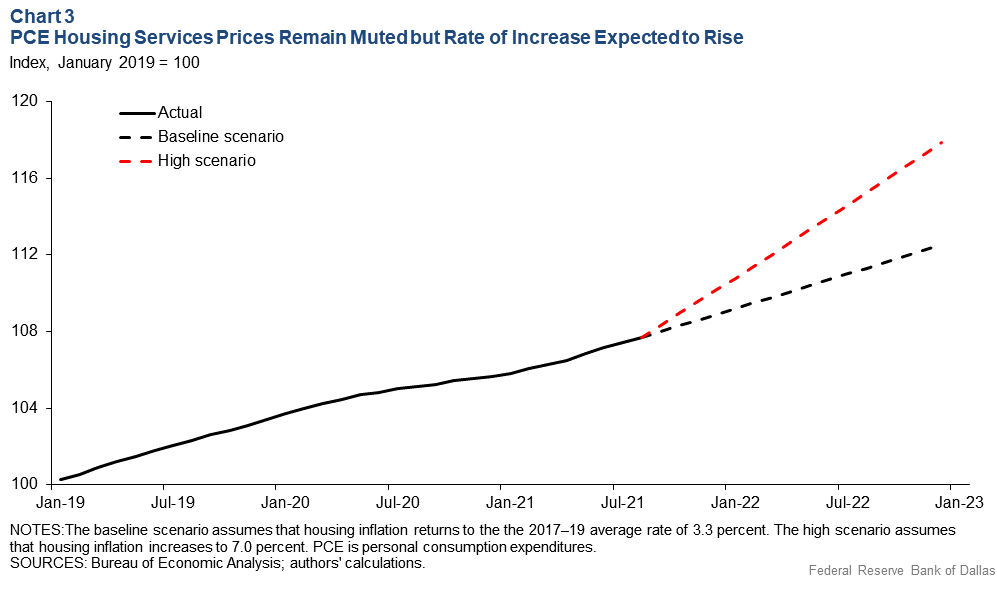
Meanwhile, the PCE price index for housing services—which includes owner’s equivalent rent (the amount of rent equivalent to the cost of ownership) and rent for tenant-occupied housing—was muted from mid-2020 to mid-2021, rising 2.4 percent following a 3.4 percent gain in 2019 (Chart 3).
However, movements in this price index tend to lag other indicators of housing prices, such as home values or listed apartment rental rates, which are more rapidly increasing than before the pandemic. For example, the Case-Shiller Home Price Index increased 19.7 percent in July over the previous 12 months, the highest increase on record dating back to 1976.
Listed rental prices increased 11.5 percent over the 12 months ended in August, compared with 3.4 percent in 2019, according to Zillow Group Inc., an online real estate services firm. This series measures the increase of rental prices for new apartment tenants, while the PCE rent price index reflects rents actually paid.
As leases expire, the PCE rent inflation rate should move toward the rate of listed rent increases. The Zillow listed rent series starts in 2014, so the magnitude of the coming acceleration in housing inflation is uncertain. Still, it is unlikely that the pace of housing services inflation in the PCE index will remain at its subdued rate.
Special factors have pushed all three of these price categories in directions and magnitudes that are unlikely to persist. Excluding these prices, as well as food and energy—which are typically volatile—should provide a clearer indication of the underlying pace of inflation heading into 2022. Removing these categories leaves us with an inflation rate of 2.8 percent over the 12 months ended in August 2021 (Chart 4).
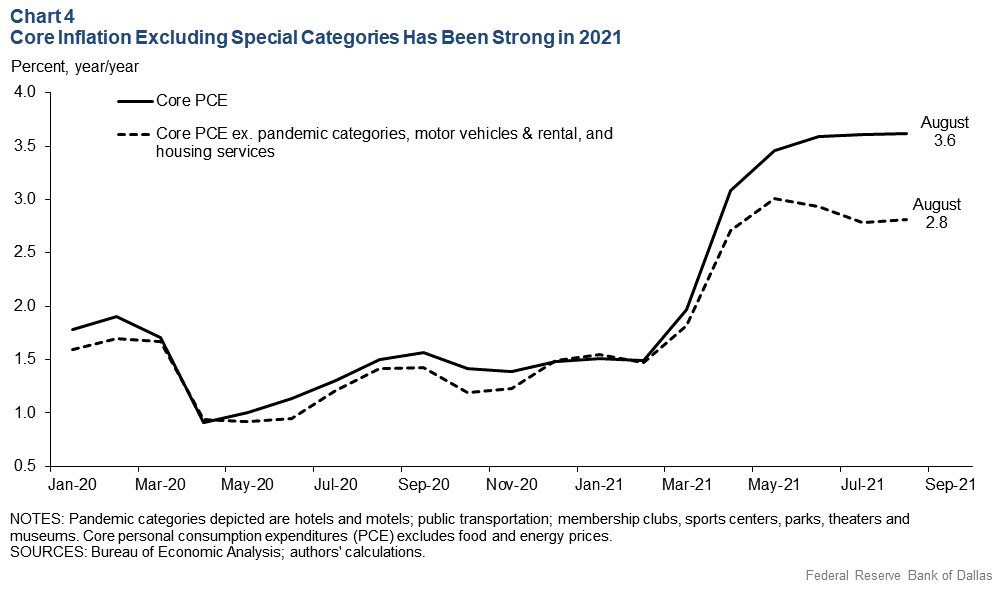
The rate absent the special factors is below the core PCE inflation rate (which excludes food and energy) of 3.6 percent. However, it is well above the February 2020 rate of 1.7 percent.
While it is true that a few special categories have driven the recent inflation spike, even after excluding them, inflation has accelerated above prepandemic rates. This is consistent with the Trimmed Mean PCE inflation rate, which exceeded 2.0 percent over the 12 months ended in August and reached an annualized 2.6 percent from February to August. This measure systematically removes the most-extreme price changes and captures the medium-term trend in inflation.
A simple exercise for 2022 inflation
What does this imply for the likely rate of inflation in 2022? Consistent with the widely held view that the pandemic-driven inflation spike has been largely concentrated in a narrow set of categories, suppose that the inflation rate excluding these special categories will remain near its most recent rate of 2.8 percent through 2022.
A simple exercise involves taking this rate for the non-excluded prices as given and then considering what alternative outcomes for the special price categories would imply for future core PCE inflation.
For vehicle prices, we take a baseline assumption that they will give back 25 percent of their increase from the 2019 average by the end of 2022 (the black dashed line in Chart 2). This scenario reflects widespread reports that the semiconductor shortage driving the high vehicle prices will last through much, if not all, of 2022. However, it is possible that the semiconductor shortage and normalization of prices will occur more quickly. This possibility is reflected in the alternative scenario, which assumes a full reversal in 2022 (the red dashed line in Chart 2).
For housing services prices, we take a baseline scenario that housing inflation returns to its 2017–19 average rate of 3.3 percent through year-end 2022. This is roughly consistent with the findings in a Dallas Fed Economics article in August that plotted the relationship between home prices and rents. That same article forecasted that housing inflation could reach nearly 7 percent in 2023, driven by the surge in home values. We consider the possibility that this occurs in 2022 instead of 2023 as an alternative scenario (the red dashed line in Chart 3) to highlight the upside risk to inflation from the rapid increase in home values and listed rents in 2021.
In all scenarios, we assume that the pandemic-sensitive services prices plotted in Chart 1 grow at their 2017–19 average annualized rate of 1.9 percent.
A range of plausible outcomes
Table 1 displays the implied core inflation rate in 2022 under each scenario, assuming the special price index in Chart 4 continues to rise 2.8 percent, which represents 75 percent of the core PCE consumption basket. If vehicles and house price indexes follow our baseline assumptions, the core PCE inflation rate would be 2.6 percent.
Table 1: Implied 2022 Core Inflation Rates
| Vehicle scenario | Housing scenario | Implied core inflation |
| Baseline | Baseline | 2.6% |
| Low | Baseline | 2.2% |
| Baseline | High | 3.2% |
If vehicle prices fully correct, the inflation rate would be 2.2 percent, just above the Federal Reserve’s long-term inflation target. If housing services prices increase at double the pace of 2017–19, the implied core PCE inflation rate would be 3.2 percent.
This simple exercise provides a wide range of plausible inflation outcomes, reflecting the considerable uncertainty surrounding the outlook driven by the unusual circumstances in several industries. It abstracts from uncertainty for core inflation excluding the special categories, which, of course, could come in higher or lower than 2.8 percent.
For example, if that rate comes in at 2.0 percent, then the rates in Table 1 would be 0.6 percentage points lower and centered around 2.0 percent. However, to obtain our base case of 2.6 percent core inflation next year, housing inflation need only accelerate to 2017–19 rates, with vehicle prices only partially reversing and everything else continuing at recent rates.
About the Authors

Tyler Atkinson
Atkinson is a senior business economist in the Research Department at the Federal Reserve Bank of Dallas.

Jonah Danziger
Danziger is a research analyst in the Research Department at the Federal Reserve Bank of Dallas.

Alexander W. Richter
Richter is an economic policy advisor and senior economist in the Research Department at the Federal Reserve Bank of Dallas.
The views expressed are those of the authors and should not be attributed to the Federal Reserve Bank of Dallas or the Federal Reserve System.