
Asset prices, leverage and portfolio rebalancing drive global capital flows cycle
Over the course of a global financial cycle, the prevalence of leverage—among investors and across nations—can explain fluctuations in gross and net capital flows, portfolio modeling shows. The amount of leverage—borrowed funds relative to the value of underlying assets—increases for risky holdings during downturns, motivating their ultimate sale to achieve a more secure financial position. The opposite occurs during upswings, as risky assets gain favor.
Monitoring capital inflows, outflows
Global trade and capital flow imbalances are commonly captured by the absolute value of current account imbalances. The current account is equal to net capital outflows—the value of foreign assets purchased by domestic residents minus the value of domestic assets purchased by foreign residents.
Current account surpluses appear to fluctuate around 1 percent of gross domestic product (GDP) from the early 1980s to the early 2000s (Chart 1). Thus, for the average surplus, country net outflows totaled 1 percent of GDP in a given year; for the average deficit, country net inflows totaled 1 percent of GDP.
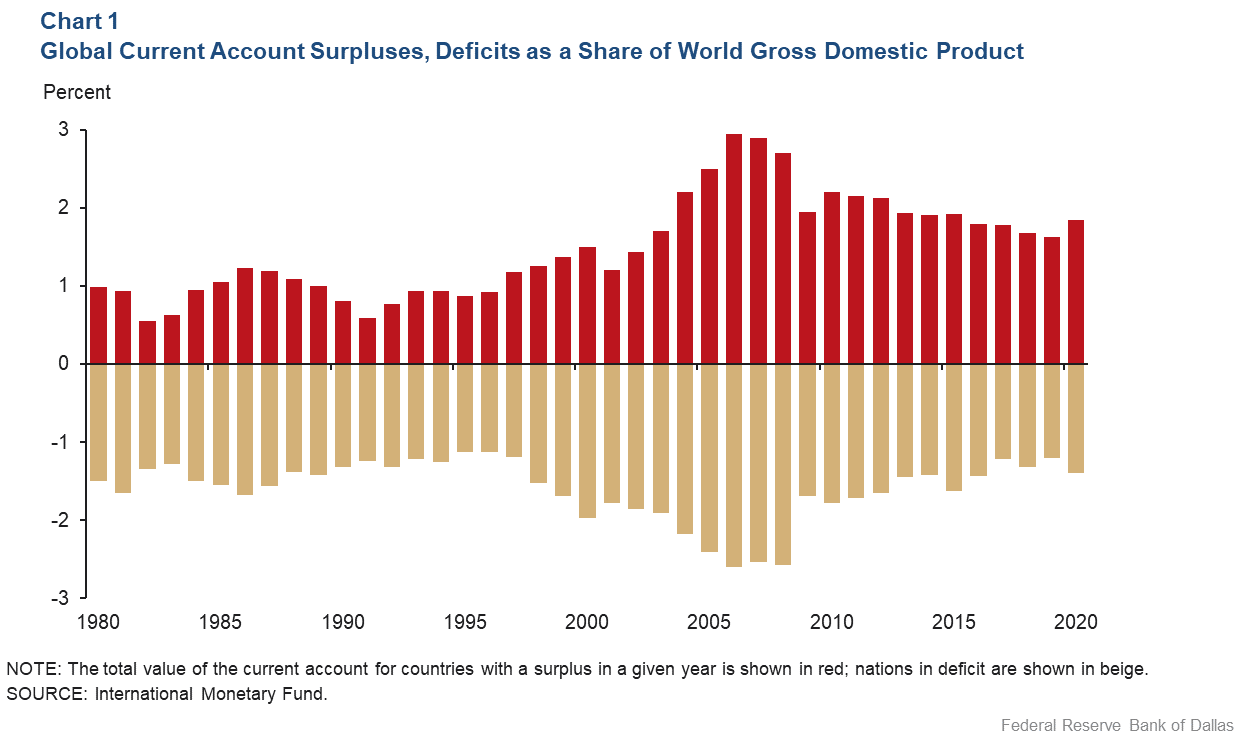
These imbalances seem to follow a cycle, sometimes rising above 1 percent (in the mid-1980s or in the late 1990s), but at other times falling to around 0.5 percent (in the early 1980s or the early 1990s). The average imbalance then grew to nearly 3 percent of GDP by 2007, before falling back below 2 percent.
There is a similar cycle in gross capital outflows—the value of foreign assets purchased by domestic residents. In 1983, gross capital outflows were less than 2 percent of GDP; by the late 1980s, they had risen to more than 4 percent of GDP, only to fall back to slightly more than 2 percent in 1991 (Chart 2).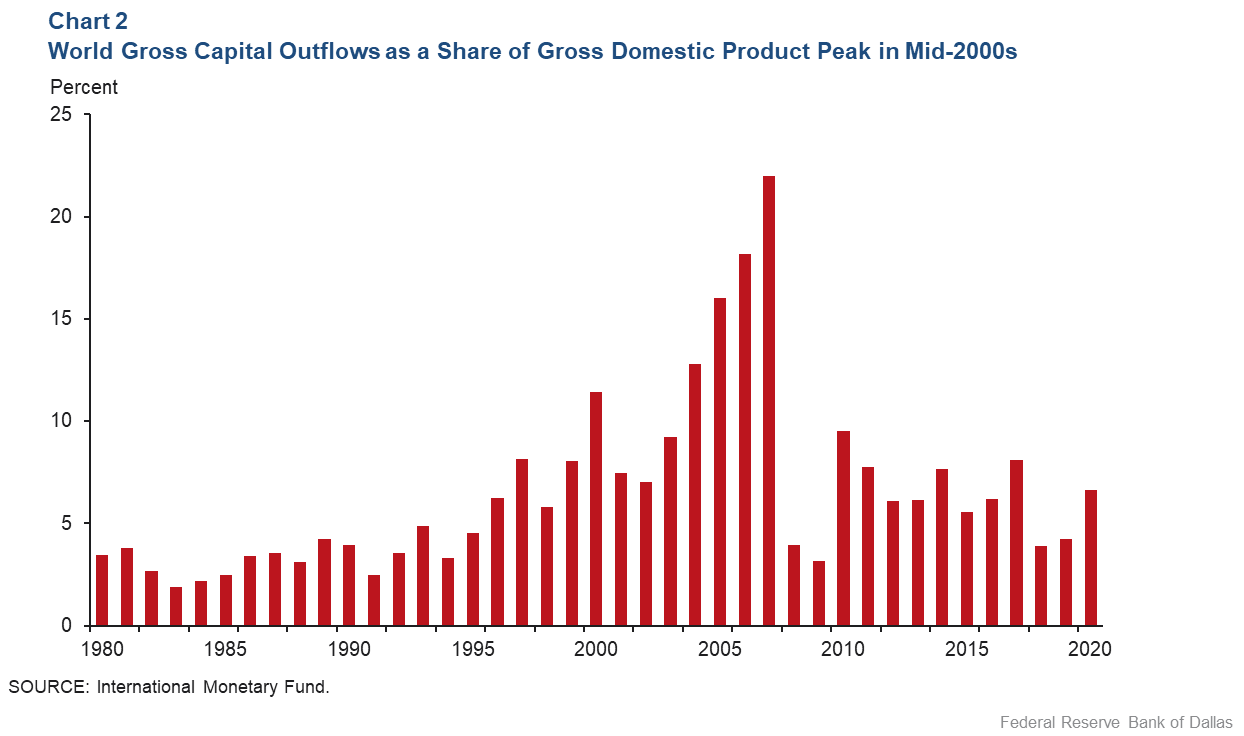
By 2000, they had grown to 10 percent of GDP before falling back again, and then climbing to an astonishing 22 percent in 2007 before collapsing to 3 percent in 2009.
Searching for a common cycle to world gross outflows, net capital flows
In a recent paper (“Global Drivers of Gross and Net Capital Flows”), we show a common global trend to gross capital flows of individual countries. In a variance decomposition, we find that fluctuations in this trend explain nearly 40 percent of the variance of gross capital flows and nearly 25 percent of the variance of net capital flows in the average advanced or emerging-market country.
Moreover, during an upturn in the global financial cycle, when world asset prices rise, global imbalances widen (deficit countries run larger current account deficits, and surplus countries run larger surpluses), but during a downturn in the global financial cycle, global imbalances contract.
A second paper (“A Theory of the Global Financial Cycle”) expands on this finding. We look not only at total gross and net capital flows but also at flows in safe assets (bonds) and flows in risky assets (equity).
We show that countries with a negative net foreign-asset position in safe assets (leveraged countries) see an increase in net outflows of risky assets and a decrease in net outflows of safe assets during an upturn in the global financial cycle. These leveraged countries issue debt (sell bonds, a negative outflow of safe assets) to finance the purchase of equity (a positive net outflow of risky assets). Leveraged countries thus become even more leveraged.
The opposite happens during a downturn in the global financial cycle. Highly leveraged countries see a decrease in net outflows of risky assets and an increase in net outflows of safe assets. During a downturn, they sell risky assets to pay off debt.
Modeling the capital flows cycle
We develop a theory linking global shocks to risk aversion, fluctuations in risky asset prices and fluctuations in gross and net capital flows in both safe and risky assets. We model capital flows as shifts in the portfolio choices of domestic and foreign investors following a global shock to risk aversion.
In the model, we show that investor heterogeneity in leverage—differences among investors in the amount of assets acquired with borrowed funds—can explain the behavior of both gross and net capital flows over the global financial cycle.
Consider a rise in global risk aversion, which lowers risky asset prices. Investors who were highly leveraged before the shock will see their leverage increase as their assets’ value falls, but their liabilities do not. These investors will seek to rebalance and lower their leverage by selling risky assets, using the proceeds to pay off debt by buying safe assets. Unleveraged investors will do the opposite. The fall in asset prices will lower their portfolio share in risky assets. They will rebalance by buying risky assets and selling safe assets.
When the heterogeneity in leverage is across investors in different countries, some countries have a negative net foreign-asset position in safe assets (are leveraged), while others have a positive net foreign-asset position in safe assets (are unleveraged). During a downturn in the global financial cycle, leveraged countries rebalance by selling risky assets to pay off debt, while unleveraged countries do the opposite. The model explains the cross-country differences in the behavior of net safe and risky asset flows over the global financial cycle.
But this does not explain fluctuations in gross capital flows. For this, one needs to add heterogeneity across investors in the same country. But heterogeneity in leverage cannot by itself explain fluctuations in gross capital flows over the global financial cycle. In the rebalancing following a decline in asset prices, leveraged investors sell risky assets to unleveraged investors in the same country. However, as long as leveraged and unleveraged investors have the same demand for home and foreign assets, there is no change in the aggregate willingness to hold foreign assets (and thus no change in gross outflows).
But when this heterogeneity in investor leverage is accompanied by heterogeneity in investor preference for home assets with highly leveraged investors also holding a portfolio with a larger share of foreign assets, the portfolio choice model can explain the decline in gross flows during a downturn in the global financial cycle.
When rebalancing, leveraged investors sell a basket of home and foreign risky assets, but unleveraged investors in the same country only demand home risky assets and, thus, in equilibrium, the home-country-leveraged investors sell their foreign assets to foreign-country-unleveraged investors, resulting in a fall in gross capital outflows.
Net safe and risky asset flows in early 2000s
The U.S. and Japan between 2002 and 2009 provide a useful example.
Our work suggests that this global financial cycle reached a bottom in 2002, peaked in 2007 and then bottomed again in 2009. In 2002, the U.S. held a net foreign-asset position in safe assets of -23 percent of GDP, and Japan had a net foreign-asset position in safe assets of +33 percent of GDP. Chart 3 plots the net outflows in safe assets in the U.S. and Japan in 2002, 2007 and 2009.
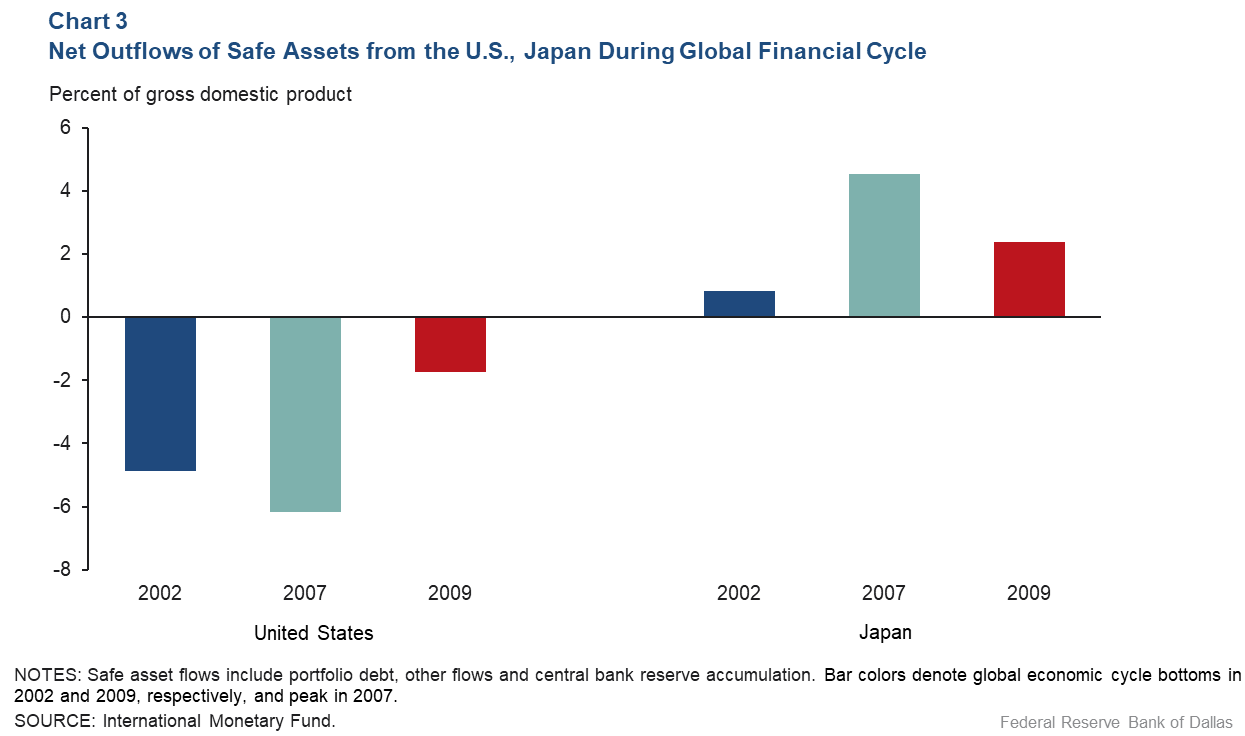
Chart 4 similarly depicts the net outflows of risky assets. Between 2002 and 2007, net outflows of safe assets in the U.S. fell, and net outflows of risky assets rose. The rise in risky asset prices over this period reduced leverage in the U.S.
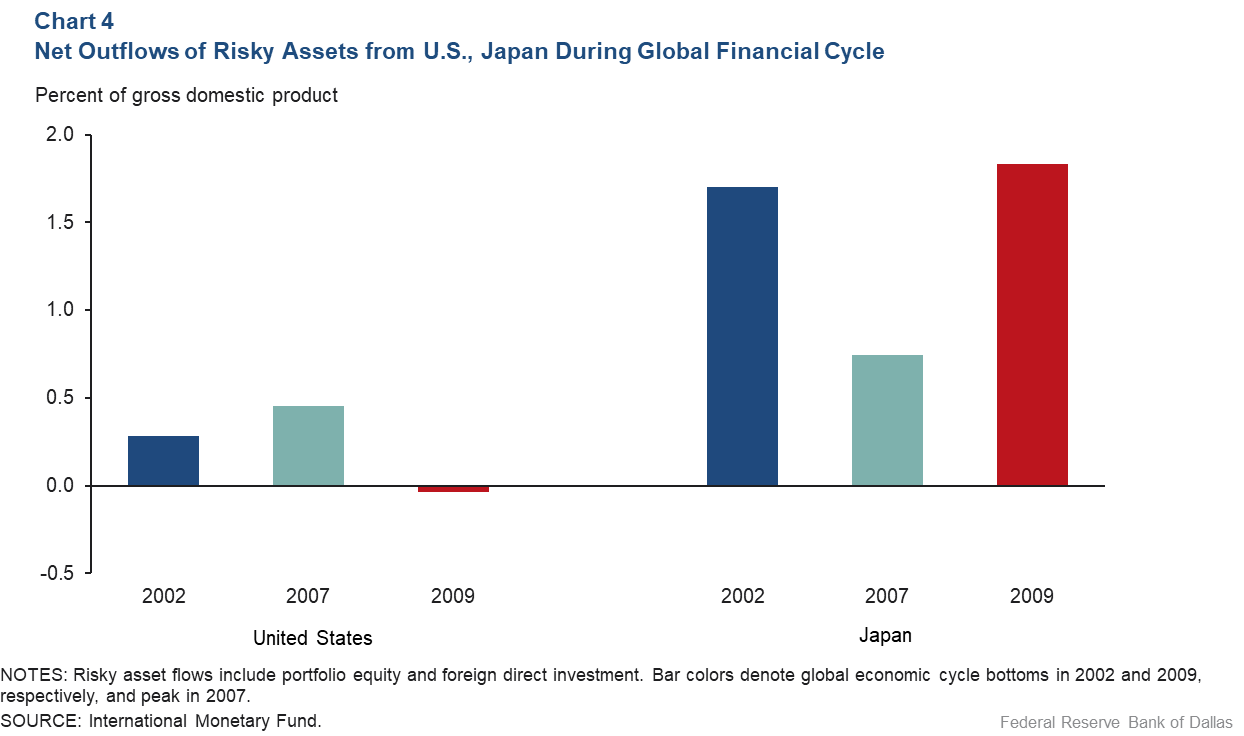
The movements in net flows in safe and risky assets reflect the desire of U.S. investors to rebalance to preferred levels of leverage by taking on more debt to buy more risky assets. Japanese investors do the opposite since the increase in global risky asset prices raises their portfolio share in risky assets.
This entire process went into reverse during a downturn in the global financial cycle and the fall in world asset prices between 2007 and 2009, where U.S. net outflows in safe assets increased and net outflows in risky assets fell.
About the Authors
The views expressed are those of the authors and should not be attributed to the Federal Reserve Bank of Dallas or the Federal Reserve System.