Expiring solar tax credits shine a light on benefit inequities
The One Big Beautiful Bill Act, a broad package of federal spending and tax policies signed into law in July 2025, spells trouble for the residential solar industry. The law ends a large subsidy for residential consumers at year-end 2025.
It will also alter the broad distribution of tax benefits and the geographic dispersal of solar resources, though these changes will appear over time. While residential solar is very visible to the public, utility-scale solar dominates the overall market.
Tax subsidies supported solar expansion
Solar power’s expansion across much of the world coincided with government subsidies. Tax credits were the favored method of supporting solar energy in the U.S. Generally, an individual or business investing in solar energy could receive a tax credit equal to some percentage of the outlay.
The provision covered both residential installations and industrial development. After installing solar panels, residential consumers could claim a residential solar tax credit when they filed their taxes.
The residential solar tax credit is not new, and debate about the subsidy’s existence and its form have persisted since a Carter administration-backed measure created the first tax credit for solar system installation in 1978. The provision expired in 1985 under the Reagan administration and returned when President George W. Bush signed The Energy Policy Act into law nearly 20 years later, re-establishing the residential tax credit for solar energy.
It has endured in some form ever since, with extensions and marginal changes over the years. Under the Biden administration’s Inflation Reduction Act, signed into law in August 2022, the residential credit for solar energy investment increased to 30 percent of qualified investment costs, up from 26 percent. The provision was to begin phasing out after 2032.
The One Big Beautiful Bill Act, signed within the first six months of the second Trump administration, removed tax credit eligibility for any system placed in service after Dec. 31. It will also mark the end of two decades during which a tax credit has been in place.
Residential solar credit often excludes low-income households
Although available to all households, solar tax credits don’t get much take-up among low-income households. The average cost of a household solar system is a little over $29,000. Assuming the installation fully qualifies for the 30 percent tax credit in 2025, the net-cost of the solar system would be roughly $20,000 ($29,000 sticker price minus the $8,700 credit).
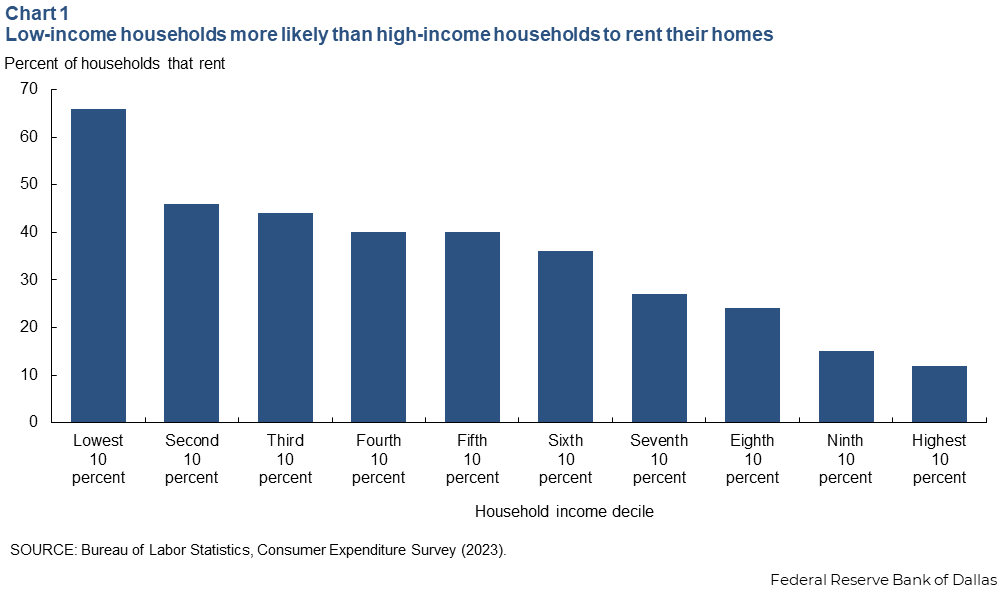
Low-income households do not commonly have $29,000 in available cash (apart from the tax credit) for the up-front cost of installation. Even if they did, these households are more likely to rent rather than own their housing, which means they often do not have the option to install solar panels even if they had the money (Chart 1).
Thus, high income earners receive most of the benefit from the residential clean energy credit (Chart 2). Just under 1.25 million tax returns had residential energy credit attached in the 2023 tax year. The credit claimed that year totaled $6.3 billion.
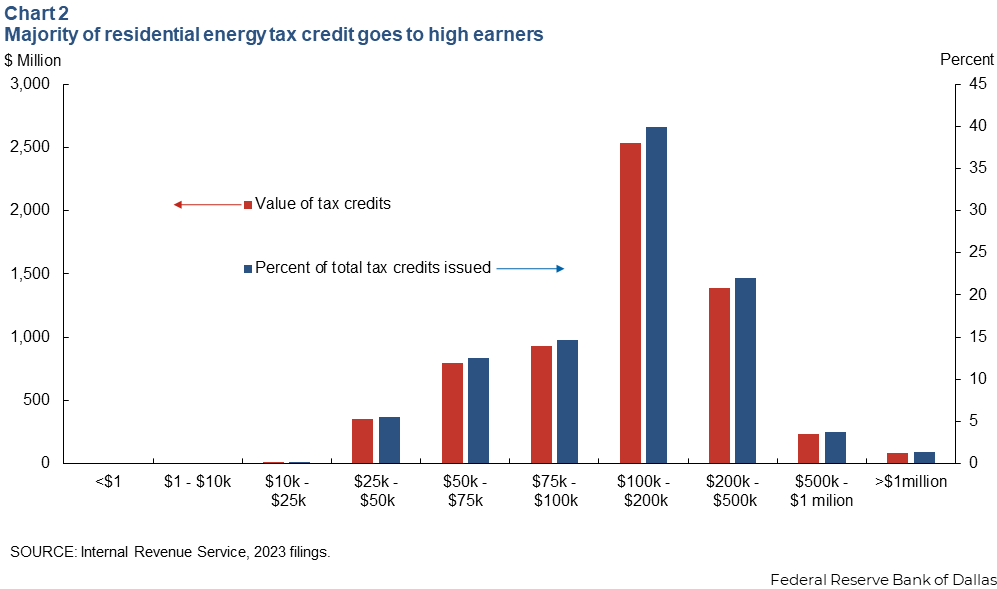
About two-thirds of all credited dollars went to those reporting more than $100,000 in annual income. This group represents only around 24 percent of tax filers.
The form of the tax credit is another limiting factor for low-income households that might opt for a solar system. The credit is not fully refundable—that is, it cannot exceed the taxpayer’s annual tax liability.
The $8,700 solar tax credit in this example would exceed the annual tax bill for many low-income households. To obtain a credit, such a taxpayer would need to either spread the credit over several years or install a smaller system, lowering the present value of a full solar tax credit relative to an upper-income household that could take the entire credit at once.
Energy consumption skews toward high-incomes households
The distribution of energy consumption by income level often isn’t included in the analysis of who benefits from the residential energy tax credit.
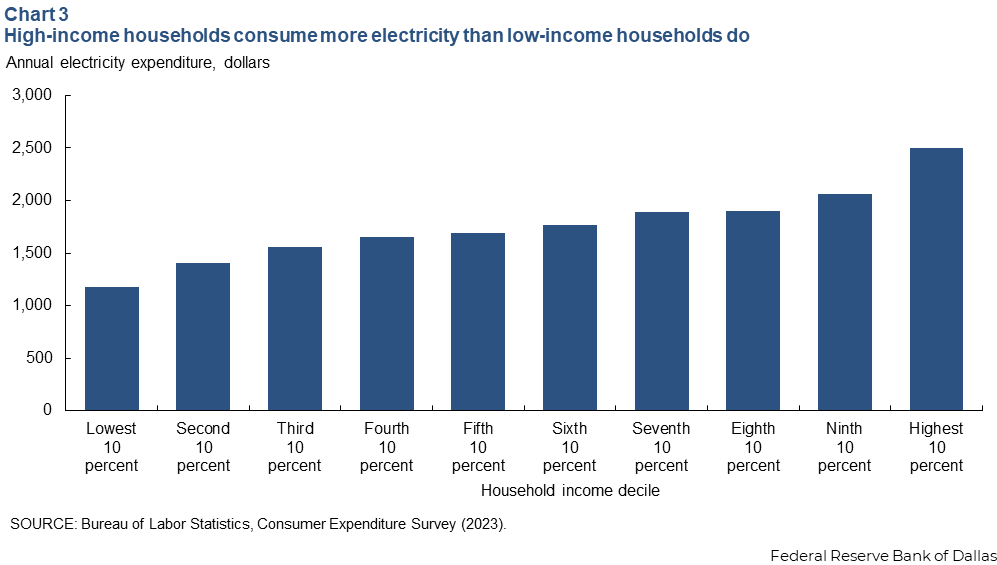
While distribution of benefits from residential energy tax credits favors upper-income households, those groups also consume more energy than their low-income counterparts (Chart 3).
Insofar that reduced grid demand is a beneficial byproduct of residential solar systems, a policy whose distribution skews toward upper-income households might reduce grid stress more relative to a flat subsidy. However, solar panels also induce demand for energy consumption.
Solar panels, by subsidizing a household’s variable energy costs, incentivize those same households to consume more. This might come in the form of purchasing an electric vehicle or through other household electrification, such as switching to electric cook tops and heating or purchasing additional appliances. There is reason to believe that although residential solar has net-reduction effects on grid consumption, residential solar does not one-for-one displace grid consumption.
The raw distribution of residential tax credit masks its complicated effects. While high-income households disproportionately benefit from residential tax credits, they also disproportionately contribute to grid demand.
Residential consumption makes up small overall share
Even though residential solar installations might be the most visible form of solar energy, these systems contribute a small (and shrinking) fraction of solar investment.
The residential segment accounted for just more than 20 percent of solar installations in 2015. The share shrank to just over 17 percent in 2024. The decline reflects, in part, maturation and economies of scale for the solar industry, which has made utility-scale developments more competitive.
For example, a typical home solar system might have an 8 kilowatt to 12 kilowatt capacity, while a typical utility-scale solar farm of 150 megawatts is more than 10,000 times larger and is assembled at a steep per-unit discount on construction cost.
Residential solar also is not always the most economically efficient use of the marginal solar resource, since many areas in the country, such as Washington state, do not receive nearly the level of sun that Texas and Arizona do. The residential solar tax credit, by offering the same cost-based subsidy independent of geography, caused deployment of solar resources in suboptimal solar resource areas (Chart 4).
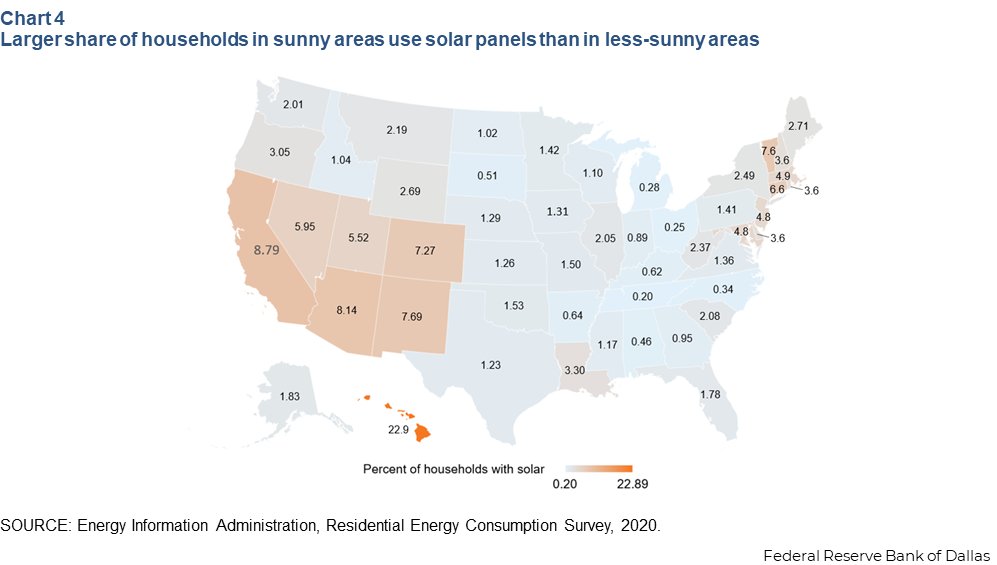
For instance, when a Seattle homeowner reviews the cost and benefit of a solar system, the subsidy significantly affects the break-even calculation. In a less subsidized environment, solar panels need to produce much more sunlight or utility savings to make sense for residential consumers. That is not always possible for someone living in a low-sunlight area such as Seattle.
Fewer home panels doesn’t mean less solar
While a full repeal of the residential energy tax credit likely leads to a decrease in residential installations, the growth of utility-scale projects will at least partially offset the impact, particularly with the future siting of marginal panels more likely in higher sunlight areas.
This moment of change in the solar industry will likely more progressively distribute benefits under the remaining tax credit system, all else equal. The residential share of development will shrink because of One Big Beautiful Bill Act provisions.
However, utility-scale developers will have an easier time surviving the act’s impacts because of better project economics and a more favorable subsidy expiration schedule that in some cases runs until 2027.
Finally, the marginal solar resource will likely concentrate further toward areas of the country with greater sunlight. The lack of a broad subsidy will cause remaining developers and customers to tilt further toward the most solar-rich areas to get the most out of their panels.
About the authors

Cameron Barrett is a senior business economist in the Research Department of the Federal Reserve Bank of Dallas.