Measures of inflation misalign with pricier home insurance
Homeowners insurance is a cornerstone of household financial security. It protects what is often a household’s largest asset. Homeowners insurance is required in order to obtain and maintain a mortgage, and roughly 80 percent of U.S. homeowners carry it.
In recent years, however, the cost of insuring a home has risen sharply. Across the country, homeowners face rising premiums and growing uncertainty about whether insurance will remain affordable in areas prone to natural disasters. As a result, consumers, regulators and policymakers across the country are closely watching the price of such coverage.
We explore the magnitude of the increases and how they are distributed across the country, using recently available data from ICE McDash, a source of mortgage performance information. ICE McDash captures actual homeowner insurance payments for mortgagees, covering roughly two-thirds of the U.S. mortgage market.
The average homeowner with a mortgage spent about $2,300 per year on homeowners insurance in 2024. That represents roughly 2.7 percent of median household income, up from about 2 percent before the pandemic. While that difference may sound modest, it translates into hundreds of dollars per year for many households on top of higher mortgage rates, property taxes and maintenance costs.
National averages mask large regional differences. Insurance premiums depend heavily on location and are a function of local construction costs, natural disaster risk and state insurance regulations. Nationally, insurance premiums rose 62 percent between 2019 and 2024, ICE McDash data show.
However, several states experienced significantly larger increases (Chart 1).
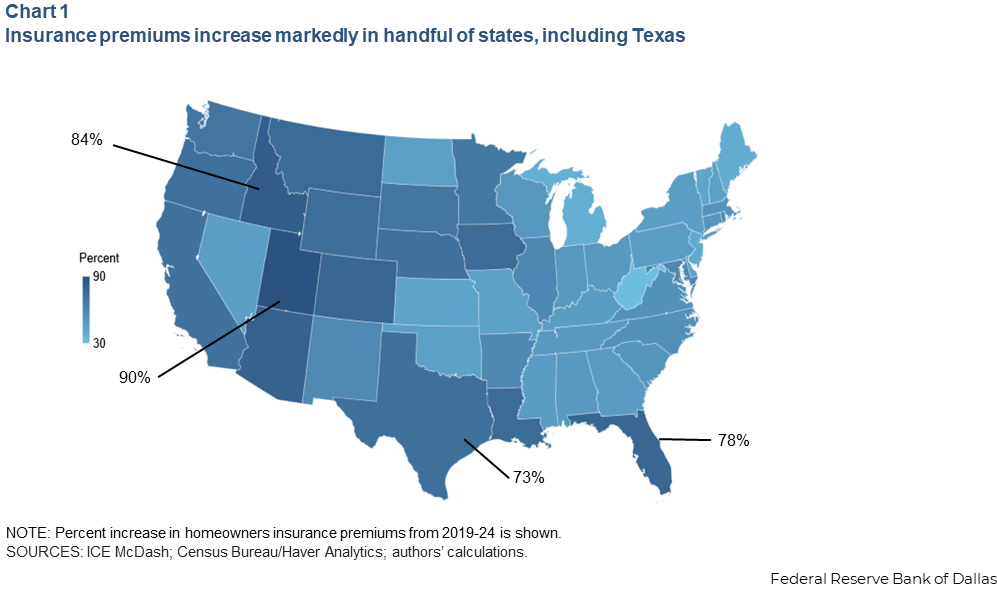
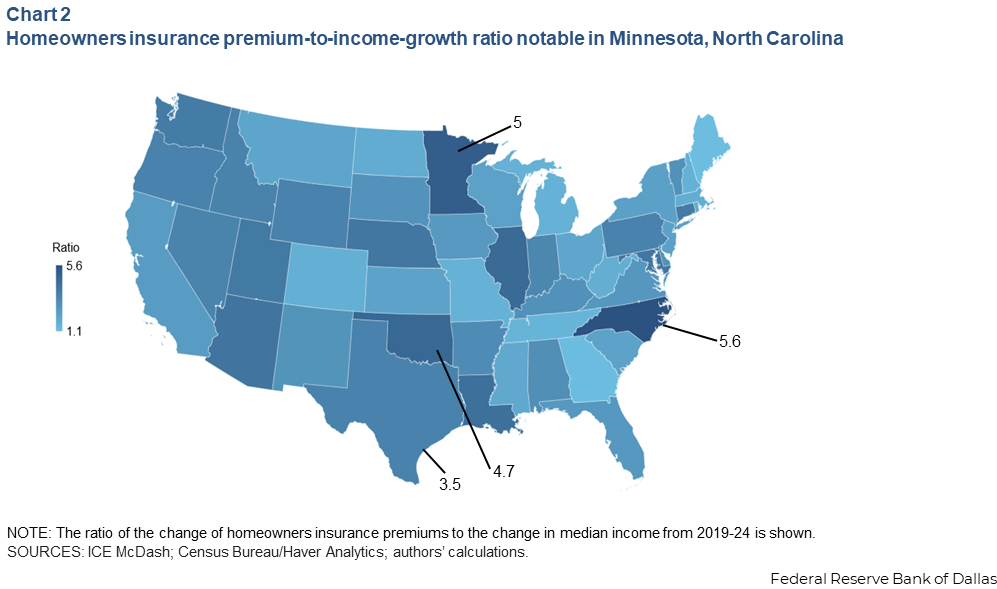
Premiums rose roughly 73 percent in Texas, 78 percent in Florida, 84 percent in Idaho and 90 percent in Utah. Insurance premium growth outpaced income growth across most states, reaching at least five times the growth in median income in Minnesota and North Carolina (Chart 2). For households already stretched thin by rising housing costs, insurance is becoming a meaningful source of financial strain, raising affordability concerns.
Several forces are driving the insurance premium increase. During the pandemic, rebuilding costs surged as labor shortages and supply-chain disruptions pushed up construction prices. But premiums were already climbing before the pandemic. Over the past decade, insured losses from natural disasters have risen steadily, reflecting more frequent and severe hurricanes, floods, wildfires and storms. Increased migration of households into disaster-prone areas exacerbated the trend.
Natural disasters pose a unique challenge for insurers. Unlike isolated events, they generate large, difficult-to-predict correlated losses, with many policyholders filing claims at once. Insurers increasingly rely on reinsurance, insurance for insurance companies, to manage this risk. In recent years, reinsurance costs have risen sharply, further pressuring the underlying premiums homeowners pay when these costs are passed through.
Inflation indexes partially reflect premium rise
Despite the increase in homeowners insurance, official inflation indexes only partially reflect rising insurance costs. That is by design. Inflation in the U.S. is tracked primarily using the Consumer Price Index (CPI) and the personal consumption expenditures (PCE) index. CPI is used for cost-of-living adjustments to Social Security and other federal benefits, while PCE is the Federal Reserve’s preferred gauge as it develops monetary policy.
To better understand how insurance costs have evolved, we return to the ICE McDash data on homeowners insurance premiums. Compared with the CPI and PCE, ICE McDash more accurately reflects the real dollar amounts households pay year after year on homeowners insurance premiums.
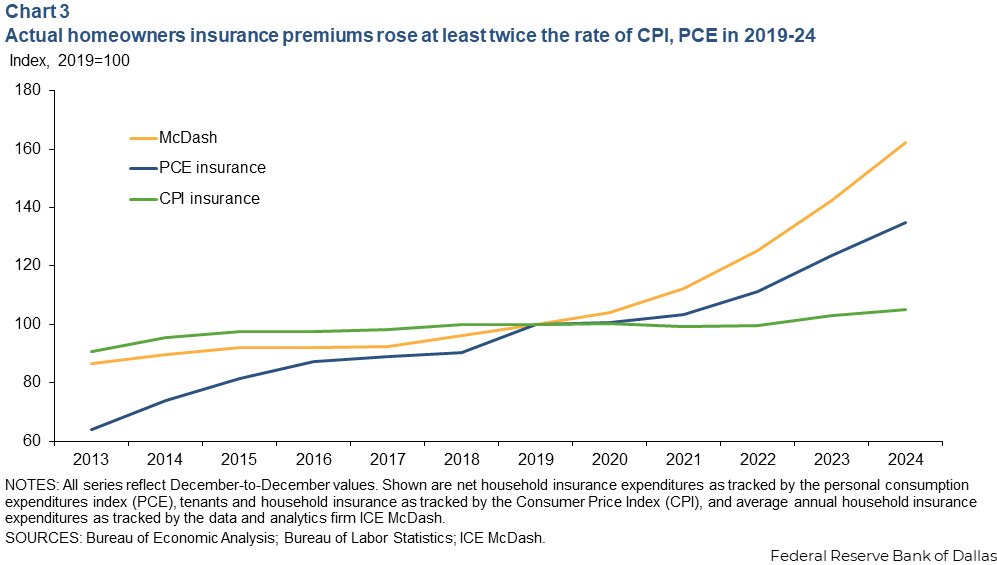
The national 62 percent increase from 2019 to 2024 reported by ICE McDash is nearly twice the rate of the net household insurance component captured by PCE, 35 percent (Chart 3). The tenant and household insurance component of CPI increased by just 5 percent over the period, remaining relatively flat and substantially understating the increase homeowners faced.
How inflation is measured varies
A closer look at CPI and PCE reveals differences in how the measures account for homeowners’ housing costs. Both CPI and PCE aim to capture trends in consumption spending. Rather than treating a home as both a place to live and as an investment, both indexes aim to measure the consumption value of what households effectively pay solely for shelter.
With this consumption-based approach in mind, CPI and PCE adjust insurance expenditures and compute insurance costs indirectly. Both measures seek to exclude the portion of the insurance premium that covers the dwelling.
The CPI tenants and homeowners insurance component is measured using premiums for renters insurance policies, which primarily cover personal belongings, and costs only a fraction of a typical homeowners policy.
PCE takes a different approach. The direct measure is called net household insurance. It measures the value of the service that insurance provides and excludes the portion of the premium homeowners would receive on average were a claim filed following an incident. In practice, this is calculated as total premiums paid minus insurers’ expected losses weighted by the portion of the premium that covers personal belongings and liability. Expected losses are based on historical long-run averages. This component made up just 0.1 percent of overall PCE consumption in 2024.
Chart 4 plots the premiums losses, and net household insurance components from PCE alongside average premiums from ICE McDash, again indexed to 2019.
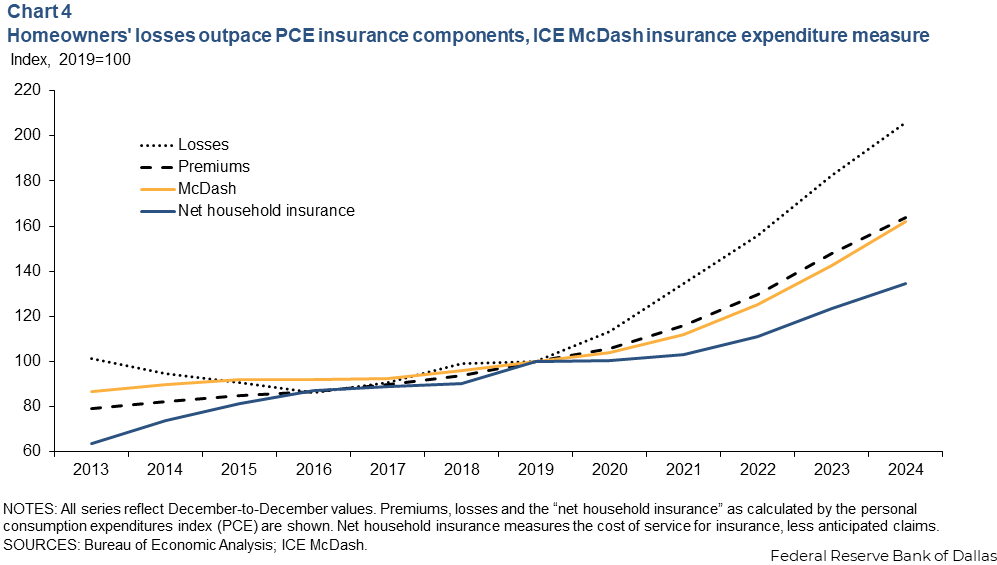
Between 2019 and 2024, insurer losses doubled, driven by higher replacement costs and increased catastrophe losses, while premiums rose 64 percent in PCE and by 62 percent in ICE McDash. Excluding the loss component results in the much lower 35 percent growth of the PCE’s net household insurance inflation index.
PCE appropriately nets out expected losses and measures insurance as the service priced into premiums, excluding the transfer-like payouts returned to households through claims. Thus, PCE insurance inflation can appear muted relative to what households are experiencing.
Premium growth is likely to ease through year-end 2026. Profitability for insurance companies has recovered despite continued elevated catastrophe losses, and U.S. reinsurance rates have begun decreasing after increasing 107 percent between 2019 and 2024. If losses continue growing faster than premiums, PCE inflation won’t reflect the full effect of the homeowners insurance affordability shock.
Rents feature low ‘pass-through’ effect
Another way homeowners insurance could show up in inflation measures is through rent prices. Landlords can pass through higher homeowners insurance costs to tenant rent. Rent constitutes a much larger component in PCE than the weight given to homeowners insurance, and therefore can potentially affect more substantially core PCE (which excludes food and energy).
However, Federal Reserve Board researchers find that pass-through of insurance prices to rent is very low. The researchers measure changes in commercial insurance, which like homeowners insurance, has risen sharply in recent years, increasing by roughly 75 percent between 2019 and 2024.
Commercial insurance is less regulated than homeowners insurance, suggesting that rents could respond more quickly to rising insurance costs for multifamily properties. Using those estimates, we calculate that a 75 percent increase in commercial property insurance is associated with a rent increase of less than 0.1 percent of total PCE inflation over the 2019–24 period.
Affordability and inflation differ
Despite a 62 percent increase in homeowners insurance premiums since 2019, neither CPI nor PCE fully reflects this rapid growth. PCE measures insurance premiums net of expected payouts, the key distinction between measuring the growth in premiums in PCE relative to ICE McDash.
Additionally, the component weight of household insurance in PCE at less than 0.1 percent minimally affects core PCE. CPI similarly understates affordability pressures because it uses renters insurance policies, which represent only a fraction of a typical homeowners policy and have trended differently in recent years.
Insurance costs may enter inflation indirectly through rents if landlords pass higher premiums on to tenants, though recent evidence suggests this pass-through is low.
Overall, homeowners insurance is becoming less affordable, yet this deterioration in affordability is not well captured by either of the most widely used inflation measures—CPI or PCE—both designed to track price levels rather than affordability or household financial strain.
About the authors

Rachel A. Jones is a research analyst in the Research Department at the Federal Reserve Bank of Dallas.

Reid Taylor is a research economist in the Research Department at the Federal Reserve Bank of Dallas.

Nitzan Tzur-Ilan is a senior research economist in the Research Department at the Federal Reserve Bank of Dallas.