What drives mortgage rates and their response to monetary policy changes
The overnight federal funds rate is the primary tool of U.S. monetary policy. Other tools, such as large-scale asset purchases or forward guidance, come into play only when necessary. However, the impact of monetary policy actions on the real economy is transmitted through a broader array of interest rates more representative of actual end-user borrowing costs.
Of these, the 30-year mortgage rate receives much attention. Especially in times when the Fed might seek to stimulate the economy through lower borrowing rates, the mortgage market can be an efficient channel because most mortgages can be refinanced without penalty. This enables fast pass-through of monetary stimulus to consumers.
Monetary policy pass-through occurs via three main channels. Mortgage rates work directly by affecting the user cost of capital associated with housing. This occurs because higher rates lead to higher mortgage payments, decreasing demand for new housing construction, home sales and durable goods purchases such as home furnishings. Mortgage rates also influence house prices, causing secondary effects on consumption via the housing wealth effect. Finally, changes in mortgage rates can affect household cash flows via refinancings, though these impacts are generally small.
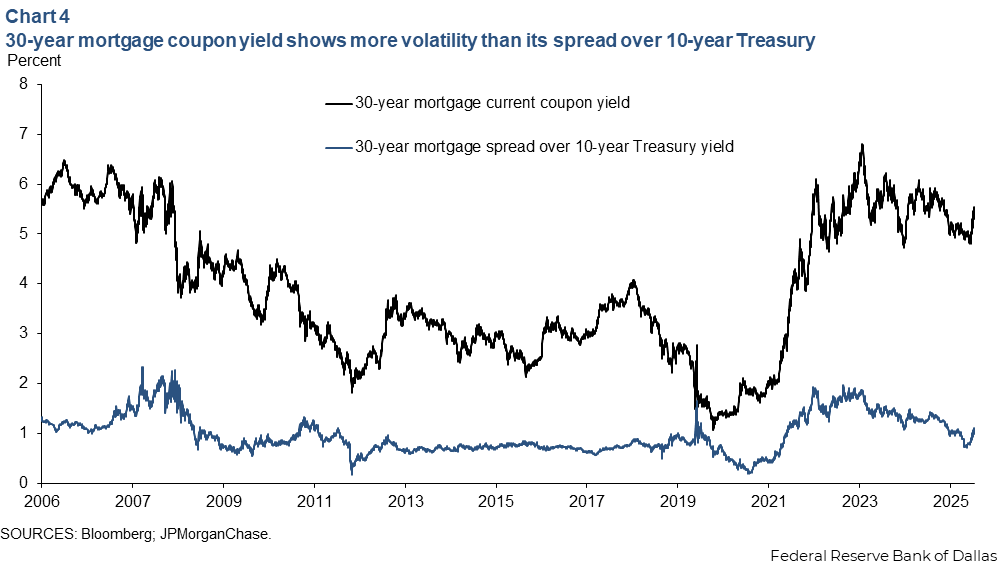
Mortgage rates are thus an important component of financial conditions and monetary policy pass-through. But there is no direct link between the policy rate and mortgage rates. The difference between the 30-year primary mortgage rate and the fed funds target has been as tight as 70 basis points and as wide as 600 basis points (Chart 1). In other words, the magnitude of the variation of this spread is comparable in magnitude to the variation in policy rates themselves.
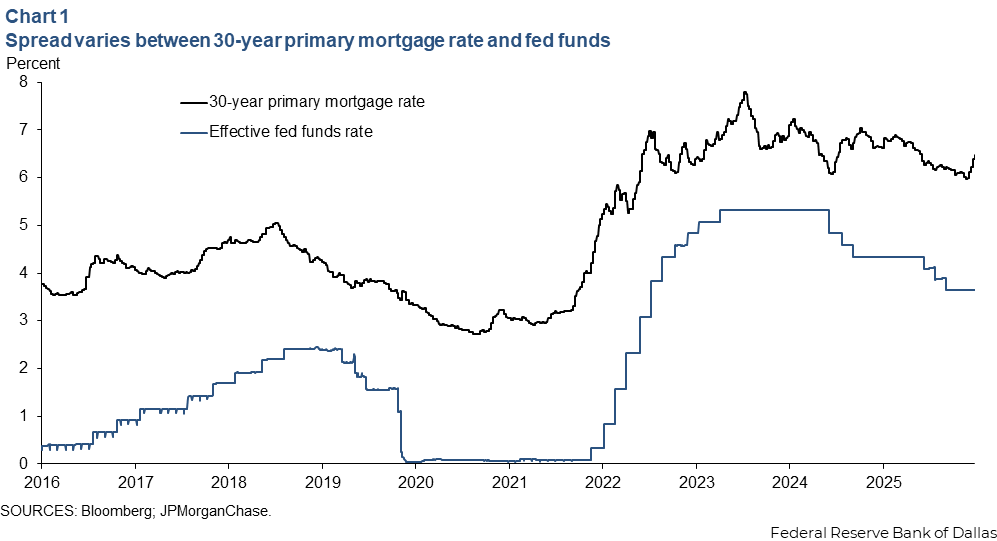
One consequence is that movement of the spread may damp the pass-through of potential monetary policy actions to mortgage rates. This has been the case over the past 18 months. Although the fed funds rate is 175 basis points lower than the mid-September 2024 level, mortgage rates are little changed on net. A better understanding of the factors influencing the mortgage rate (relative to the policy rate) would likely be useful. We seek to shed light on the factors that drive mortgage rates, with a view toward understanding their response to changes in the stance of monetary policy.
Mortgage structure determines mortgage, market rate relationship
We focus here on the secondary market rate on agency mortgage-backed securities (MBS), as this is the most important determinant of what most mortgage borrowers face. Why this is true requires some explanation.
Agency securitization is the dominant financing channel for mortgages in the United States. In the first half of 2025, roughly two-thirds of mortgages in the U.S. were securitized via government sponsored enterprises (GSEs)—agency guarantors Ginnie Mae, Fannie Mae and Freddie Mac. The types of mortgages financed through other channels often differ in credit and early payment characteristics that affect their pricing. For agency mortgages, the rate at which the homeowner borrows (the primary rate) can be thought of as equal to the coupon on the agency MBS that it will be packaged into (the secondary market rate), plus an additional spread, known as the primary-secondary spread.
Primary-secondary spreads are typically relatively stable, and changes in the secondary market rate are responsible for most of the variation in primary mortgage rates. The primary-secondary spread largely reflects the cost of credit guarantees (such as the mortgage insurance premium or GSE guarantee fees), origination and servicing costs, and a return on capital for the originator. Since the Global Financial Crisis of 2007–09, and outside of the pandemic period, when primary mortgage rates dropped to historic lows, the differential between the primary and secondary 30-year mortgage rates has historically averaged around 120 basis points, without a systematic correlation to other rates. A notable exception: when primary mortgage rates fall below those on a large share of outstanding mortgages. This decline prompts a wave of refinancings, which in turn causes refinancing demand to exceed the capacity of originators, producing wider primary-secondary spreads.
As agency MBS carry guarantees issued by either the government or GSEs, their credit quality is typically considered akin to that of Treasuries. As a result, it’s helpful to think about the pricing of an agency MBS as driven by the yield on an equivalent-duration Treasury, plus a spread that accounts for the special characteristics of the MBS. This raises a deceptively simple question: What is the duration of a 30-year agency MBS?
Duration is a measure of the sensitivity of the price of a security to a unit change in interest rates (in the discussion that follows, we specifically refer to modified duration). For non-amortizing, non-prepayable bonds, this sensitivity is fundamentally a function of a security’s tenor, its time remaining to maturity. This is because a large share of long-tenor bonds’ cash flows are discounted over a long period. Such long-dated cash flows are especially sensitive to interest rates because of compounding.
The typical agency mortgage in the U.S. is a 30-year fixed-rate mortgage with three defining characteristics:
- The principal balance amortizes over 30 years.
- The coupon or interest rate applied to the unpaid principal balance at any point is constant for the life of the loan.
- The loan is prepayable (i.e., the borrower holds a call option on the underlying loan, granting the right to buy it back by prepaying), either in part or in full, with no penalty.
All three characteristics are relevant in determining the mortgage rate relative to other market rates. Amortization and the type of prepayment option found in mortgages are features of MBS that significantly affect their duration and are exceedingly rare in other types of securities.
Principal amortization causes mortgage duration dependency on rate level
The duration of all bonds, including non-amortizing, non-prepayable bonds such as a 10-year Treasury note, will typically depend on the level of interest rates. But the duration of a mortgage-backed security has two additional and qualitatively different types of dependence on rates: principal amortization and prepayments.
To better understand this, it helps to start by assuming no prepayment. Even without prepayments, the amortizing nature of principal makes the 30-year mortgage significantly different from a 30-year Treasury bond, and much more like a weighted ladder of all maturities from one to 30 years. Chart 2 shows the planned paydown schedule over the 30-year life of a mortgage, for mortgages with various rates.
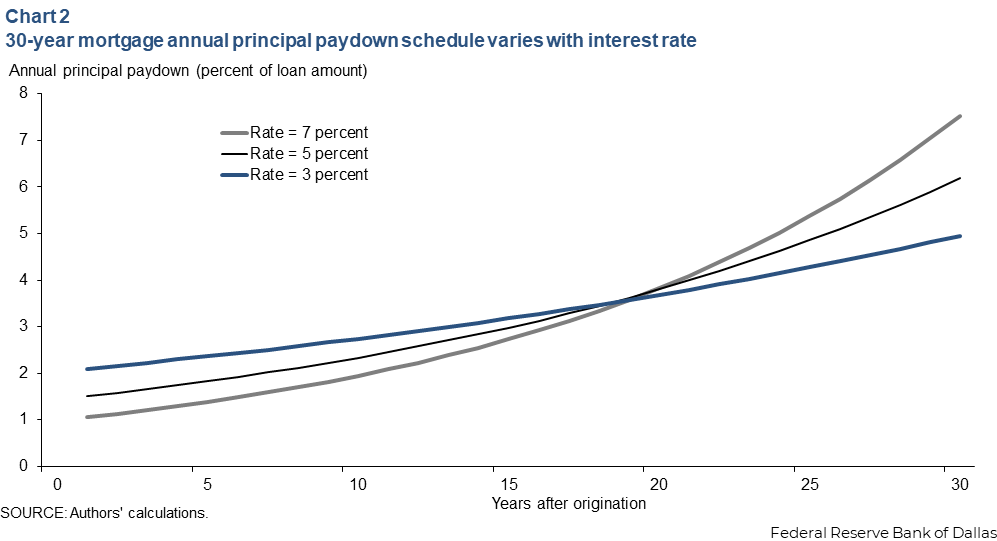
The higher the rate, the more back-loaded the cash flows become. As a result, if one imagines decomposing a mortgage into a ladder of loans weighted by the paydown schedule, it becomes clear that in high-rate environments, long-term rates matter more in determining the mortgage rate, even before we consider other factors such as prepayment risk.
Thus, to the extent the yield curve steepens during periods when the Fed cuts rates, long-term rates will decline less than other rates, and (given backdated paydowns) the impact on mortgage rates will be muted. On the other hand, should long-term rates decline in step with or faster than short term rates during an easing cycle, paydown schedules on newly originated mortgages will skew toward short maturities, helping accelerate the pass-through of policy stimulus into the mortgage market.
The best choice of a benchmark Treasury rate also matters. From the discussion of paydown schedules, it is clear that one should not compare 30-year mortgage rates with 30-year Treasury rates. Instead, it’s best to view mortgages as a ladder of loans with all possible maturities ranging from one to 30 years, with the principal amounts corresponding to the planned paydown schedule. However, choosing such a weighted combination of Treasury rates of all maturities is tedious.
Fortunately, we can arrive at a simpler approach by asking a slightly different question: What is the maturity of a par-priced Treasury security that would have the same modified duration as that of a weighted ladder of loans that simulates a mortgage? Our estimates for this duration-equivalent Treasury maturity at various mortgage rate levels are shown in Chart 3.
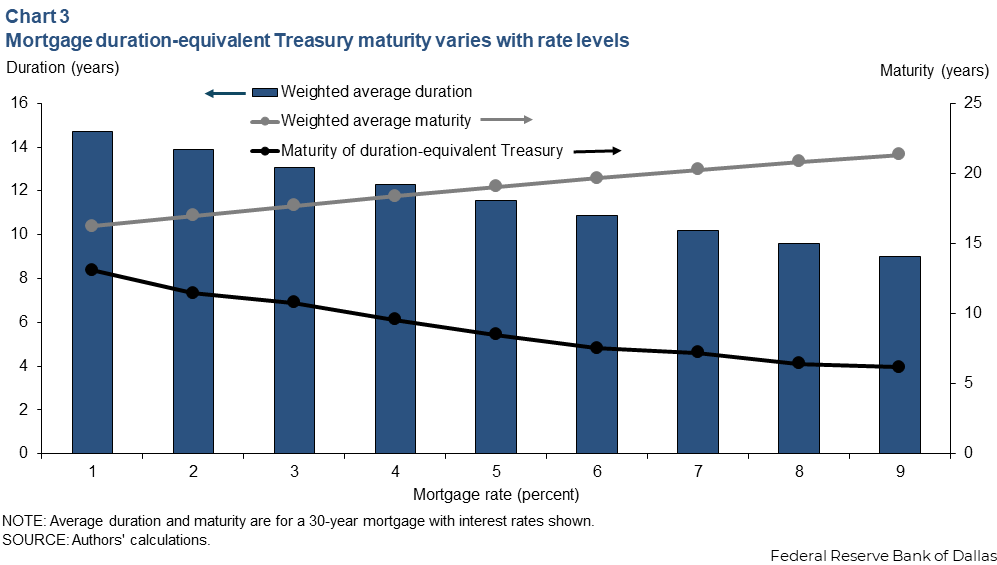
Here something interesting emerges: Even though paydowns become back-loaded as rates rise, causing the weighted average maturity of paydowns to increase, the weighted average duration decreases, causing the maturity of a duration-equivalent Treasury to steadily decline as rates rise. This is because as interest rates increase, longer-dated cash flows are more subject to exponentially smaller discount factors, shifting the drivers of securities’ value toward sooner-dated cash flows.
The increasingly back-loaded paydowns of mortgages originated at higher rates means this effect occurs more quickly for them than for Treasuries, causing mortgages originated at higher rates to have equivalent durations to relatively shorter-maturity Treasuries even before considering the effect of prepayments.
Given where 30-year mortgage rates have been for much of recent history (3 to 7 percent), the Treasury maturity that most closely resembles the duration characteristics of a mortgage is seven to 10 years, before considering the effect of prepayments. This is partly why it is common to measure current coupon mortgage yields as a spread over seven- to 10-year Treasuries. In the discussion that follows, we examine the current coupon 30-year mortgage yield as a spread over the widely followed 10-year Treasury rate.
Prepayments increase mortgage sensitivity to forward-rate volatility
Borrowers highly value the option to pay down principal earlier than scheduled without penalty. This feature is at the expense of lenders, who effectively account for this option by requiring higher spreads to Treasuries at origination. The magnitude of this spread increases when interest rate volatility rises.
Consider an investor who can choose between an agency MBS and a 10-year Treasury bond; the prevailing par rate on the 10-year Treasuries is 5 percent. A Treasury note investor is guaranteed a 5 percent return if the bond is held to maturity, but the investor is exposed to mark-to-market risk for shorter holding periods. This risk is roughly symmetric—rate declines before maturity would benefit the investor, while rising rates would result in a mark-to-market loss, in approximately symmetric fashion.
Now, suppose current coupon MBS yields are also 5 percent. An agency MBS investor accepts a payoff that is significantly asymmetric—should rates fall, the MBS is unlikely to appreciate in value, since the homeowners can repay at par while refinancing into lower rate mortgages. But if rates rise, the MBS experiences mark-to-market losses, much like the Treasury note.
These asymmetric or non-linear deviations in the value of MBS when interest rates change are the result of what is known as negative convexity. It imbues MBS with profit-and-loss characteristics that sometimes resemble a Treasury note, but in other instances are vastly inferior. Thus, an investor needs an inducement—a higher coupon (interest) rate to buy an MBS instead of a Treasury note.
The difference between the par (or current coupon, in mortgage market parlance) MBS yield and the 10-year Treasury note yield is commonly referred to as the nominal mortgage spread. The magnitude of the spread depends in part on rate volatility; higher volatility makes large moves in rates more probable and therefore amplifies the difference in characteristics between MBS and Treasuries.
More generally, this spread is the investor’s compensation for selling the homeowner the option to refinance. This spread should therefore depend on the variables driving that option’s cost. These variables can be broad based (such as the level of rates, the slope of the yield curve and implied volatility of rates) or borrower-specific (such as creditworthiness, the individual loan’s credit metrics and home price appreciation). Computing the value of the option is in general a complex exercise requiring numerical simulations with many behavioral assumptions.
It is also worth noting that while a rise in interest rates can negatively affect the value of all bonds, it can have a greater impact on MBS than on Treasuries because of homeowner behavior. While some prepayments occur because of refinancing, others occur because borrowers move or experience other life events. Because moving in particular is a common event that is often optional, borrowers with low-rate mortgages can become less likely to engage in optional moves when rates rise substantially. This can cause mortgage lock-in and extend the life of an MBS above initial expectations under exactly the circumstances that such an extension is most costly for an investor.
Reduced-form model captures key mortgage rate characteristics
While pricing MBS can often involve complicated models, we can use a reduced-form approach to capture many of the most important characteristics. While this approach is likely less accurate for any individual security, it is relatively more robust in situations outside historical experience, and it clearly illustrates the fundamental drivers of mortgage spreads.
Over the past 20 years, the 30-year current coupon mortgage yield has traded in a 500-basis point range. Viewed as a spread over the 10-year Treasury rate, the variation has been much smaller but nevertheless significant (Chart 4).
In particular, the spread does not merely appear noisy. Rather, it appears to exhibit systematic trends explained by the contemporaneous values of other market variables.
There are three obvious candidates that might explain the spread’s behavior.
- The spread might depend on the 10-year yield level itself. Such a dependence of a yield differential on the level of yields is very common in fixed-income markets. Anytime we analyze a spread between two yields in fixed-income markets, it is often the case that the two yields in question exhibit different volatilities while remaining well correlated. This means the difference between the two will tend to rise and fall with the overall level of either yield.
- The spread might also depend on the curve slope between the fed funds rate and the 10-year Treasury rate. Such a dependence is a consequence of the dependence of the weighted average duration of a 30-year mortgage on the mortgage rates. This means that as the curve steepens, for instance, the increase in long-term rates would cause the duration of a newly originated 30-year mortgage to fall, which in turn would cause the new mortgage to track a shorter maturity, thereby producing a negative dependence on curve slope.
- Mortgage rates also embed an option cost, which represents the investor's compensation for selling the borrower the option to refinance. The value of this option in general depends on yield levels, curve slope and option market implied volatility. As yield levels and curve slope are already considered, the remaining portion of the option cost can be addressed by including an implied volatility factor. We choose the 2Y10Y (two-year 10-year) swaption (swap option) implied volatility, which represents the volatility implied by premiums on at-the-money swaptions with a two-year expiration on a 10-year underlying swap.
Chart 5 shows the coefficients (and t-statistics) from regressing the current coupon's spread over 10-year Treasury yield, versus the three factors over the past 20 years, a period that spans several interest rate cycles. All three factors are statistically significant in driving the current coupon rate, and these three collectively explain about 70 percent of the spread variation.
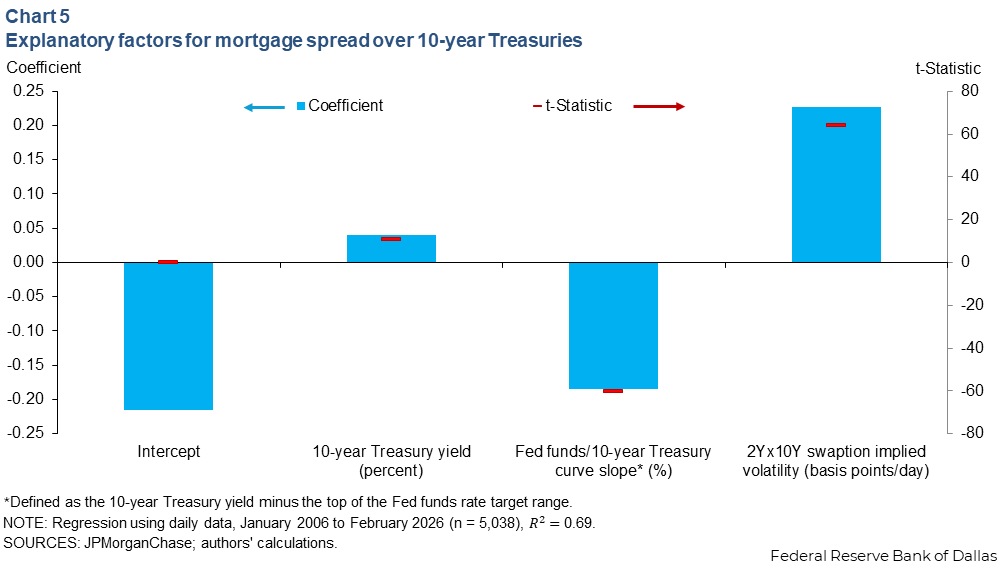
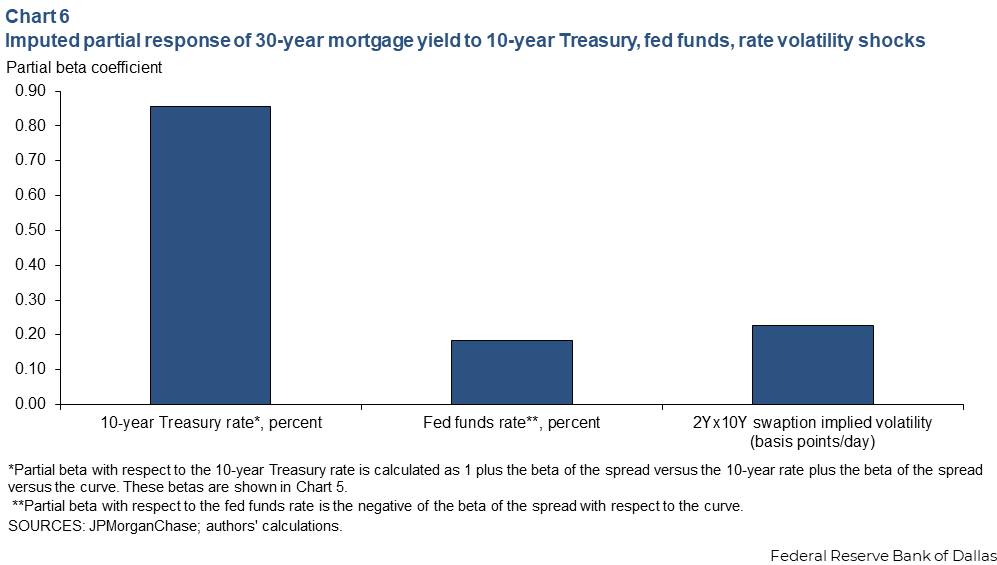
We can also extract from Chart 5 estimates of the likely response in mortgage rates to partial shocks in Treasury rates, the fed funds rate and implied volatility, holding all else constant. This is shown in Chart 6 and helps explain an often-noted conundrum regarding the stickiness of mortgage rates when the Fed is cutting rates. The mortgage rate exhibits a partial beta of less than 20 percent with respect to the fed funds rate, while exhibiting an 85 percent beta with respect to the 10-year rate. In other words, holding all other rates fixed, only 20 percent of moves in the fed funds rate transmit to the mortgage rate, while the corresponding number for the 10-year rate is 85 percent. As a result, the pass-through of rate cuts into the mortgage is typically attenuated, unless long-term yields decline significantly as well.
Therefore, to assess the potential impact of policy actions on mortgage rates, we first characterize the typical relationship between long-term rates (such as the 10-year Treasury rate) and short-term rates. Historically, over the past 20 years, the 10-year rate has tended to move by a third as much as the fed funds rate (measured using the beta between rolling quarterly changes over that period).
Co-movement of 10-year rates with the fed funds rate has diminished in recent years. Over the past five years, it has only been about 15 percent and has even turned negative the past one to two years. For the estimation that follows, we use the long-run average beta of 32 percent as a baseline choice, but uncertainty in this relationship causes us to explore additional shocks to the 10-year rate as an overlay to the baseline.
We now have all the elements to estimate mortgage rates under various scenarios for the fed funds rate. We start with the current values of the fed funds target and the 10-year Treasury rate and then examine a range of possible policy rate shocks. For each of these possible values, we use the relationship between these rates to estimate a corresponding baseline shock for the 10-year rate, but we then overlay additional shocks and produce a two-dimensional grid of scenarios.
With values for the fed funds rate and the 10-year for each of these scenarios and by assuming implied volatility remains unchanged from current levels, we can use the coefficients in Chart 6 to produce a value for the current coupon mortgage yield. Finally, we assume the primary-secondary spread remains at its historical average level of 120 basis points. This allows us to estimate the 30-year primary mortgage rate in each of these assumed scenarios (Table 1).
| Fed funds rate (top of the range), percent | |||||||||
| Shock (basis points) | -250 | -200 | -150 | -100 | -50 | 0 | 50 | 100 | |
| Fed funds rate level (percent) | 1.14 | 1.64 | 2.14 | 2.64 | 3.14 | 3.64 | 4.14 | 4.64 | |
| Baseline 10-year Treasury rate (percent) | 3.16 | 3.32 | 3.48 | 3.64 | 3.8 | 3.96 | 4.12 | 4.28 | |
| Incremental 10-year rate shock (basis points) | Estimated 30-year mortgage primary rate, percent | ||||||||
| -100 | 4.01 | 4.24 | 4.47 | 4.70 | 4.93 | 5.15 | 5.38 | 5.61 | |
| -75 | 4.22 | 4.45 | 4.68 | 4.91 | 5.14 | 5.37 | 5.60 | 5.83 | |
| -50 | 4.44 | 4.67 | 4.89 | 5.12 | 5.35 | 5.58 | 5.81 | 6.04 | |
| -25 | 4.65 | 4.88 | 5.11 | 5.34 | 5.57 | 5.80 | 6.03 | 6.25 | |
| 0 | 4.86 | 5.09 | 5.32 | 5.55 | 5.78 | 6.01 | 6.24 | 6.47 | |
| 25 | 5.08 | 5.31 | 5.54 | 5.77 | 5.99 | 6.22 | 6.45 | 6.68 | |
| 50 | 5.29 | 5.52 | 5.75 | 5.98 | 6.21 | 6.44 | 6.67 | 6.90 | |
| 75 | 5.51 | 5.74 | 5.96 | 6.19 | 6.42 | 6.65 | 6.88 | 7.11 | |
| 100 | 5.72 | 5.95 | 6.18 | 6.41 | 6.64 | 6.87 | 7.09 | 7.32 | |
| NOTES: We assume shocks to the fed funds rate ranging from -250 basis points to +100 basis points in steps of 50 basis points in order to keep the number of columns manageable. For a given shock to the fed funds rate, the baseline assumption for the 10-year rate is that it moves by 32 percent of the move in the fed funds rate. Additional shocks over and above this baseline are assumed for the 10-year rate, with each row denoting a different assumed magnitude. Implied volatility is assumed to remain constant. The primary-secondary spread is assumed to be constant at 120 basis points. Market variables are as of March 31, 2026. SOURCES: JPMorganChase; Bloomberg; authors' calculations. |
|||||||||
Purchases by price-insensitive buyers can compress mortgage spreads
The discussion thus far has focused on buyers who are entirely motivated by the relative return of various securities. However, there have been episodes over the past two decades involving substantial purchases of MBS that are not primarily motivated by price. The Federal Reserve has acted in such a manner three times over this period. In the wake of the Global Financial Crisis in 2008, the Federal Reserve purchased MBS in two waves to support its monetary policy objectives. This was followed by a third wave of purchases in response to the pandemic in 2020. More recently, at the direction of the federal government, Fannie Mae and Freddie Mac have engaged in purchases for their retained portfolios with the objective of compressing mortgage spreads.
Intuitively, the degree to which purchases affect spreads is a function of the size of the purchase programs and the degree to which the interest rate risk is absorbed by the purchasers or hedged in the marketplace. Historical evidence suggests that the prior episodes of purchases by price-insensitive buyers affected both mortgage spreads and interest rates more broadly than recent episodes via portfolio effects, with significant implications for policy transmission. One way to see the effect of such purchases on mortgage spreads is to look at the residual from the reduced-form model described earlier. This residual turned sharply negative following the announcement of three purchases (Chart 7).
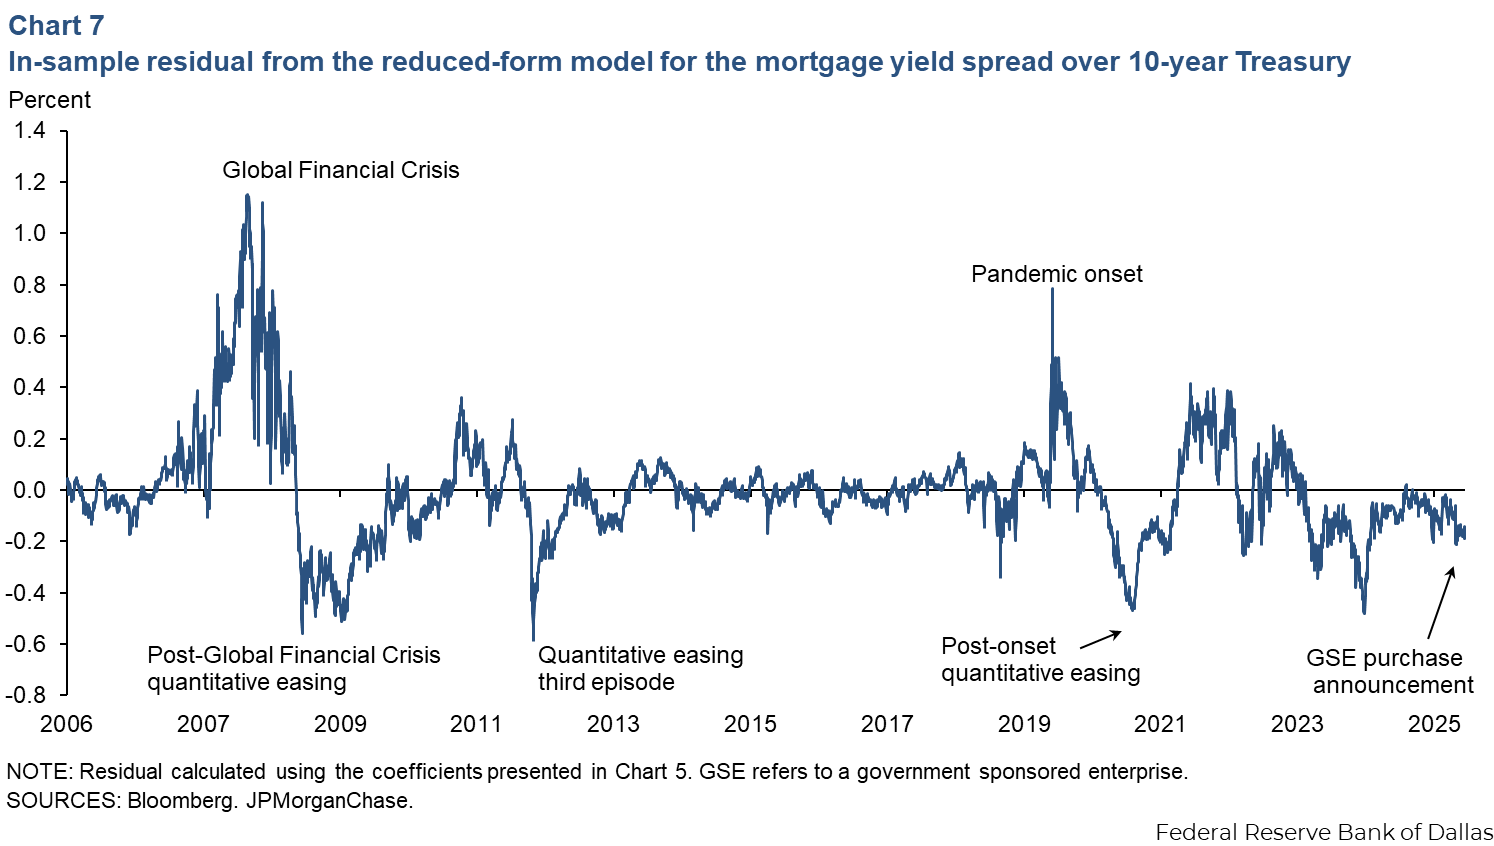
Notably, the effect of purchases as indicated by the residual—that is, independent of any effects these purchases may have on the expected future path of rates and rate volatility—is small (but not insignificant) relative to the effects of variation in curve slope and rate volatility.
Conclusion
Mortgage rates are an important channel for monetary policy pass-through. However, this channel is complex. In most cases, mortgage rates can be thought of as consisting of the 10-year Treasury rate plus a spread that is affected by the level of yields, the slope of the yield curve, two-year forward 10-year interest rate volatility, and a residual that is influenced at times by price-insensitive purchases. As a result, the pass-through from policy actions can be substantially damped. For example, lower monetary policy rates can be significantly offset by changes in the yield curve slope, and as recently observed, purchases can be substantially offset by exogenous increases in forward-rate volatility.
About the authors

Matthew McCormick is a principal financial economist in the Research Department at the Federal Reserve Bank of Dallas.

Srini Ramaswamy is a senior financial economist in the Research Department at the Federal Reserve Bank of Dallas.