U.S. housing: Unaffordable to buy, but wealth-building to own
Housing valuation relies on what the underlying housing asset is worth as an investment. A home is not only a place to live. It is a long-lived asset whose value reflects the housing service it provides over time and the return buyers require, given interest rates and risk.
In many countries, price-to-rent ratios surged immediately before or during the pandemic and subsequently corrected. In the U.S., valuations increased less than abroad but remain elevated relative to historical benchmarks, with no meaningful adjustment since the pandemic.
The combination of high price-to-rent ratios and strained affordability suggests housing remains a macroeconomic vulnerability, though financial conditions appear more resilient than before the Global Financial Crisis of 2008. The tendency of growing housing wealth to support household spending is a complicating factor.
Price-to-rent ratios provide a housing valuation gauge
Housing provides both a consumed service and an investment return. That return reflects the rental flow a property generates—either explicit rent from tenants or the implicit rent owner-occupiers forgo by living in the property.
The price-to-rent ratio compares a home’s market value with the rental income it produces. Its inverse can be interpreted as an implicit yield.
The analogy to equity markets is straightforward. Much like the price-to-dividend ratio for stocks, a high price-to-rent ratio means buyers are paying more relative to the income a property generates. In other words, they are accepting a lower yield. This may reflect expectations of stronger future rent growth, lower required returns due to low interest rates or perceived risk. Conversely, a low ratio implies a higher yield and either weaker growth expectations or greater required compensation for risk.
Because house prices and rents are often published as indexes, we focus on indexed price-to-rent ratios to track changes (Chart 1).
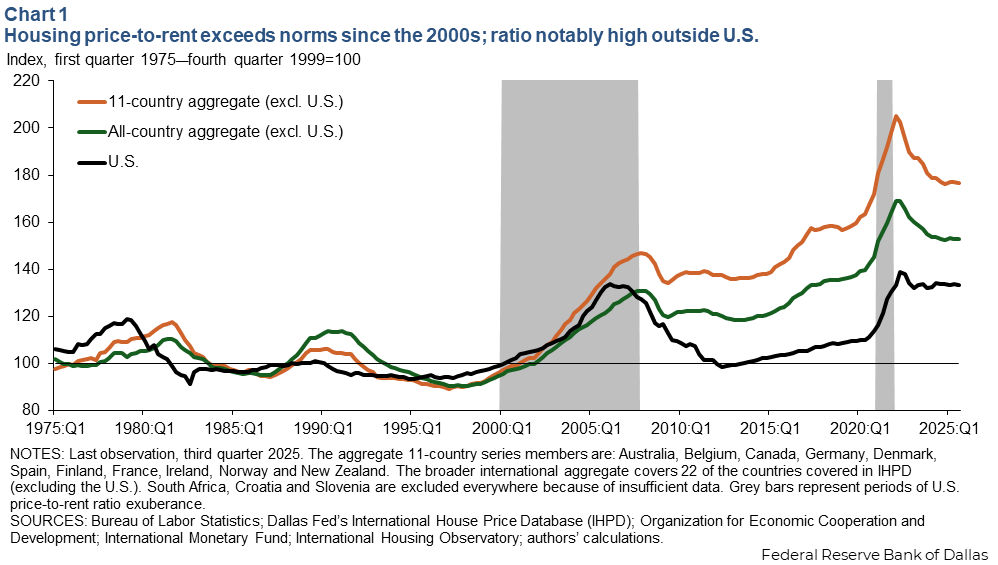
We construct three series: the U.S.; a 22-country foreign aggregate excluding the U.S.; and a subset of 11 economies (Australia, Belgium, Canada, Germany, Denmark, Spain, Finland, France, Ireland, Norway and New Zealand). The price-to-rent ratios for the latter group have been elevated since the early 2000s relative to their 1975–99 average.
Fundamentals or froth
Elevated price-to-rent ratios can reflect stronger expected rent growth or lower required returns. But they also occur when prices detach from the underlying rental stream, particularly when past appreciation leads buyers to extrapolate further gains. In such episodes, fear of missing out (FOMO) can push valuations beyond levels justified by fundamentals.
Chart 2 evaluates this possibility by comparing observed price-to-rent ratios with a fundamentals-based benchmark derived from International Housing Observatory research. Housing valuations should be anchored by rents (the underlying cash flows) and by long-term interest rates, which capture the opportunity cost of capital and the return investors require.
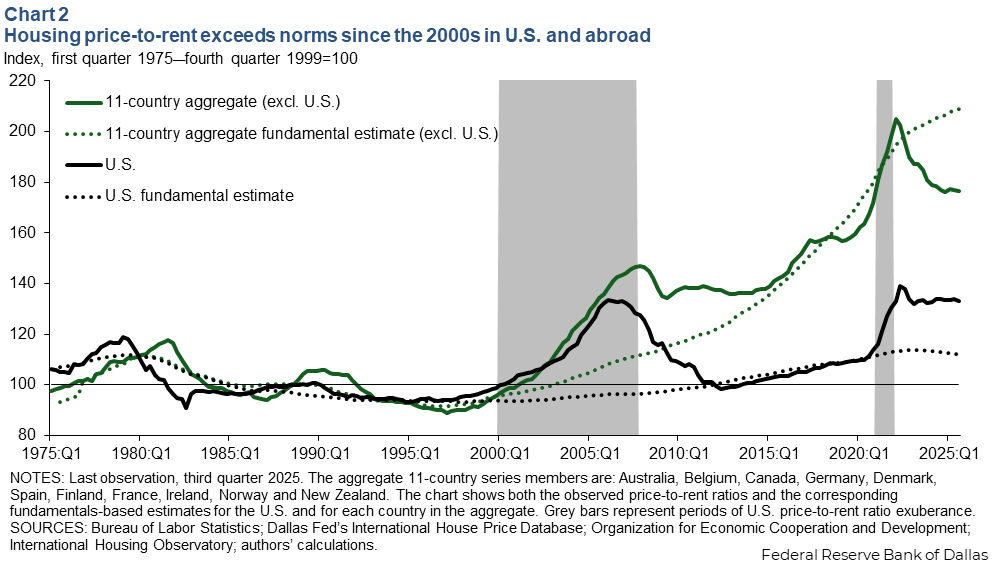
This benchmark isolates the portion of house price movements not explained by these fundamentals and helps assess whether valuations are drifting into exuberant territory.
Applying this framework shows that pandemic-era overshooting in the 11-country foreign aggregate has largely reversed, with latest valuations at or significantly below fundamentals-based levels.
In the U.S., although the price-to-rent run-up was smaller, it remains well above the fundamentals-implied ratio. After accounting for rents and long-term interest rates, U.S. housing still appears expensive on this metric.
One possibility is that housing markets have shifted toward structurally higher valuation ratios. The evidence in Chart 2, however, points toward mispricing in the U.S. rather than a structural shift (unlike what appears the case abroad).
Because the benchmark relies on a stylized valuation model, uncertainty remains. Whether today’s valuations reflect temporary misalignment or a more durable shift will determine both the magnitude and the pace of any adjustment.
Housing increasingly priced for capital gains
After the Global Financial Crisis and subsequent housing bust, price-to-rent ratios gradually approached earlier highs. In the U.S., they surpassed prior peaks during the pandemic run-up and remain elevated today. Abroad, pandemic surges pushed valuations even further above historical norms.
Although some countries have experienced partial corrections, both the broad foreign aggregate and the higher risk 11-country group remain well above pre-2000 levels.
This persistent elevation suggests housing has increasingly been priced like a growth asset across countries—not just in the more stretched markets highlighted in Chart 2. Housing appears valued more for expected capital gains than for rental income, a pattern that remains evident even in fundamentals-based valuations.
What high price-to-rent ratios predict
Standard asset-pricing logic implies that when price-to-rent ratios are elevated, absent a structural shift toward persistently higher valuation ratios, future returns should be lower.
Chart 3 examines data from 23 countries, including the U.S., relating today’s price-to-rent ratio to real (inflation-adjusted) house price growth over the next three years, while controlling for country-specific characteristics and global housing cycles. In simple terms, it asks whether higher valuations today signal weaker or stronger house price growth in the future.
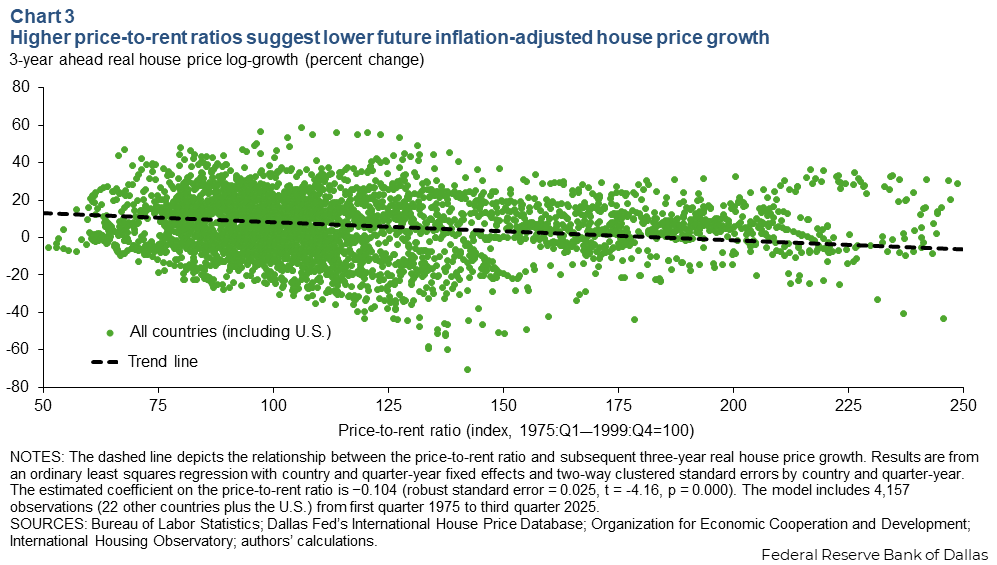
The results show that high price-to-rent ratios predict weak future growth. The estimated coefficient of -0.104 implies that a 40 percentage point higher ratio—roughly the gap between the U.S. and more stretched foreign markets—is associated with about 4 percentage points lower real house price growth abroad relative to the U.S. over the next three years.
Chart 4 uses the same cross-country setting, with 23 countries including the U.S., and it relates today’s price-to-rent ratio to real rent growth over the next three years. The presentation again controls for country characteristics and global housing cycles. The results indicate a positive but modest relationship. The estimated coefficient of 0.022 implies a 40 percentage point higher ratio is associated with less than 1 percentage point relatively higher foreign real rent growth over the next three years.
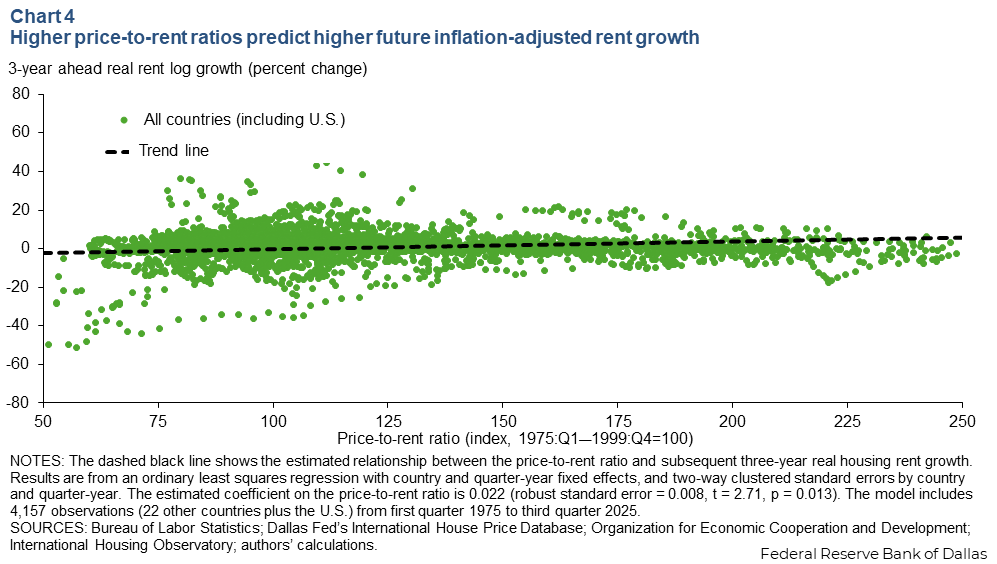
In other words, the international experience suggests that when price-to-rent valuations are elevated, most of the adjustment occurs through slower house price growth, with only a limited contribution from faster rent increases.
How housing valuations tend to rebalance
These relationships help interpret recent experience. Large pandemic-era run-ups in price-to-rent ratios abroad were followed by sizable price corrections. In the U.S., where the increase in valuations was smaller, the adjustment has been more limited.
The evidence also points to a shifting paradigm. Before 2000, relatively sharp house price corrections followed elevated price-to-rent ratios, with rising rents modestly helping restore balance.
Since 2000, an era marked by periodic housing market froth, the adjustment process has changed. The contribution from rents has largely disappeared, with house price growth still slowing but by less and more gradually than before.
This suggests that when valuations drift from fundamentals, adjustment occurs mostly through price corrections. At the same time, not all run-ups are alike. The speed of adjustment depends on financial conditions, expectations and policy environments, which can delay or smooth corrections even when valuations are stretched.
Restoring balance will likely require weaker house price growth and possibly some outright declines. Part of the adjustment may also come from strong income growth easing affordability pressures, allowing the economy to grow into today’s elevated valuations or supporting a gradual unwinding if ratios revert toward their pre-2000 historical norms.
What is at stake
Housing valuations influence housing wealth and, through it, household spending. Chart 5 compares growth in the housing wealth-to-income ratio with changes in affordability (price-to-income-per-capita ratio) and in nominal house prices.
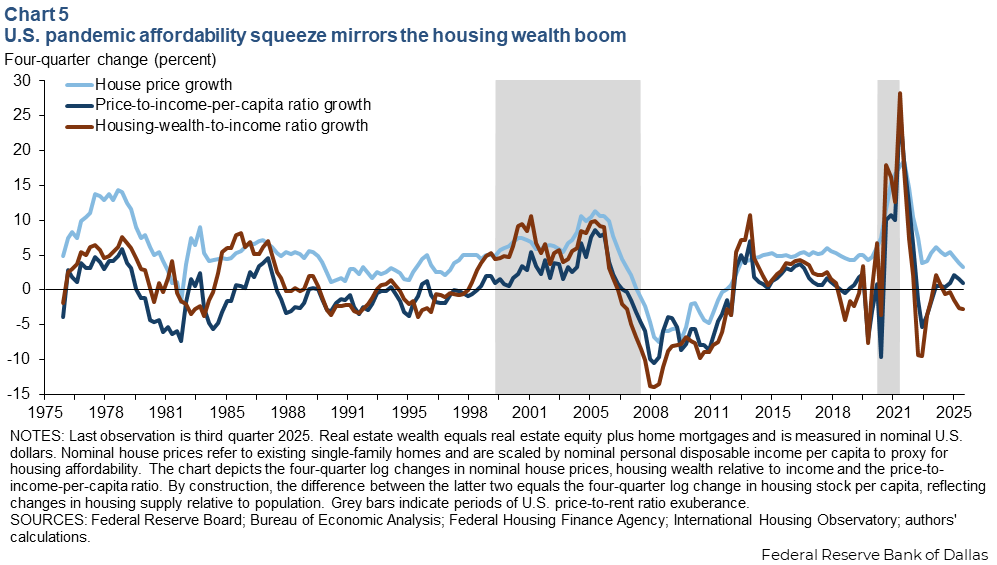
The difference between housing-wealth-to-income growth and price-to-income-per-capita growth reflects changes in housing supply per person, while the gap between affordability (price-to-income-per-capita) and house price growth reflects income growth per capita.
Since 2008, U.S. housing dynamics have differed markedly from earlier decades. In the 1980s and 1990s, house prices generally moved in line with and often below income-per-capita growth, supporting affordability, while housing wealth was bolstered in part by an expanding housing stock per person. By contrast, during the 2000–06 boom, house prices rose nearly twice as fast as income (7.4 percent versus 3.8 percent), sharply eroding affordability.
Over 2020–25, house prices have again notably outpaced income growth (8 percent versus 5 percent), further weighing on affordability, while housing supply has lagged population growth (by about 1.1 percentage points annually). As a result, recent increases in housing wealth have been driven primarily by valuation gains linked to higher price-to-rent ratios and worsening affordability, rather than by supply expansion.
The financial backdrop, however, differs significantly from the mid-2000s. Mortgage debt relative to income remains well below pre-Global Financial Crisis levels (2.5 in 2020–25 versus 3.6 in 2007–12), and aggregate loan-to-value ratios are also lower (0.23 versus 0.34). Tighter underwriting and post-Global Financial Crisis regulatory reforms have constrained leverage growth for homeowners and underwriters.
This distinction matters. If price-to-rent ratios decline through a price correction, affordability could improve, but housing wealth would likely fall absent stronger supply growth. Because housing wealth is closely linked to broader consumption behavior, such an adjustment could weigh on total U.S. aggregate demand even if financial stability risks are more contained than before the 2008 crisis.
While overall household balance sheets appear resilient, vulnerabilities could still emerge among borrowers, regions or specific market segments.
Why this all matters
Viewing housing through the price-to-rent lens highlights several key risks.
- Baseline outlook: Real house price growth is likely to remain subdued rather than collapse.
- Valuation signals: High price-to-rent ratios reliably predict weaker future house price growth; rent growth contributes little, especially since 2000.
- U.S. vulnerability: The U.S. experienced smaller valuation run-ups than many peers but also less correction, and fundamentals-based metrics still point to misalignment.
- Macro implications: Because housing wealth and consumption are tightly linked, valuation adjustments could influence the broader economic outlook.
The message is not one of imminent collapse, but of persistent vulnerability. The price-to-rent ratio remains a useful barometer of housing risk and one worth monitoring closely.
About the authors

Enrique Martínez García is an assistant vice president in the Research Department and co-director of the Global Institute at the Federal Reserve Bank of Dallas.

Efthymios Pavlidis is a professor of economics at Lancaster University Management School in Lancaster, U.K.