
International comparisons show AI effect on productivity
There is a positive relationship between artificial intelligence (AI) exposure and labor productivity growth in U.S. industry. But is AI itself responsible for that growth in the sectors most exposed to it?
Because AI use varies across countries, we can draw on international data to investigate the relationship between AI exposure and productivity growth at the sector level. The positive relationship in the U.S. fits a pattern visible among countries and appears related to high AI use.
Productivity growth in the most AI exposed sectors
U.S. labor productivity has grown at an annualized rate of 2.4 percent since the beginning of 2024. This compares to average productivity growth of 1.6 percent in the five years before the pandemic (Chart 1).
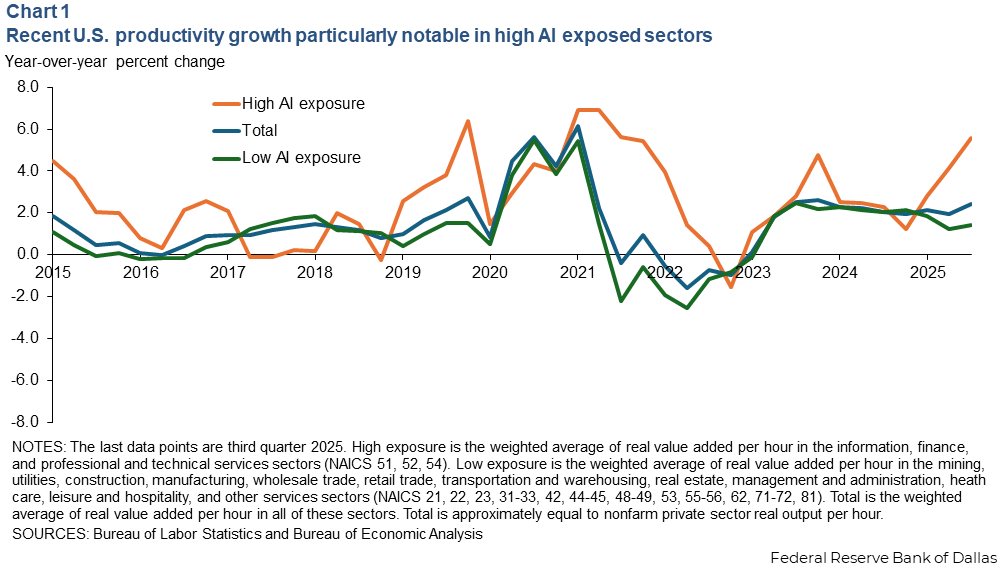
Recent productivity growth has been especially strong in the information, finance and insurance, and professional and technical services sectors. These are the three most AI-exposed areas, according to an AI industry exposure index from researchers Edward Felten, Manay Raj and Robert Seamans.
They assign a score to describe AI’s ability to replicate any given occupational task. Aggregating across the set of tasks required for a particular occupation, or across occupations in a given industry, provides AI-exposure indexes at the occupation and industry levels. Average annualized productivity growth since first quarter 2024 for these three sectors is 3.7 percent compared with 1.7 percent for the rest of the economy.
The correlation between AI exposure and recent productivity growth is evident among industries (Chart 2). Regressing industry-level productivity growth on the authors’ industry-level AI exposure index indicates a significant, positive relationship between AI exposure and productivity growth. That is, industries with more AI exposure also experienced faster productivity growth over the past two years.
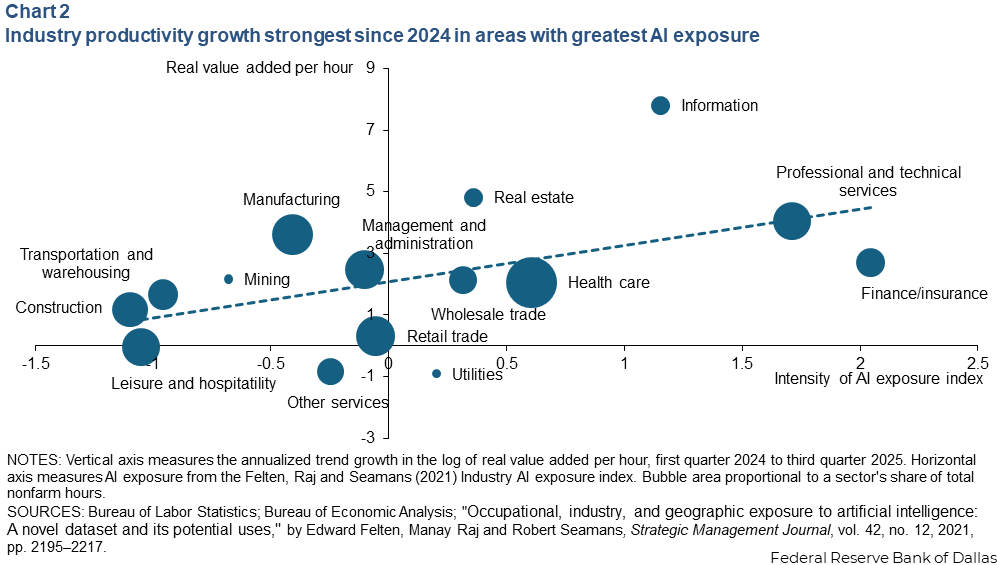
This result is consistent with recent articles from the Federal Reserve Banks of Kansas City and St. Louis. Notably, in those other studies, industry productivity growth is regressed against a measure of an industry’s AI use. Instead, the depiction in Chart 2 shows the potential for AI to replicate the given tasks that make up an industry rather than the industry’s AI use. Whether that potential is realized is another question.
To help establish whether the relatively high productivity growth in these AI exposed sectors in the U.S. is related to AI use, we turn to international data, which has considerable cross-country variation in AI use.
AI use varies by country
The Anthropic AI Usage Index measures cross-country variation in AI use. This index quantifies the use of the company’s Claude AI tool in each country and then normalizes total usage by a country’s working age population. If Claude use was uniform for countries, then all countries would have AI usage indexes of 1.
There is considerable heterogeneity in AI usage across countries. For example, at the end of 2025, the U.S. had an Anthropic AI usage index value of 3.69, meaning that per capita U.S. use of Claude is 3.69 times the global average (Chart 3). Emerging market economies are among the countries with the lowest AI use, and even among advanced economies there are wide gaps in usage.
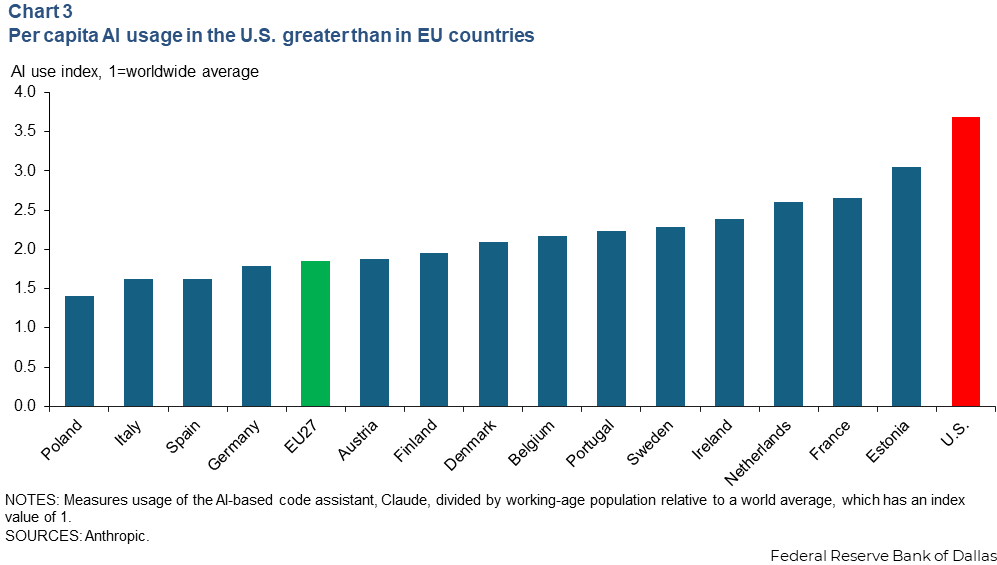
AI usage levels in some major economies within Europe are half that of the U.S. The EU-27 has an Anthropic AI Usage index value of 1.85. Even this hides significant heterogeneity across member states, where the index ranges from 1.41 (Poland) to 3.05 (Estonia). And within the core of the EU, the index varies from 1.79 in Germany to 2.66 in France.
Comparing labor productivity, AI exposure in EU and U.S.
I compare productivity in the U.S. and the EU to further establish that recent high productivity growth in AI-exposed sectors is due to AI. The sectoral classification in the EU national accounts data is similar to that in the U.S. data, so each EU country can be depicted with the same type of bubble chart as Chart 2.
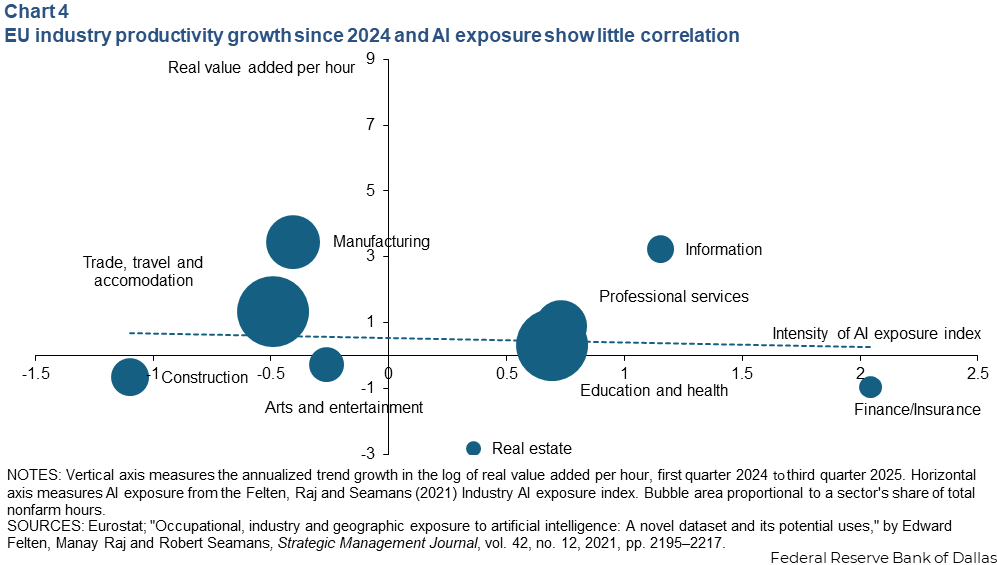
By definition, the AI exposure index for a given sector is the same in the U.S. as in the EU. That is, AI is equally capable of performing tasks in a sector, whether the sector resides in the U.S. or the EU. In the EU, there is no correlation between a sector’s AI exposure and recent productivity gains (Chart 4).
We can compute a similar scatterplot for each of the major EU countries. Chart 5 plots the slope from the trend line in these country-specific scatterplots against the country’s AI use.
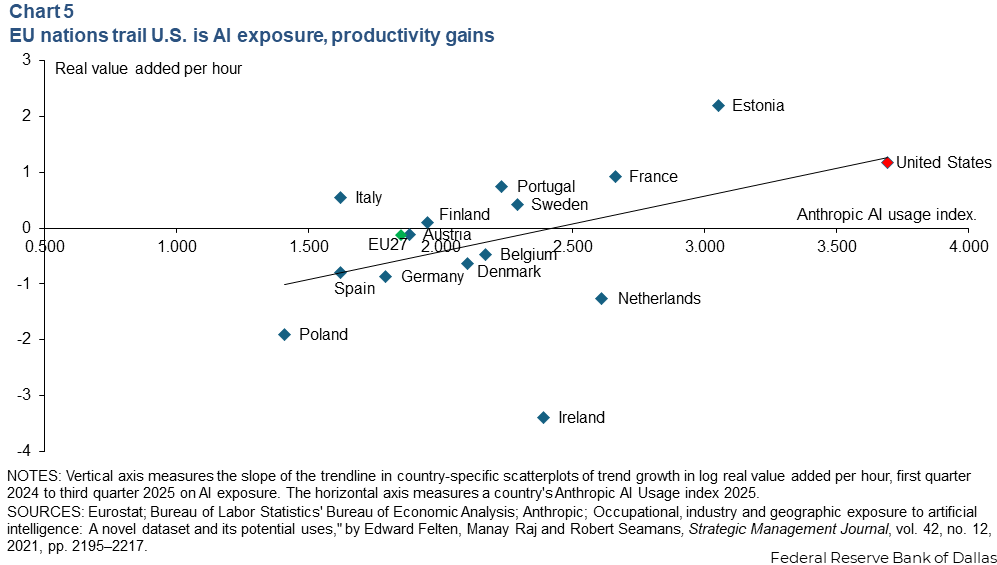
Chart 5 shows that as AI usage intensifies within a country, the correlation between industry-specific productivity growth and AI exposure strengthens. Like the U.S., some of the European countries with highest AI usage also experience relatively high productivity growth in AI exposed sectors.
Meanwhile, productivity growth is low in AI exposed sectors in Spain and Germany, which rank low in AI usage. The point for the U.S. lies right along the trendline from the cross-country scatterplot, indicating that the high productivity growth in AI exposed sectors in the U.S. is not an outlier, but rather follows a pattern across countries and is related to high AI use in the U.S.
Notably, the depiction highlights a positive correlation between a country’s AI usage and the relative productivity growth of AI exposed sectors, not causation. Productivity is determined by many factors. Some of them may be correlated with AI use but not caused by it. These results corroborate those from a recent study by economists who conducted a survey of AI use across EU firms and found that even after controlling for industry and country fixed-effects, higher AI use among firms in an industry is associated with higher industry productivity growth.
Where do we go from here?
International data suggest that high AI use in the U.S. is leading to high productivity growth in AI exposed sectors such as finance, professional and technical services, and information.
Additionally, these more AI-exposed sectors appear to be driving much of recent U.S. productivity growth. These three sectors are responsible for only 16 percent of total hours worked in the U.S. and account for 40 percent of total U.S. productivity gains since the beginning of 2024. However, labor productivity growth has been declining in the rest of the economy since peaking in 2023. The question is whether AI will be a transformational, general-purpose technology and lead to improvements in productivity in the other sectors that for now are less exposed to it.
About the author

Scott Davis is an assistant vice president in the Research Department of the Federal Reserve Bank of Dallas.