Permian Basin Economic Indicators

Oil production continues to reach new highs. However, the rig count continues to contract, and the number of drilled but uncompleted wells has steadied. As activity in the oil and gas sector has decelerated, both job growth and home sales have cooled.
Labor Market
With business activity in the oil and gas sector declining, employment growth in the Permian has slowed. Through August, Permian Basin employment has only edged up an annualized 0.7 percent, much lower than the 11.4 percent growth seen over the same period last year (Chart 1).
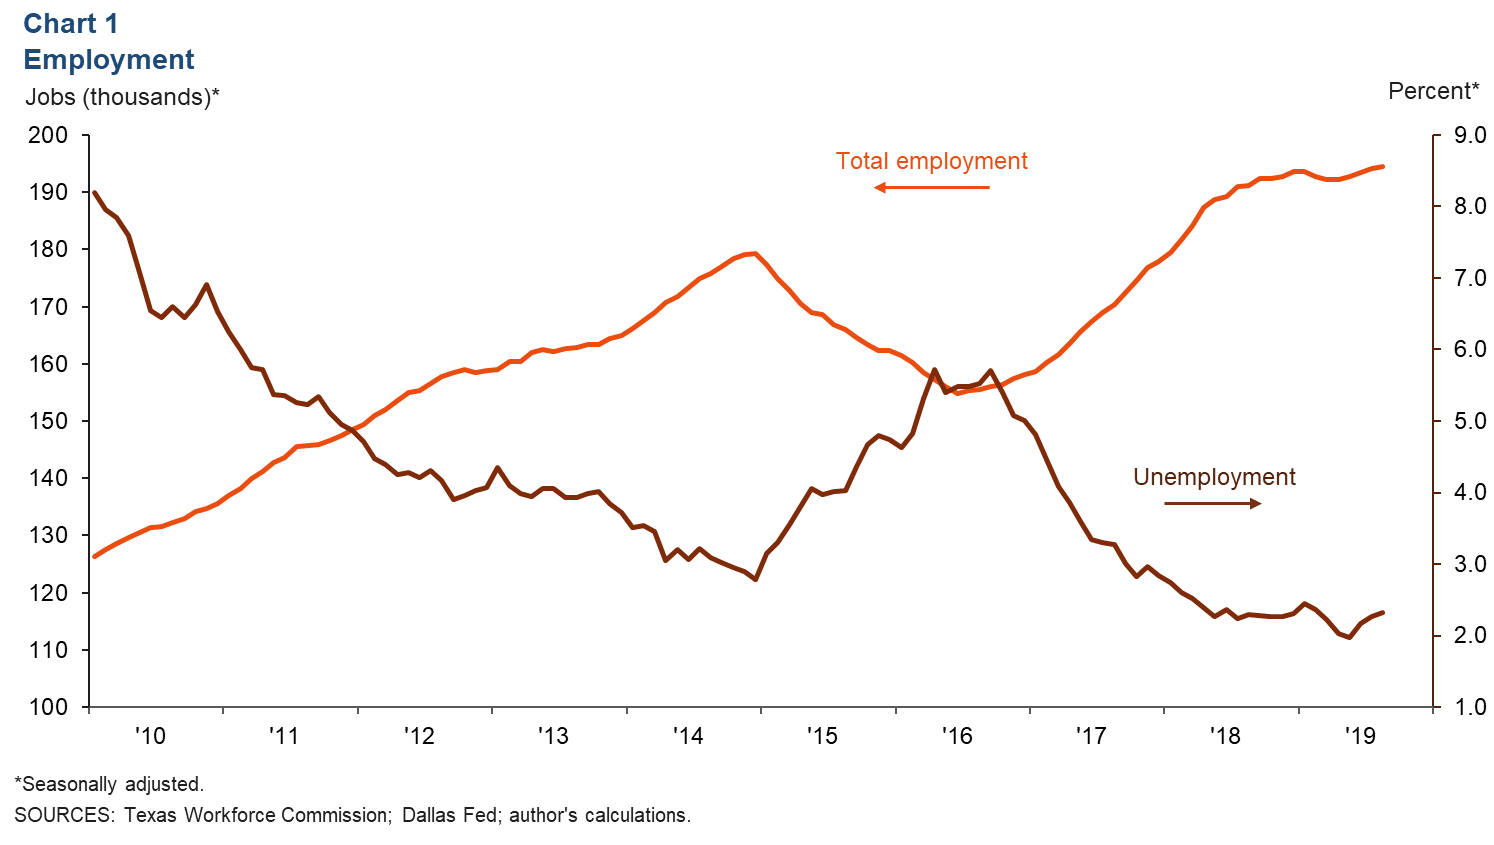
The unemployment rate has ticked up. In August, it was 2.3 percent, unchanged from July, but up from a low of 2.0 percent in May. Despite the recent uptick, the Permian Basin jobless rate remains well below the Texas rate of 3.4 percent.
Energy
Oil Prices Tick Up
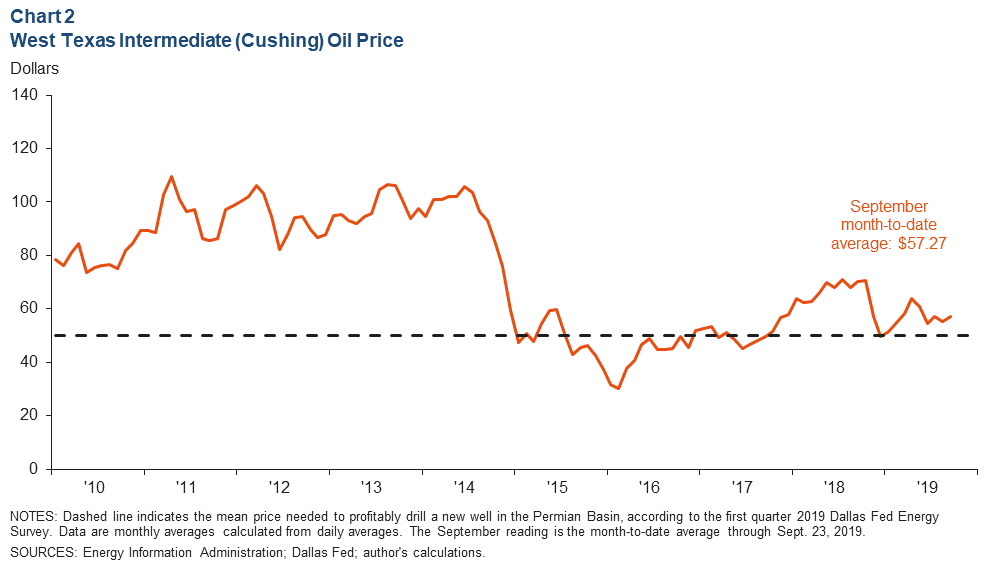
The recent crude production outage in Saudia Arabia caused the price of West Texas Intermediate (WTI) to rise in September, taking the month-to-date WTI average to $57 per barrel (Chart 2); this was higher than August’s average of $55.
Rig Count Contracts, Oil Production Climbs
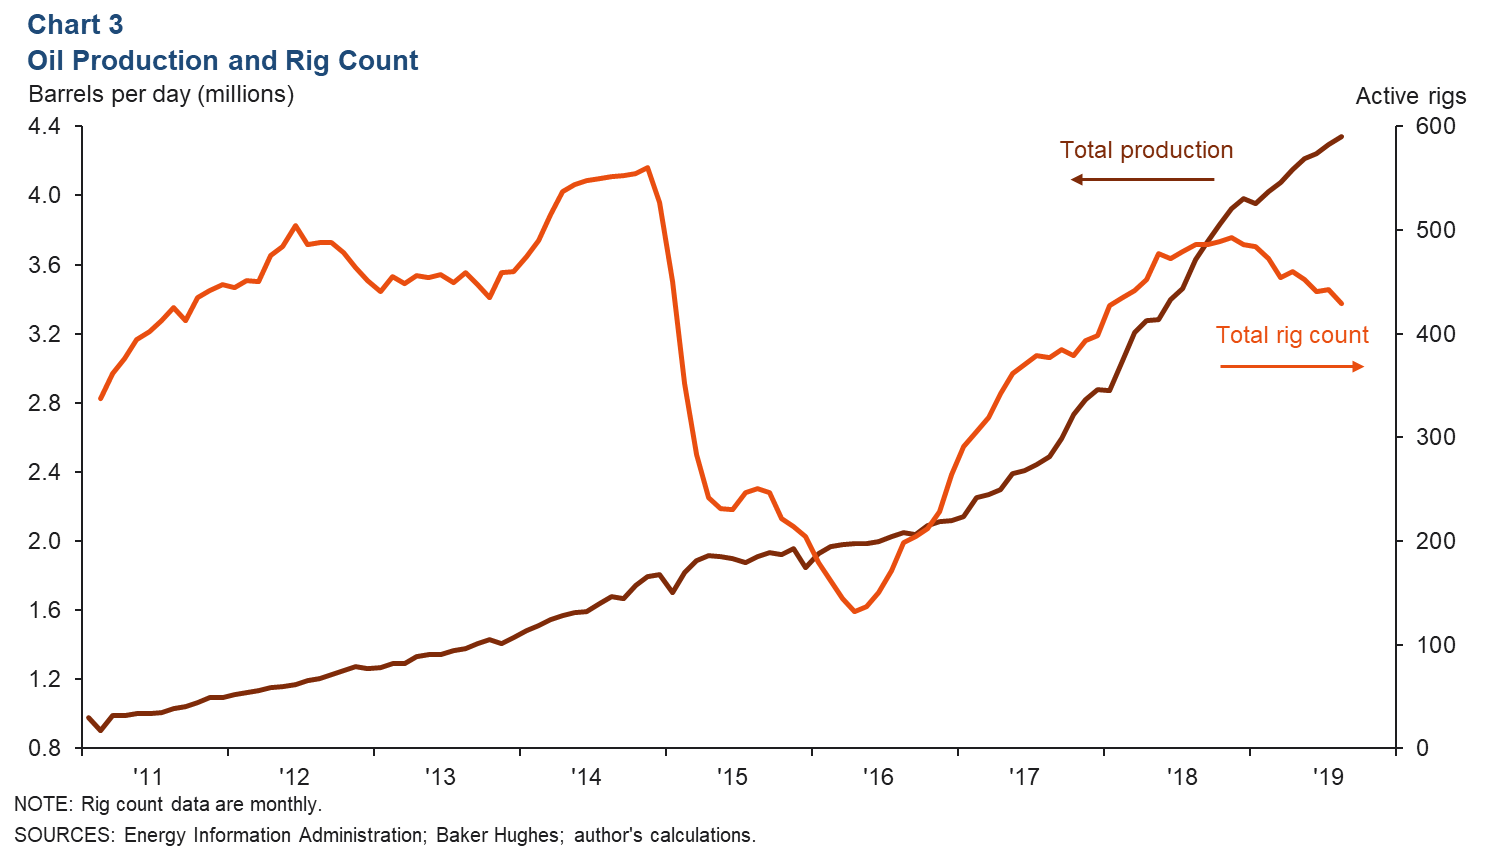
The Permian rig count has been trending down since November 2018, falling by 64 rigs to 429 in August (Chart 3). Meanwhile, production continues to climb and reached 4.34 million barrels per day in August.
Drilled but Uncompleted Wells Plateau
The number of drilled but uncompleted wells (DUCs) in the Permian appears to have plateaued over the last few months (Chart 4). In August, DUCS totaled 3,839 compared with 3,864 in July.
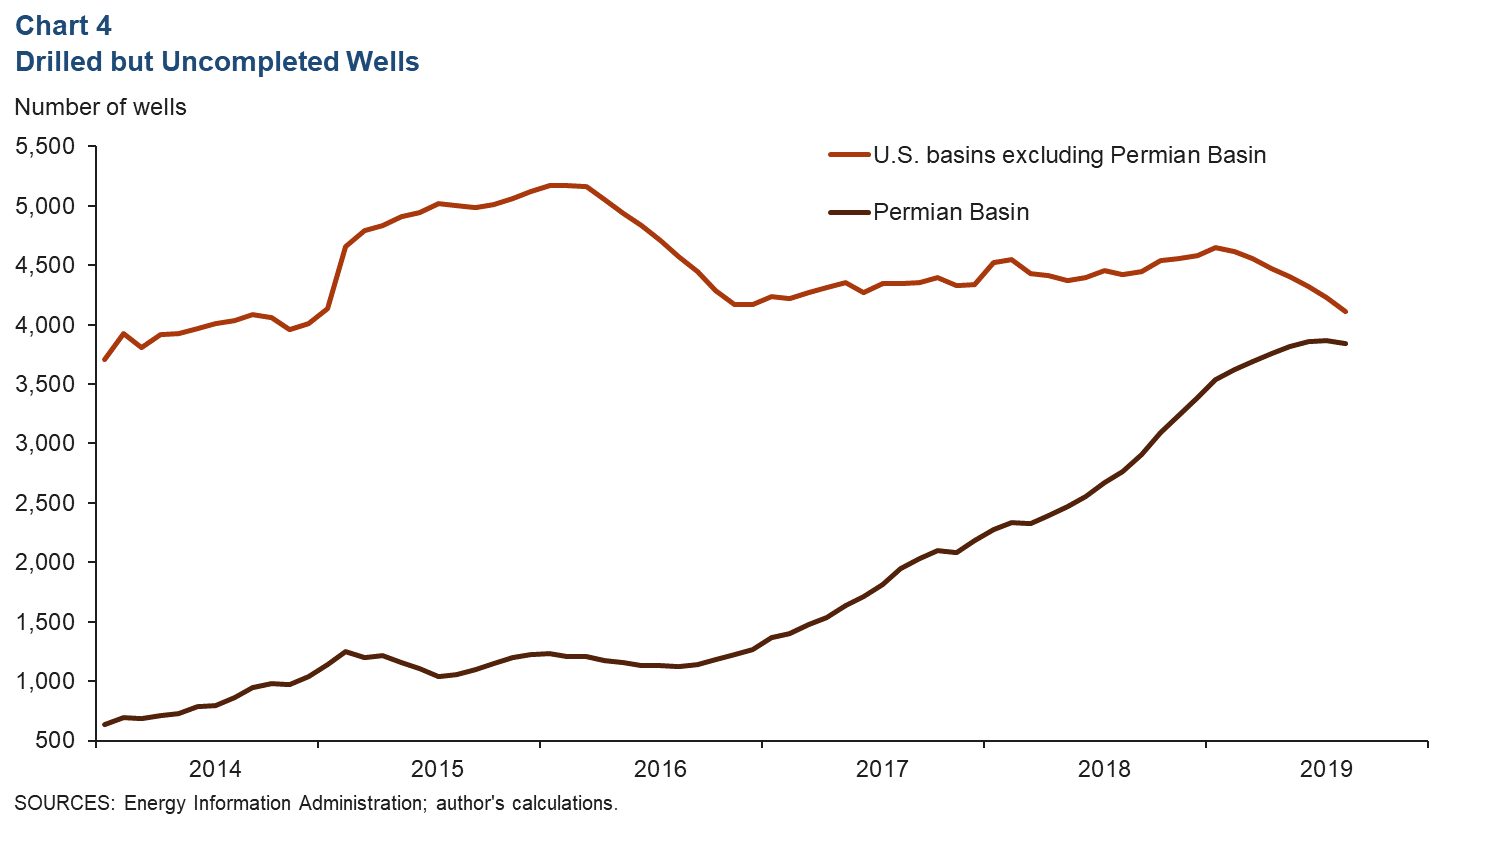
While drilling has slowed, well completions have picked up. In August, completed wells in the Permian totaled 550, up from 535 in July. The pickup in completions may in part be due to new pipeline capacity that has recently come online.
Housing
Home Sales Growth Slows
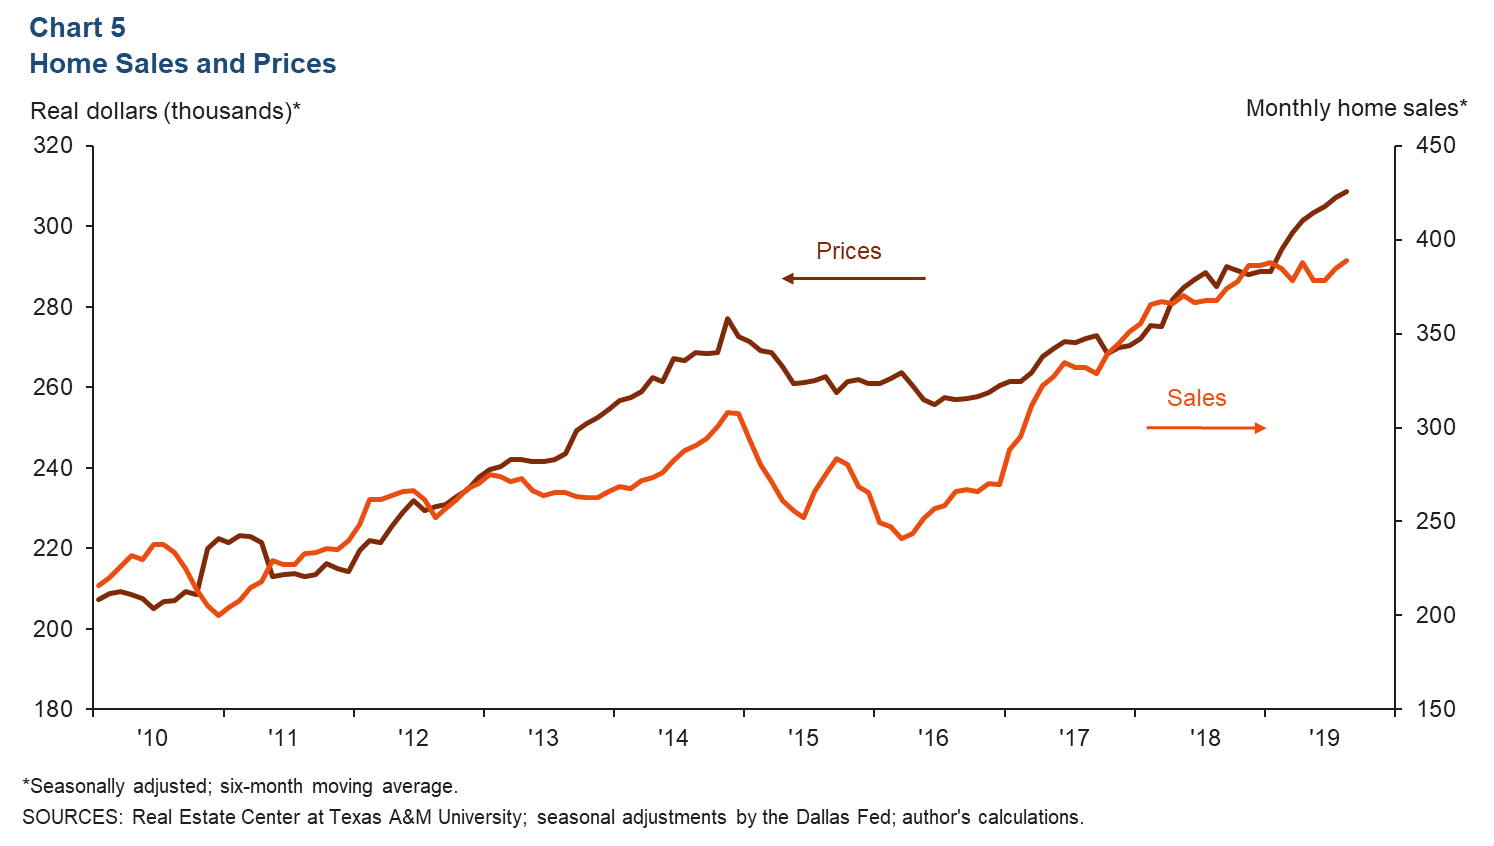
Existing-home sales in the Permian Basin rose further. In August, sales totaled 389, up 5.7 percent from last year, but gains were well below the increases seen in 2017 and 2018 (Chart 5). While the pace of sales growth has slowed, prices continue to climb rapidly. In August, the median home price rose 8.3 percent year over year to $308,634.
Inventories Edge Higher
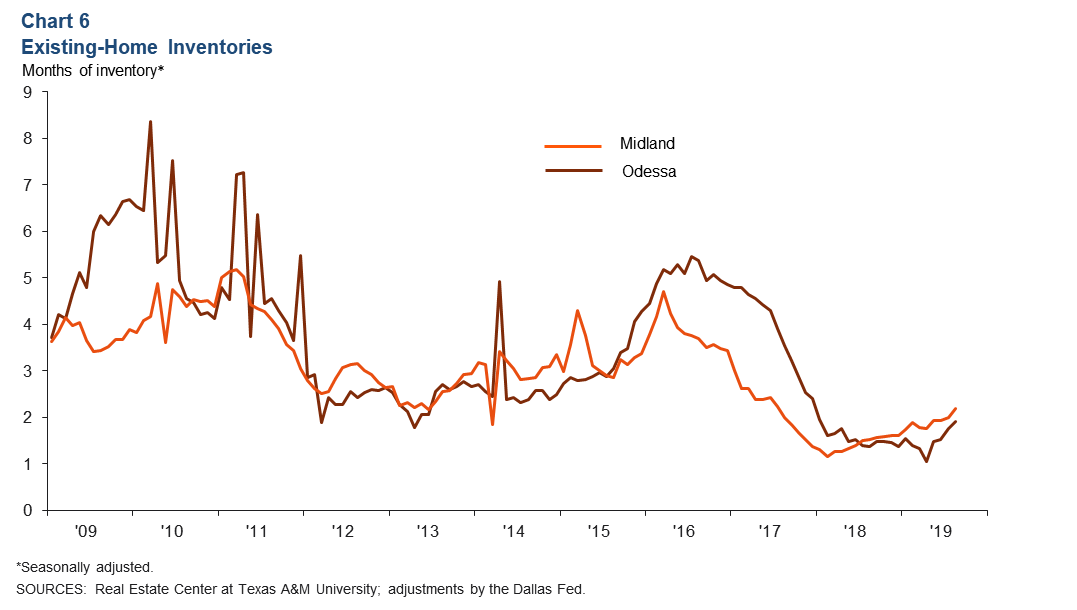
While home inventories in Midland and Odessa remain tight and well below the six months considered to be a balanced market, they have begun to tick up. In August, Midland’s 2.2 months of inventory were up from 1.5 months a year earlier (Chart 6). Odessa’s 1.9 months of inventory were higher than the 1.3 months seen in August 2018.
NOTES: Employment data are for the Midland–Odessa metropolitan statistical area (Martin, Midland and Ector counties), unless otherwise specified. Energy data include the 55 counties in West Texas and southern New Mexico that make up the Permian Basin region. Data may not match previously published numbers due to revisions.
About Permian Basin Economic Indicators
Questions can be addressed to Marycruz De León at marycruz.deleon@dal.frb.org. Permian Basin Economic Indicators is released monthly.