Dallas Fed Energy Survey

Oil and Gas Expansion Still Solid; Cost Increases Moderate, Supply-Chain Delays Persist
Special questions focus on capital spending in 2023; the oil price firms use for budgeting; expectations for how much input prices will change in 2023; the primary factor weighing on crude oil and natural gas production growth; plans for reducing greenhouse emissions; and expectations for oil and gas support services firms’ revenue mix from alternative energy by year-end 2025.
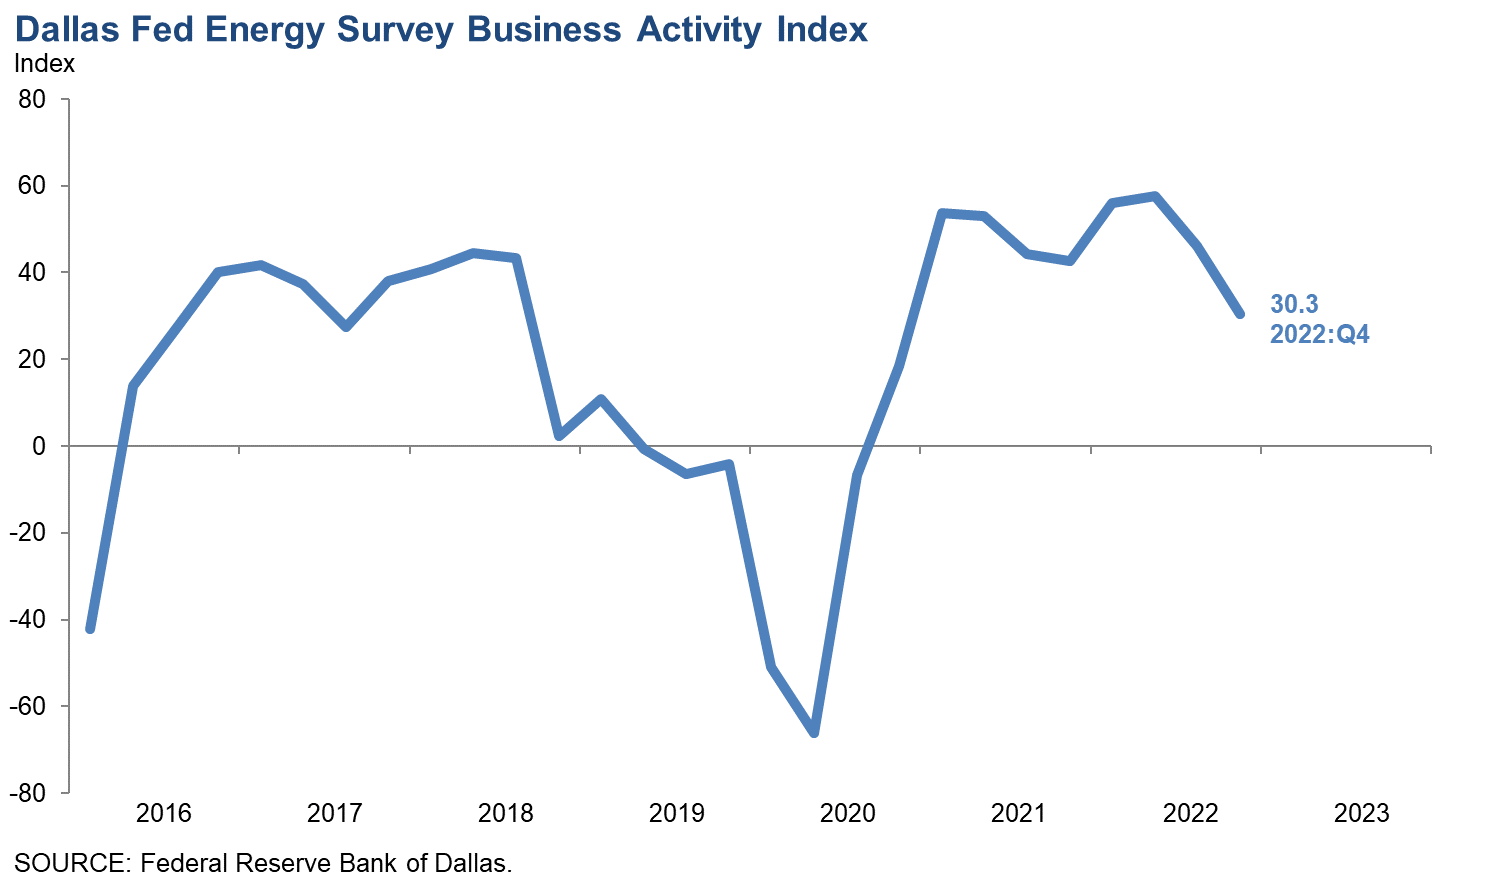
Activity in the oil and gas sector continued growing in fourth quarter 2022, according to oil and gas executives responding to the Dallas Fed Energy Survey. The business activity index—the survey’s broadest measure of conditions facing Eleventh District energy firms—remained positive but fell to 30.3 in the fourth quarter from 46.0 in the third. This suggests the pace of expansion decelerated but remained solid as the business activity index stayed above the series average.
Oil and natural gas production increased at a slightly slower pace compared with the prior quarter, according to executives at exploration and production (E&P) firms. The oil production index declined to 25.8 in the fourth quarter from 31.7 in the third. Likewise, the natural gas production index moved down, to 29.4 from 35.6.
Firms reported rising costs for an eighth consecutive quarter, with the indexes remaining elevated. However, the rate of those increases has slowed. Among oilfield services firms, the input cost index was 61.8 versus 83.9 last quarter. Among E&P firms, the finding and development costs index was 52.5, a modest decline from 64.7 last quarter. Additionally, the lease operating expenses index dropped 22 points to 48.4.
It is taking longer for firms to receive materials and equipment, although the pace at which those delays is growing has moderated. The supplier delivery time index remained positive but declined to 14.4 in the fourth quarter from 28.4 in the third. Among oilfield services firms, the measure of lag time in delivery of services edged down to 20.0 from 21.1, remaining well above average.
Oilfield services firms reported broad-based improvement, with key indexes remaining solidly positive. The equipment utilization index fell to 32.8 in the fourth quarter from 55.2 in the prior quarter. The operating margin index edged up to 25.9 from 25.4. The index of prices received for services remained positive but declined to 43.6 from 64.9.
All labor market indexes in the fourth quarter remained elevated, pointing to strong growth in employment, hours and wages. The aggregate employment index posted an eighth consecutive positive reading but moved down to 25.7 from last quarter’s series high of 30.0. The aggregate employee hours index moved down to 27.7 from 33.3 in the prior quarter. The aggregate wages and benefits index remained positive but declined to 40.2 from 47.3.
Optimism waned in the fourth quarter as the company outlook index posted a 10th consecutive positive reading but fell 20 points, below the series average, to 13.1. The overall outlook uncertainty index increased to 40.1 from 35.7, suggesting growing uncertainty, especially among E&P firms. The uncertainty index was 30.9 for services firms versus 45.4 for E&P firms, with 53 percent of E&P firms reporting an increase in uncertainty.
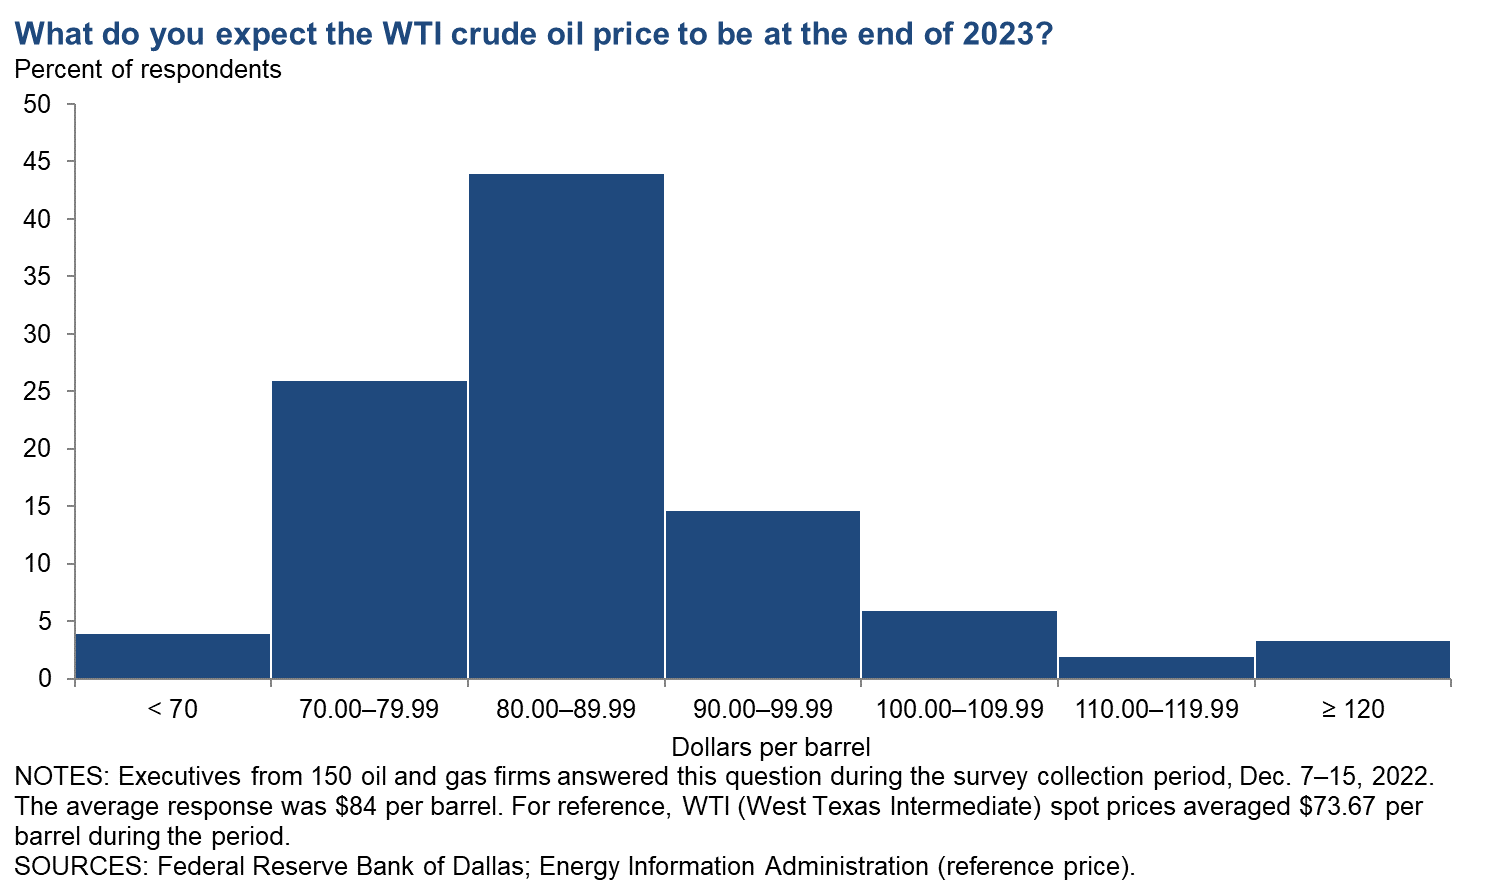
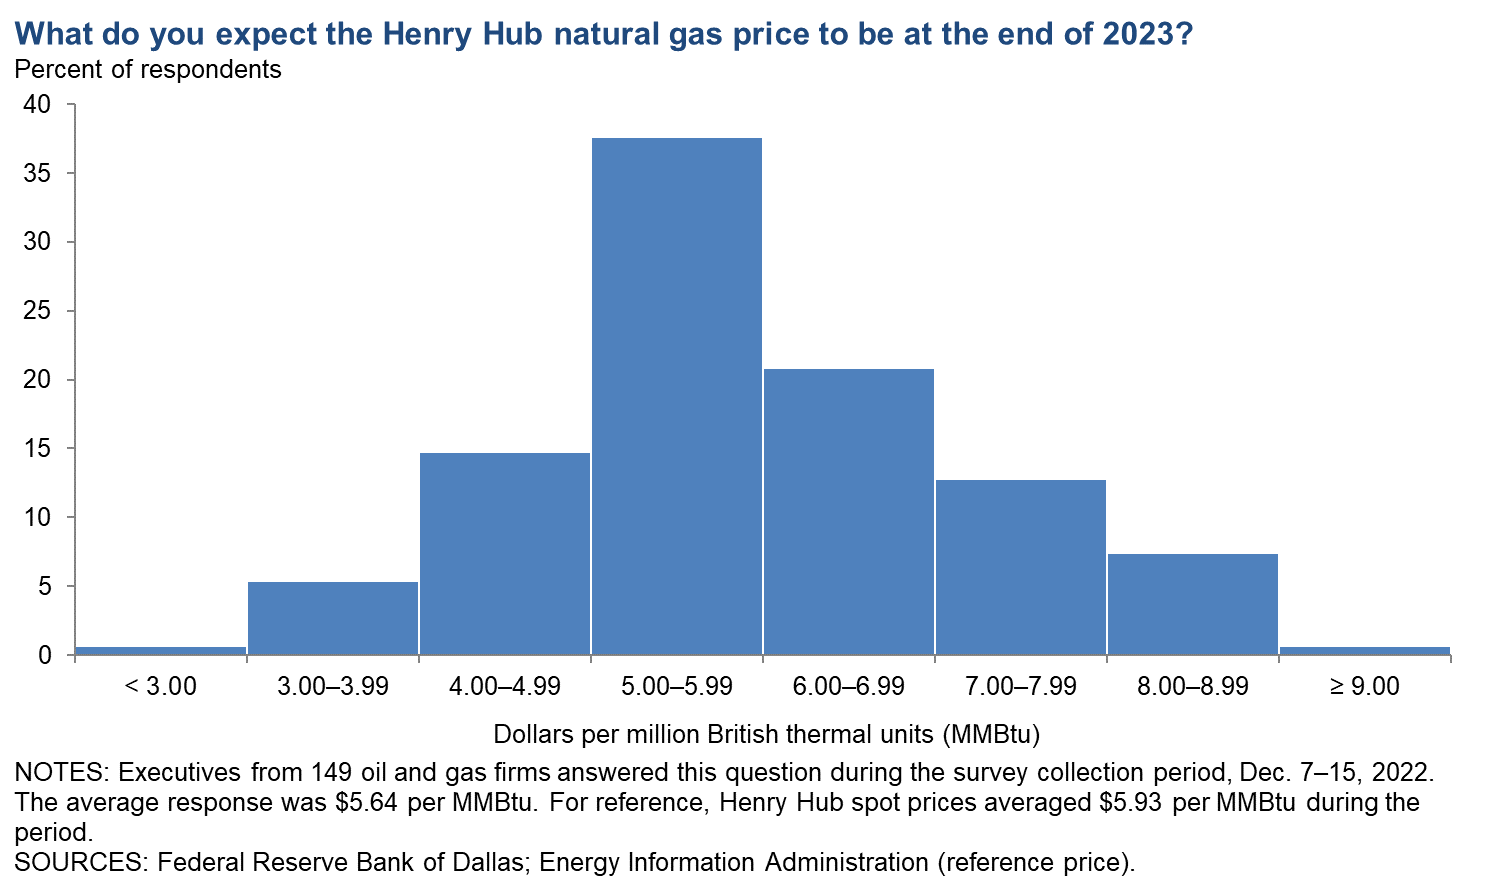
On average, respondents expect a West Texas Intermediate (WTI) oil price of $84 per barrel by year-end 2023; responses ranged from $65 to $160 per barrel. Survey participants expect Henry Hub natural gas prices of $5.64 per million British thermal units (MMBtu) at year-end. For reference, WTI spot prices averaged $73.67 per barrel during the survey collection period, and Henry Hub spot prices averaged $5.93 per MMBtu.
Next release: March 29, 2023
Data were collected Dec. 7–15, and 152 energy firms responded. Of the respondents, 97 were exploration and production firms and 55 were oilfield services firms.
The Dallas Fed conducts the Dallas Fed Energy Survey quarterly to obtain a timely assessment of energy activity among oil and gas firms located or headquartered in the Eleventh District. Firms are asked whether business activity, employment, capital expenditures and other indicators increased, decreased or remained unchanged compared with the prior quarter and with the same quarter a year ago. Survey responses are used to calculate an index for each indicator. Each index is calculated by subtracting the percentage of respondents reporting a decrease from the percentage reporting an increase. When the share of firms reporting an increase exceeds the share reporting a decrease, the index will be greater than zero, suggesting the indicator has increased over the previous quarter. If the share of firms reporting a decrease exceeds the share reporting an increase, the index will be below zero, suggesting the indicator has decreased over the previous quarter.
Price Forecasts
West Texas Intermediate Crude
| West Texas Intermediate crude oil price (dollars per barrel), year-end 2023 | ||||
| Indicator | Survey Average | Low Forecast | High Forecast | Price During Survey |
Current quarter | $83.63 | $65.00 | $160.00 | $73.67 |
Prior quarter | N/A | N/A | N/A | N/A |
| NOTE: Price during survey is an average of daily spot prices during the survey collection period. SOURCES: Energy Information Administration; Federal Reserve Bank of Dallas. | ||||
Henry Hub Natural Gas
| Henry Hub natural gas price (dollars per MMBtu), year-end 2023 | ||||
| Indicator | Survey Average | Low Forecast | High Forecast | Price During Survey |
Current quarter | $5.64 | $2.50 | $9.00 | $5.93 |
Prior quarter | N/A | N/A | N/A | N/A |
| NOTE: Price during survey is an average of daily spot prices during the survey collection period. SOURCES: Federal Reserve Bank of Dallas; Energy Information Administration. | ||||
Special Questions
Data were collected Dec. 7–15, 2022; 150 oil and gas firms responded to the special questions survey.
All Firms
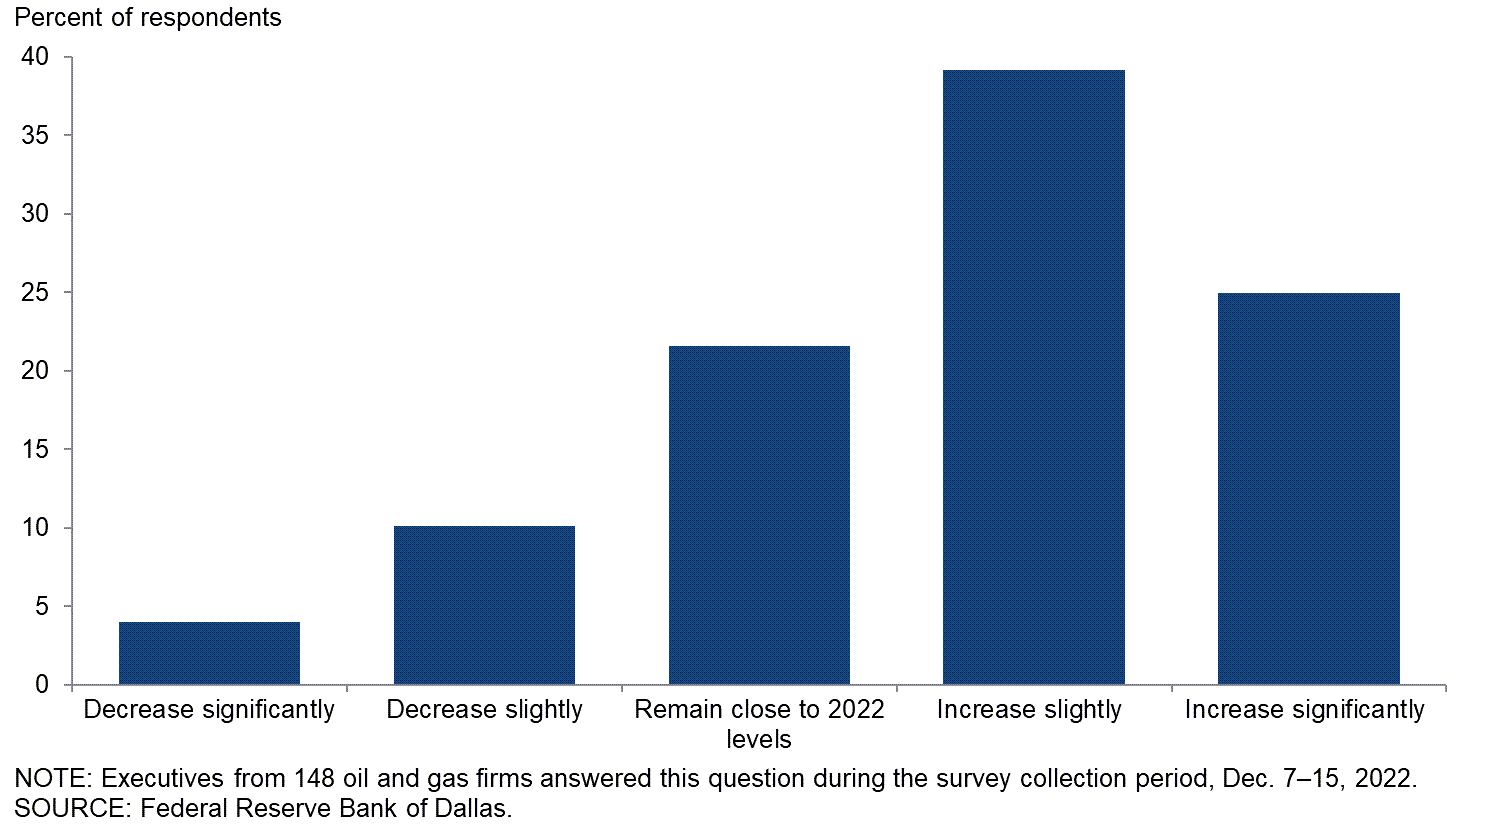
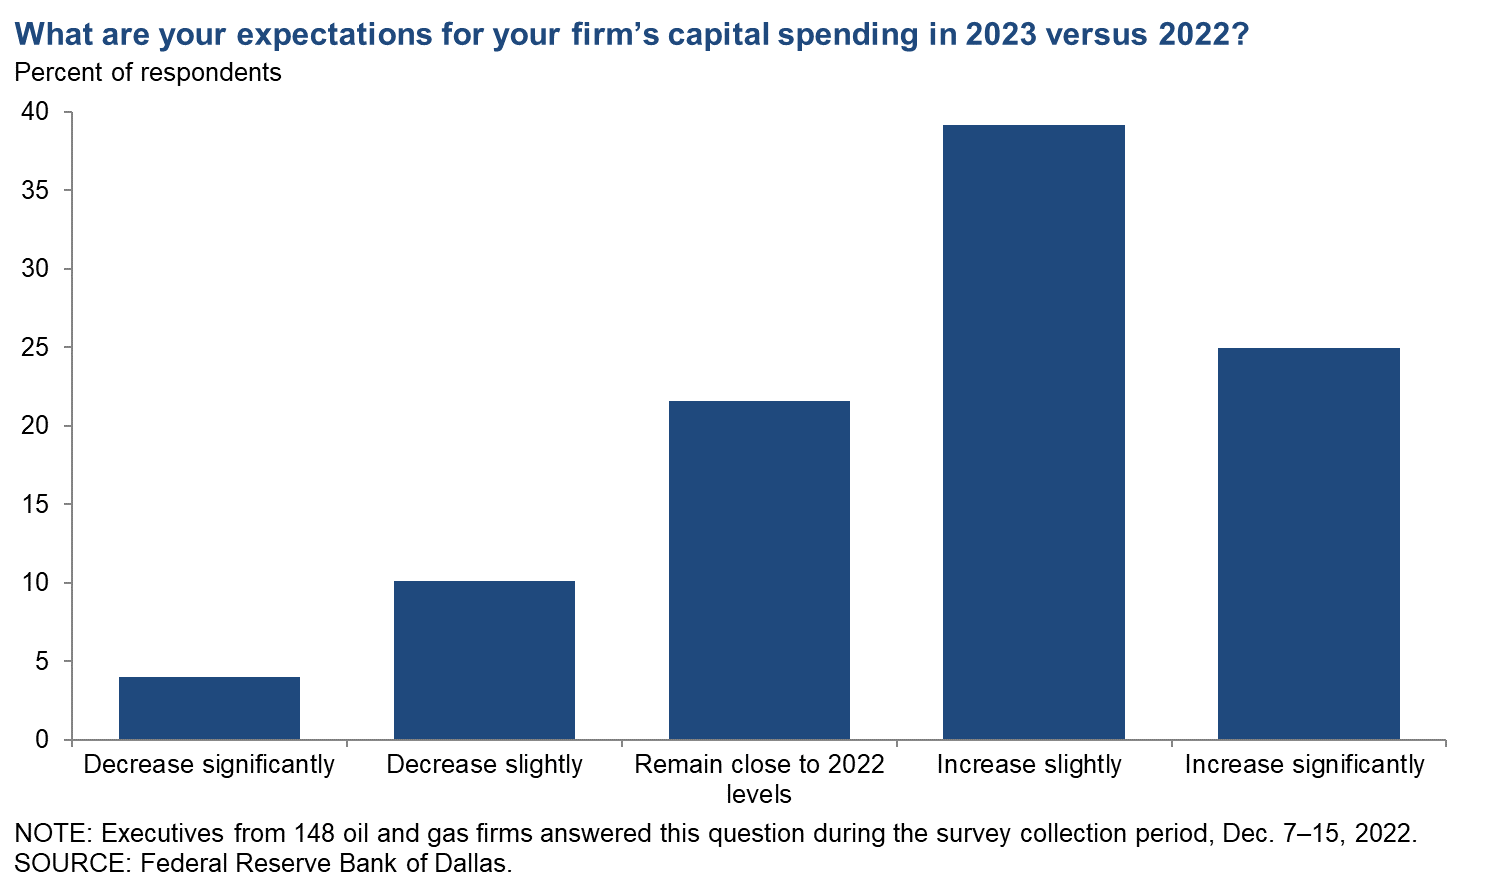
What are your expectations for your firm’s capital spending in 2023 versus 2022?
Most executives expect their firm’s capital spending to rise in 2023 compared with 2022. Thirty-nine percent of executives said they expect capital spending to increase slightly, while an additional 25 percent anticipate a significant increase. Twenty-two percent expect spending in 2023 to remain close to 2022 levels. Only 14 percent anticipate reductions in spending in 2023.
A breakdown of the data for exploration and production (E&P) compared with oil and gas support services can be found in the table below.
| Response | Percent of respondents (among each group) | ||
| All firms | E&P | Services | |
| Increase significantly | 25 | 27 | 21 |
| Increase slightly | 39 | 37 | 43 |
| Remain close to 2022 levels | 22 | 24 | 17 |
| Decrease slightly | 10 | 9 | 11 |
| Decrease significantly | 4 | 2 | 8 |
| NOTES: Executives from 95 exploration and production firms and 53 oil and gas support services firms answered this question during the survey collection period, Dec. 7–15, 2022. The “All” column reports the percentage out of the total 148 responses. The “E&P” column reports the percentage for exploration and production firms and “Services” reports the percentage for oil and gas support services firms. Percentages may not sum to 100 due to rounding. SOURCE: Federal Reserve Bank of Dallas. |
|||
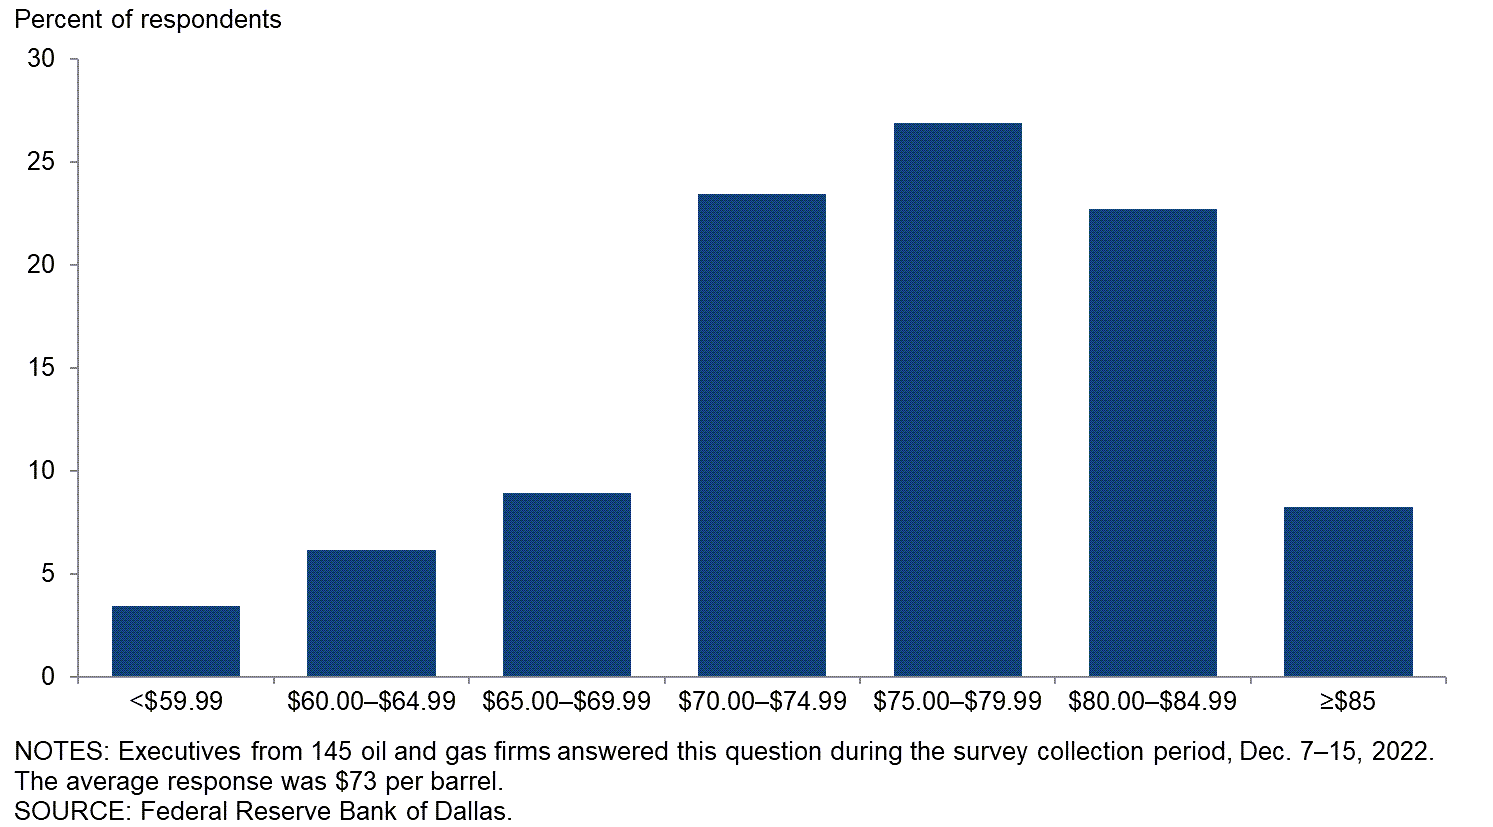
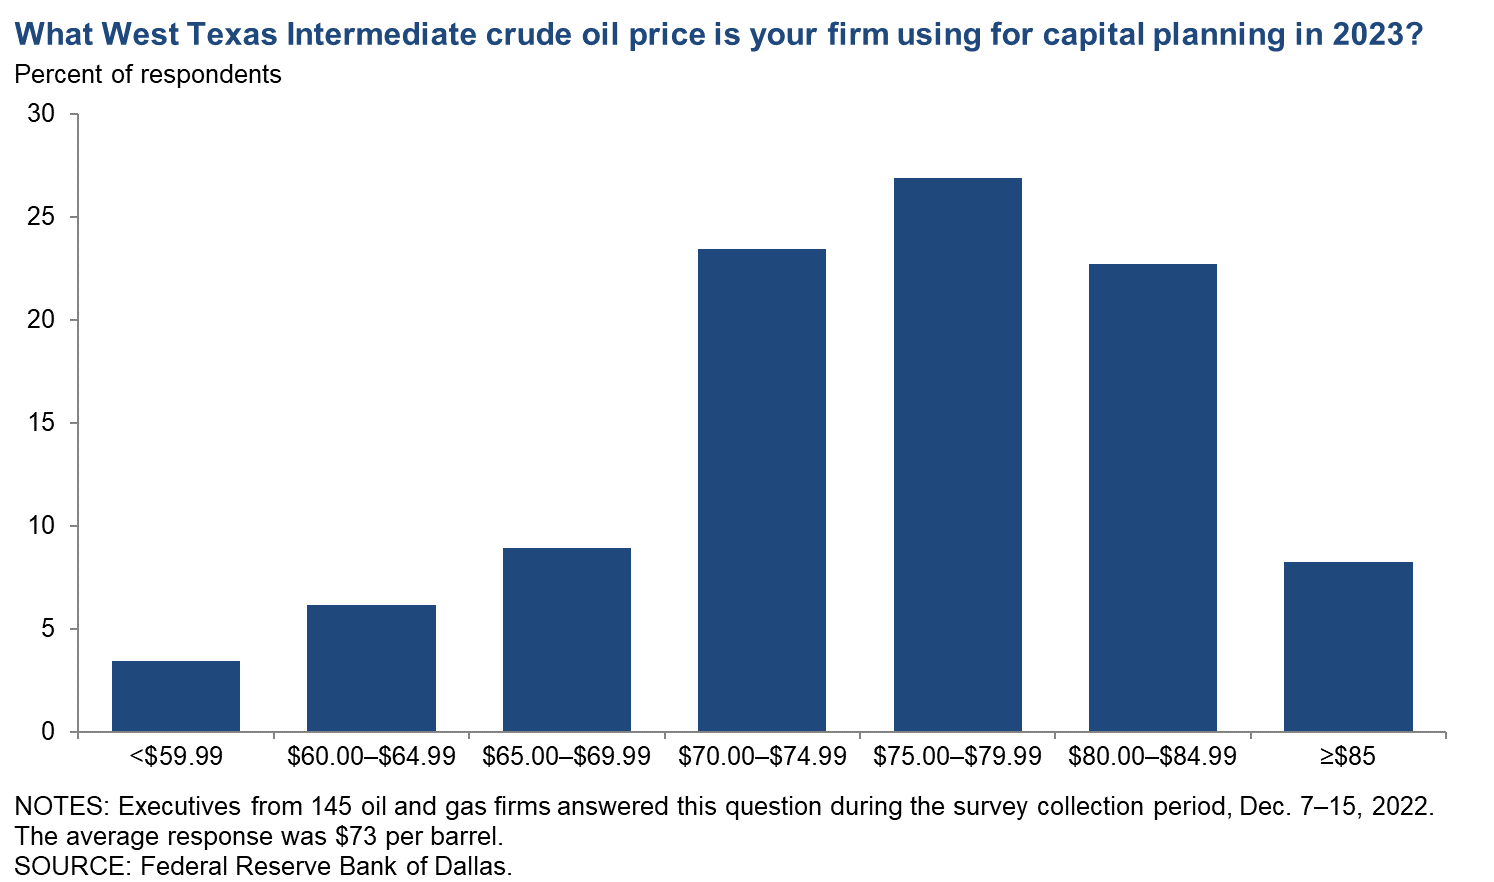
What West Texas Intermediate crude oil price is your firm using for capital planning in 2023?
For this special question, executives were asked to provide the WTI price they used for planning their capital expenditures in 2023. The average response was $73 per barrel, with the median and the mode at $75 per barrel. The average price used is higher relative to what was used for prior budgets (2019, $54; 2020, $54; 2021, $44; 2022, $64).
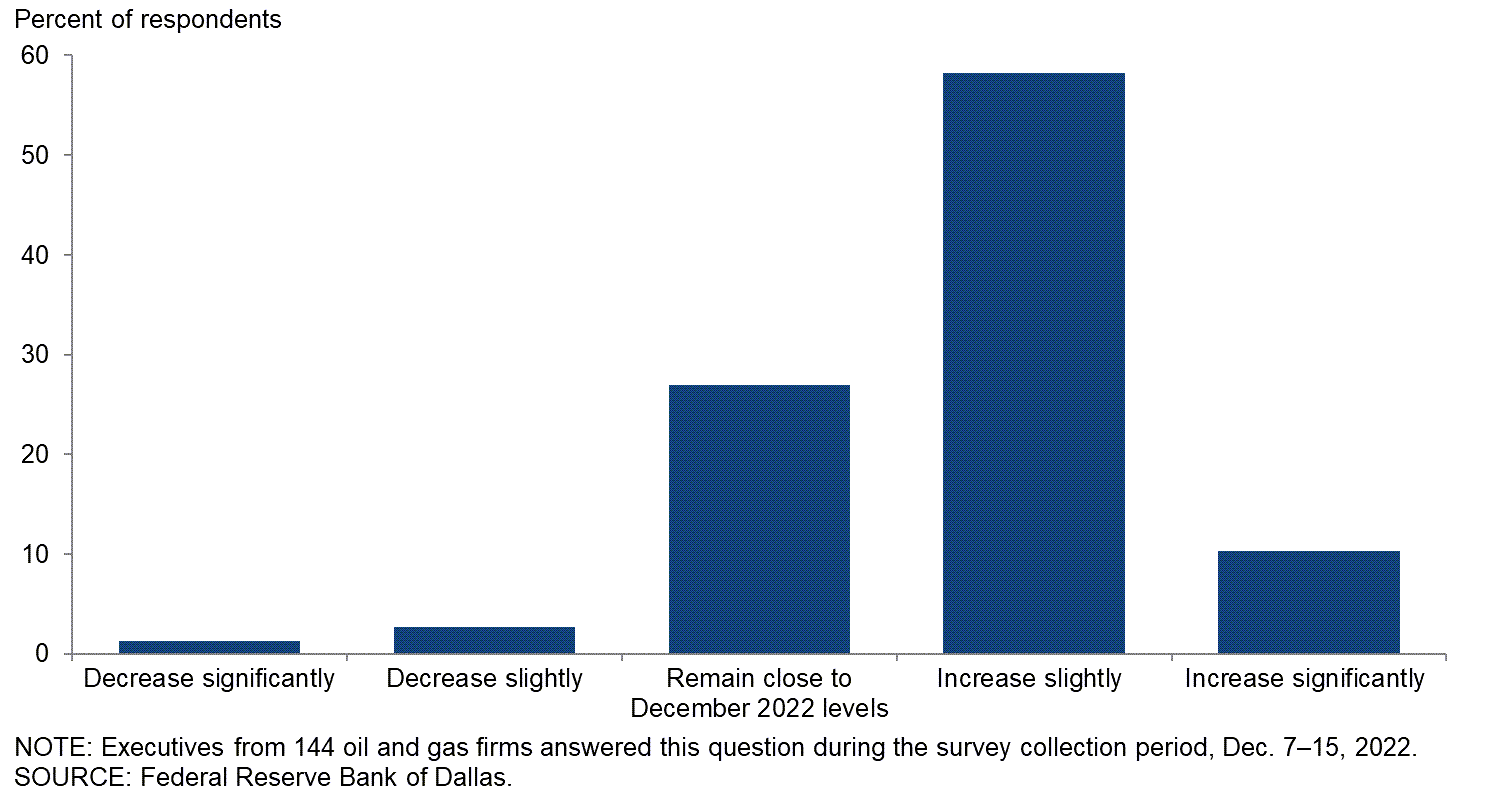
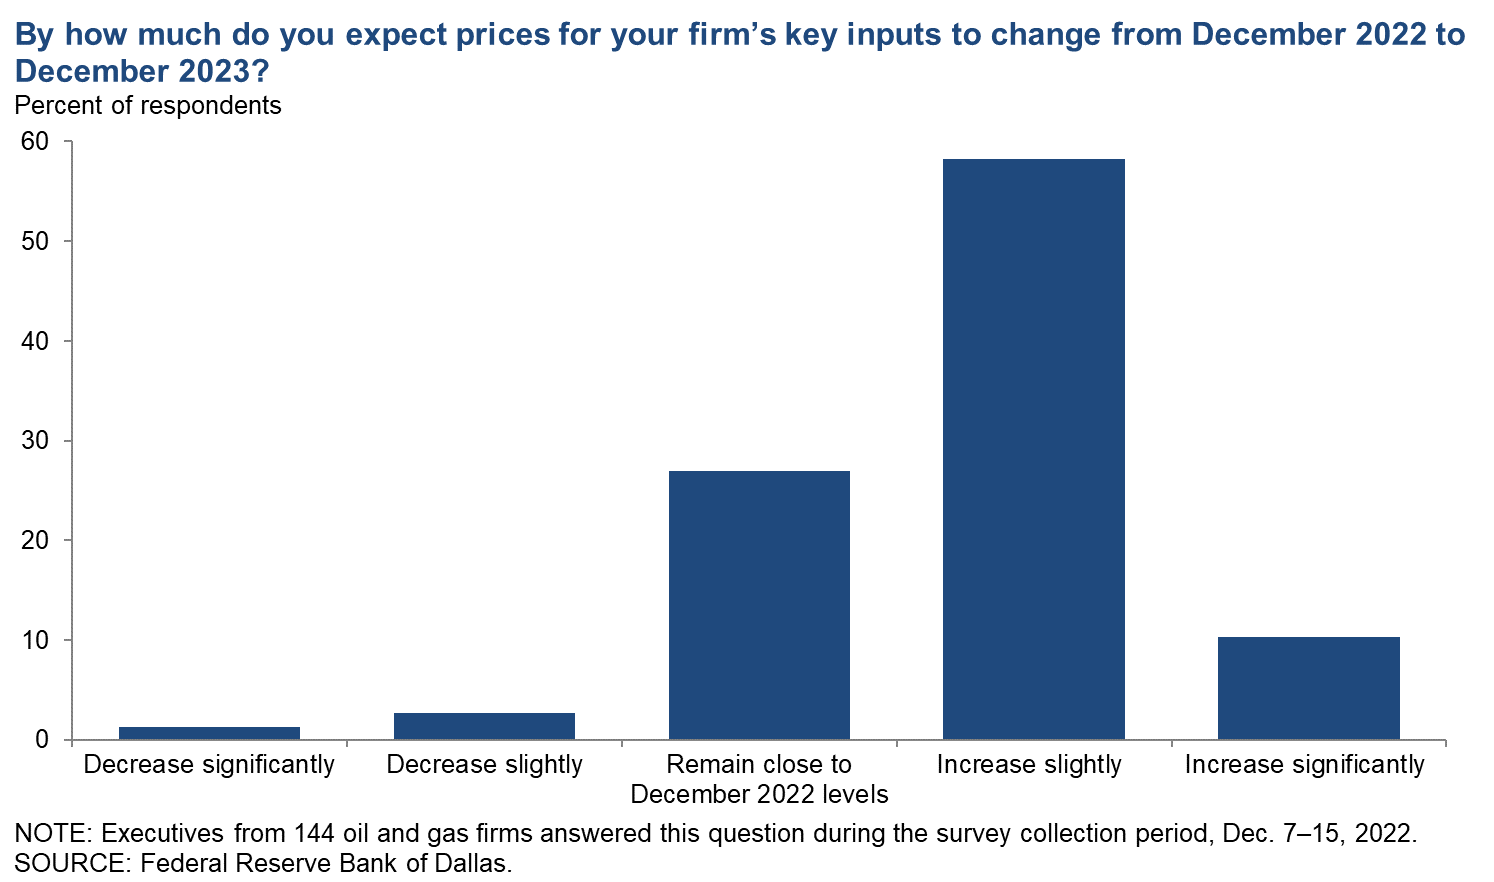
By how much do you expect prices for your firm’s key inputs to change from December 2022 to December 2023?
Most executives expect prices for their firm’s key inputs to rise in 2023 compared with 2022. Fifty-eight percent of executives said they expect prices for key inputs to increase slightly, while an additional 10 percent anticipate a significant increase. Twenty-seven percent expect prices in 2023 to remain close to 2022 levels. Only 4 percent expect reductions in input prices in 2023.
A breakdown of the data for exploration and production (E&P) compared with oil and gas support services can be found in the table below.
| Response | Percent of respondents (among each group) | ||
| All firms | E&P | Services | |
| Increase significantly | 10 | 14 | 4 |
| Increase slightly | 58 | 55 | 64 |
| Remain close to December 2022 levels | 27 | 24 | 32 |
| Decrease slightly | 3 | 4 | 0 |
| Decrease significantly | 1 | 2 | 0 |
| NOTES: Executives from 91 exploration and production firms and 53 oil and gas support services firms answered this question during the survey collection period, Dec. 7–15, 2022. The “All” column reports the percentage out of the total 144 responses. The “E&P” column reports the percentage for exploration and production firms and “Services” reports the percentage for oil and gas support services firms. Percentages may not sum to 100 due to rounding. SOURCE: Federal Reserve Bank of Dallas. |
|||
Exploration and Production (E&P) Firms
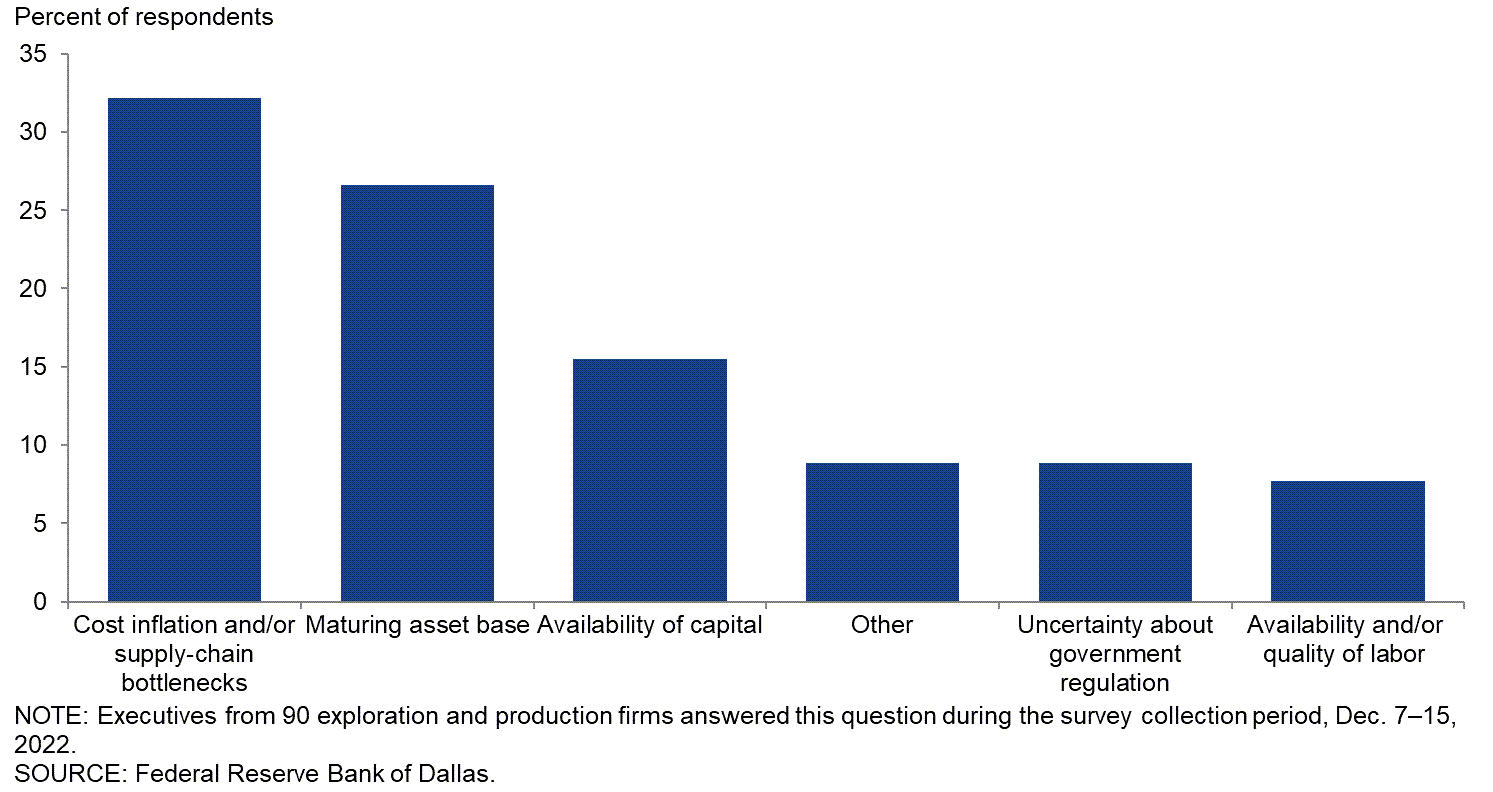
Which of the following is the biggest drag on crude oil and natural gas production growth for your firm?
Thirty-two percent of executives at exploration and production (E&P) firms selected “cost inflation and/or supply-chain bottlenecks.” A total of 27 percent chose “maturing asset base” and 16 percent indicated “availability of capital.” Other options each received 9 percent or less.
Which of the following plans does your firm have? (Check all that apply.)
E&P firms were first asked to define their size based on fourth quarter 2022 crude oil production. They were then asked if they had any of the following plans: to reduce carbon emissions; reduce methane emissions; reduce flaring; recycle/reuse water; invest in renewables. Respondents could choose more than one answer for this special question.
Firms were classified as “small” if they produced fewer than 10,000 barrels per day (b/d) or “large” if they produced 10,000 b/d or more. In the U.S., small E&P firms are greater in number, but large E&P firms make up the majority of production (more than 80 percent).
For the larger firms, 65 percent of executives said their firm plans to reduce CO2 emissions, 65 percent indicated plans to reduce methane emissions, 61 percent to reduce flaring, 48 percent to recycle/reuse water and 17 percent to invest in renewables.
For the smaller firms, 43 percent of executives said their firm plans to reduce flaring, 38 percent anticipate reducing methane emissions, 25 percent plan to recycle/reuse water, 22 percent to reduce CO2 emissions and 2 percent to invest in renewables. Among the smaller firms, 35 percent said they have no mitigation plans, compared with 17 percent of large E&P firms. Relative to when this same question was asked in fourth quarter 2021, the share of small firms planning to reduce flaring and/or methane emissions has increased. However, the share with mitigation plans among large firms remains largely unchanged since last year.
| Response | Percent of respondents (among each group) | ||
| Small firms | Large firms | All firms | |
| Plan to reduce CO2 emissions | 22 | 65 | 34 |
| Plan to reduce methane emissions | 38 | 65 | 46 |
| Plan to reduce flaring | 43 | 61 | 48 |
| Plan to recycle/reuse water | 25 | 48 | 31 |
| Plan to invest in renewables | 2 | 17 | 6 |
| None of the above | 35 | 17 | 30 |
| NOTES: Executives from 83 exploration and production firms answered this question during the survey collection period, Dec. 7–15, 2022. Small firms produced less than 10,000 barrels per day (b/d) in fourth quarter 2022, while large firms produced 10,000 b/d or more. Responses came from 60 small firms and 23 large firms. SOURCE: Federal Reserve Bank of Dallas. |
|||
By how much do you expect your firm to reduce greenhouse gas emissions from 2020 to 2025 in terms of barrel-of-oil equivalent produced?
Of the large firms, 35 percent said their firm plans to reduce greenhouse gas emissions by more than 10 percent from 2020 to 2025. Among executives of small firms, 10 percent said their company plans to reduce greenhouse gas emissions by more than 10 percent from 2020 to 2025.
Relative to when this same question was asked in fourth quarter 2021, the share of firms targeting specific reductions in greenhouse gas emissions has remained largely unchanged. However, relative to when the same question was asked in fourth quarter 2020, more firms are targeting reductions in greenhouse gas emissions of more than 10 percent.
| Response | Percent of respondents (among each group) | ||
| Small firms | Large firms | All firms | |
| 0% | 18 | 4 | 15 |
| More than 0% but not more than 2.5% | 15 | 9 | 14 |
| More than 2.5% but not more than 5% | 8 | 9 | 9 |
| More than 5% but not more than 7.5% | 3 | 4 | 3 |
| More than 7.5% but not more than 10% | 1 | 0 | 1 |
| More than 10% | 10 | 35 | 16 |
| Don't know | 44 | 39 | 43 |
| NOTES: Executives from 94 exploration and production firms answered this question during the survey collection period, Dec. 7–15, 2022. Small firms produced less than 10,000 b/d in fourth quarter 2022, while large firms produced 10,000 b/d or more. Responses came from 71 small firms and 23 large firms. SOURCE: Federal Reserve Bank of Dallas. |
|||
Oil and Gas Support Services
Taking into account the recent passage of the Inflation Reduction Act, what percentage of your firm’s revenue do you expect to generate from providing services related to alternative energy (such as offshore/onshore wind, solar, geothermal, hydrogen, and carbon capture use and storage) as of the end of 2025?
Forty-three percent of executives at oil and gas support services firms expect their firm to generate some revenue from alternative energy services as of the end of 2025. Of the firms expecting to generate some revenue from alternative energy services, 35 percent expect more than zero but not more than 20 percent from such services, 6 percent of firms anticipate more than 20 percent but not more than 40 percent, and 2 percent of executives indicated more than 40 percent but not more than 60 percent. The remaining 58 percent of executives said they expect their firm to generate no revenue from alternative energy services as of the end of 2025. The results from this question are comparable to when the question was last asked in fourth quarter 2020, before passage of the Inflation Reduction Act in August 2022. The act is estimated to provide $369 billion in energy-related investments over the next 10 years, mostly related to alternative energy. (Percentages don’t sum to 100 due to rounding.)
| Response | Percent of respondents | ||
| 0% | 58 | ||
| More than 0% but not more than 20% | 35 | ||
| More than 20% but not more than 40% | 6 | ||
| More than 40% but not more than 60% | 2 | ||
| More than 60% but not more than 80% | 0 | ||
| More than 80% | 0 | ||
| NOTES: Executives from 52 oil and gas support services firms answered this question during the survey collection period, Dec. 7–15, 2022. Percentages don’t sum to 100 due to rounding. SOURCE: Federal Reserve Bank of Dallas. |
|||
Special Questions Comments
Exploration and Production (E&P) Firms
- Energy policies have become so random as to be laughable, except for the fact that the increased vitriol and regulations and fees are quite successful at killing large segments of the energy industry. I have not been so discouraged since I was living in Bakersfield in the mid-’80s when the price dropped to $6 per barrel, and I was a young employee.
- Even the Vatican is telling folks not to invest in oil! The Vatican released its first-ever “faith-consistent investing” guidelines, which directed believers to avoid investing in companies that produce things such as fossil fuels. This is yet another anecdotal example of a larger trend that investors do not want exposure to fossil fuels, and the consequence is that commodity prices are likely to remain “sticky to the high side,” given a lack of capital to increase supply in the face of demand that does not appear to be shrinking anytime soon.
- The continued long time to deliver electrical power is a material concern. This delivery of power service drives up costs and leads our company to moderate investment activity. Over the next two to three years, the availability and timely delivery of power is likely in our view to materially reduce oil and gas production growth.
- Emissions reduction is a top engineering challenge for us. Our entire organization has embraced it.
- The 45Q tax credit expansion is causing industrial facilities to do the front-end engineering design work to consider carbon capture and storage along the Gulf Coast. Those who have positioned themselves to provide related services (capture, transportation, sequestration) could benefit.
- I believe that 2023 will be similar to what we’ve seen in 2022, barring any world-shaking events.
- Most of the wells I have interest in are strippers and make essentially no natural gas, so my emissions are negligible to zero.
- Independents are not inclined to take the initiative on greenhouse-gas emissions reduction without knowing what the payoff will be.
Oil and Gas Support Services Firms
- We are looking at the integration of renewable energy sources into our operations. I doubt it will be more than 5 percent of revenue by 2025, but greater than zero.
- Our increase related to alternative energy as of the end of 2025 would have occurred regardless of the Inflation Reduction Act. One does not automatically relate to the other.
Additional Comments »
Historical data are available from first quarter 2016 to the most current release quarter.
Business Indicators: Quarter/Quarter
| Business Indicators: All Firms Current Quarter (versus previous quarter) | |||||
| Indicator | Current Index | Previous Index | % Reporting Increase | % Reporting No Change | % Reporting Decrease |
Level of Business Activity | 30.3 | 46.0 | 37.5 | 55.3 | 7.2 |
Capital Expenditures | 40.1 | 47.3 | 50.0 | 40.1 | 9.9 |
Supplier Delivery Time | 14.4 | 28.4 | 28.9 | 56.6 | 14.5 |
Employment | 25.7 | 30.0 | 30.3 | 65.1 | 4.6 |
Employee Hours | 27.7 | 33.3 | 33.6 | 60.5 | 5.9 |
Wages and Benefits | 40.2 | 47.3 | 42.8 | 54.6 | 2.6 |
| Indicator | Current Index | Previous Index | % Reporting Improved | % Reporting No Change | % Reporting Worsened |
Company Outlook | 13.1 | 33.1 | 31.0 | 51.0 | 17.9 |
| Indicator | Current Index | Previous Index | % Reporting Increase | % Reporting No Change | % Reporting Decrease |
Uncertainty | 40.1 | 35.7 | 48.7 | 42.8 | 8.6 |
| Business Indicators: E&P Firms Current Quarter (versus previous quarter) | |||||
| Indicator | Current Index | Previous Index | % Reporting Increase | % Reporting No Change | % Reporting Decrease |
Level of Business Activity | 29.9 | 37.2 | 35.1 | 59.8 | 5.2 |
Oil Production | 25.8 | 31.7 | 37.1 | 51.5 | 11.3 |
Natural Gas Wellhead Production | 29.4 | 35.6 | 36.8 | 55.8 | 7.4 |
Capital Expenditures | 38.2 | 47.6 | 49.5 | 39.2 | 11.3 |
Expected Level of Capital Expenditures Next Year | 35.0 | 43.8 | 47.4 | 40.2 | 12.4 |
Supplier Delivery Time | 18.6 | 27.9 | 29.9 | 58.8 | 11.3 |
Employment | 14.4 | 17.2 | 19.6 | 75.3 | 5.2 |
Employee Hours | 16.4 | 20.2 | 21.6 | 73.2 | 5.2 |
Wages and Benefits | 36.0 | 38.0 | 38.1 | 59.8 | 2.1 |
Finding and Development Costs | 52.5 | 64.7 | 54.6 | 43.3 | 2.1 |
Lease Operating Expenses | 48.4 | 70.2 | 53.6 | 41.2 | 5.2 |
| Indicator | Current Index | Previous Index | % Reporting Improved | % Reporting No Change | % Reporting Worsened |
Company Outlook | 6.5 | 25.0 | 26.1 | 54.3 | 19.6 |
| Indicator | Current Index | Previous Index | % Reporting Increase | % Reporting No Change | % Reporting Decrease |
Uncertainty | 45.4 | 45.2 | 52.6 | 40.2 | 7.2 |
| Business Indicators: O&G Support Services Firms Current Quarter (versus previous quarter) | |||||
| Indicator | Current Index | Previous Index | % Reporting Increase | % Reporting No Change | % Reporting Decrease |
Level of Business Activity | 30.9 | 62.1 | 41.8 | 47.3 | 10.9 |
Utilization of Equipment | 32.8 | 55.2 | 45.5 | 41.8 | 12.7 |
Capital Expenditures | 43.6 | 46.6 | 50.9 | 41.8 | 7.3 |
Supplier Delivery Time | 7.3 | 29.3 | 27.3 | 52.7 | 20.0 |
Lag Time in Delivery of Firm's Services | 20.0 | 21.1 | 23.6 | 72.7 | 3.6 |
Employment | 45.5 | 53.5 | 49.1 | 47.3 | 3.6 |
Employment Hours | 47.2 | 56.9 | 54.5 | 38.2 | 7.3 |
Wages and Benefits | 47.3 | 63.8 | 50.9 | 45.5 | 3.6 |
Input Costs | 61.8 | 83.9 | 67.3 | 27.3 | 5.5 |
Prices Received for Services | 43.6 | 64.9 | 50.9 | 41.8 | 7.3 |
Operating Margin | 25.9 | 25.4 | 42.6 | 40.7 | 16.7 |
| Indicator | Current Index | Previous Index | % Reporting Improved | % Reporting No Change | % Reporting Worsened |
Company Outlook | 24.5 | 47.3 | 39.6 | 45.3 | 15.1 |
| Indicator | Current Index | Previous Index | % Reporting Increase | % Reporting No Change | % Reporting Decrease |
Uncertainty | 30.9 | 17.8 | 41.8 | 47.3 | 10.9 |
Business Indicators: Year/Year
| Business Indicators: All Firms Current Quarter (versus same quarter a year ago) | |||||
| Indicator | Current Index | Previous Index | % Reporting Increase | % Reporting No Change | % Reporting Decrease |
Level of Business Activity | 59.3 | 66.0 | 68.3 | 22.8 | 9.0 |
Capital Expenditures | 58.4 | 69.6 | 68.8 | 20.8 | 10.4 |
Supplier Delivery Time | 41.7 | 39.3 | 55.6 | 30.6 | 13.9 |
Employment | 41.6 | 39.4 | 47.9 | 45.8 | 6.3 |
Employee Hours | 43.1 | 42.5 | 50.0 | 43.1 | 6.9 |
Wages and Benefits | 68.3 | 63.2 | 71.7 | 24.8 | 3.4 |
| Indicator | Current Index | Previous Index | % Reporting Improved | % Reporting No Change | % Reporting Worsened |
Company Outlook | 57.6 | 66.6 | 68.2 | 21.2 | 10.6 |
| Business Indicators: E&P Firms Current Quarter (versus same quarter a year ago) | |||||
| Indicator | Current Index | Previous Index | % Reporting Increase | % Reporting No Change | % Reporting Decrease |
Level of Business Activity | 52.7 | 55.5 | 62.4 | 28.0 | 9.7 |
Oil Production | 44.0 | 49.0 | 59.1 | 25.8 | 15.1 |
Natural Gas Wellhead Production | 36.7 | 46.4 | 50.0 | 36.7 | 13.3 |
Capital Expenditures | 53.2 | 69.4 | 65.2 | 22.8 | 12.0 |
Expected Level of Capital Expenditures Next Year | 58.5 | 58.8 | 65.2 | 28.1 | 6.7 |
Supplier Delivery Time | 47.8 | 41.8 | 56.5 | 34.8 | 8.7 |
Employment | 31.1 | 27.6 | 36.7 | 57.8 | 5.6 |
Employee Hours | 30.5 | 28.2 | 37.0 | 56.5 | 6.5 |
Wages and Benefits | 64.5 | 58.6 | 67.7 | 29.0 | 3.2 |
Finding and Development Costs | 75.0 | 78.8 | 79.3 | 16.3 | 4.3 |
Lease Operating Expenses | 75.8 | 85.9 | 78.0 | 19.8 | 2.2 |
| Indicator | Current Index | Previous Index | % Reporting Improved | % Reporting No Change | % Reporting Worsened |
Company Outlook | 54.6 | 63.1 | 65.1 | 24.4 | 10.5 |
| Business Indicators: O&G Support Services Firms Current Quarter (versus same quarter a year ago) | |||||
| Indicator | Current Index | Previous Index | % Reporting Increase | % Reporting No Change | % Reporting Decrease |
Level of Business Activity | 71.1 | 84.2 | 78.8 | 13.5 | 7.7 |
Utilization of Equipment | 69.2 | 82.5 | 75.0 | 19.2 | 5.8 |
Capital Expenditures | 67.3 | 70.1 | 75.0 | 17.3 | 7.7 |
Supplier Delivery Time | 30.7 | 35.1 | 53.8 | 23.1 | 23.1 |
Lag Time in Delivery of Firm's Services | 42.4 | 33.9 | 46.2 | 50.0 | 3.8 |
Employment | 59.6 | 59.7 | 67.3 | 25.0 | 7.7 |
Employment Hours | 65.4 | 66.6 | 73.1 | 19.2 | 7.7 |
Wages and Benefits | 75.0 | 71.4 | 78.8 | 17.3 | 3.8 |
Input Costs | 78.9 | 92.6 | 80.8 | 17.3 | 1.9 |
Prices Received for Services | 69.2 | 82.5 | 75.0 | 19.2 | 5.8 |
Operating Margin | 47.1 | 52.8 | 60.8 | 25.5 | 13.7 |
| Indicator | Current Index | Previous Index | % Reporting Improved | % Reporting No Change | % Reporting Worsened |
Company Outlook | 63.0 | 72.7 | 73.9 | 15.2 | 10.9 |
Activity Chart
Comments from Survey Respondents
These comments are from respondents’ completed surveys and have been edited for publication. Comments from the Special Questions survey can be found below the special questions.
Exploration and Production (E&P) Firms
- Labor is an issue that is affecting our firm. The government can remove all regulations and timetables, and the amount of increase in activity would not be affected by more than 10 percent. Automation cannot drill wells, move rigs and build locations.
- Raising capital is a real problem that is exacerbated by the administration constantly yacking about putting the oil and gas industry out of business. That is not helpful. It has been obvious for a long time now that their plan is to deprive us of capital sources and regulate us out of business. Like it or not, oil and gas is here to stay for a very long time. Our request is simple: Get out of our way and we will deliver cheap energy.
- Employment continues to be a significant obstacle to growth. We cannot hire the talent we need. Our competitors' employment packages are so good at attracting talent that offers have evolved to a level I have never seen in the 40 years I've been in the business.
- Supply is very limited, and service companies are taking a long time to come and do the work. There is a lack of qualified service workers. New Mexico state agencies are not user friendly with the rules and regulations, but they sure do enjoy the pot load of money the oil and gas industry has given to the general budget. It is very unfortunate that the state government has been very hostile to the oil and gas industry, but at the same time, they want oil and gas revenues that fund the budget by one-third. There is no industry that gives as much as the oil and gas industry. I have asked them to get another industry to take our place. There is none.
- The volatility in commodity prices is creating bid–ask spreads to blow out on transactions. Fewer deals are to be had in this style of environment.
- Inflation continues to be a top-of-mind issue in exploration and production. We are girding ourselves for further cost increases in 2023. This is against a backdrop of commodity price uncertainty and fears of demand destruction owing to recession.
- The administration’s war on the oil and gas industry will cause higher energy prices, extend inflation and weaken our country globally.
- There are enough signs to maintain a bullish long-term [outlook]: a lack of investing versus historical periods, a cooperative OPEC+ willing to limit supply, and a lack of refining capacity. But the demand picture swings on recession uncertainty and China’s reopening response. So although I think the price of oil should creep back up, it is hard to not consider it is just range-bound between $75 and $85 per barrel, which is still very constructive, particularly if cost-of-goods-sold inflation rolls over a bit.
- The decline in the price of oil is of some concern because we are involved in a much higher level of drilling compared to one year ago. Our economics were figured around $80 per-barrel oil, and that could decrease over the next few months.
- First, the lion’s share of inflation is behind us. Some oilfield service markets are expected to show cost deflation in 2023. Second, oilfield service companies are capital disciplined and are managing supply to maintain high margins. This is not healthy for the long-term health of the industry. Operators are unable to secure oilfield services on a “pure” spot basis. Visibility of program details helps in security of supply and earning preferential treatment from suppliers.
- Politics in Washington, California and other states are designed to cause major problems for the industry, and they are being very effective.
- The following issues are affecting our business. First, new emission standards. Second, rising oilfield costs, both lease operating expense and capital expenditures. Third, the threat of extra federal taxation.
- Geopolitical risk, economic uncertainty, material and/or labor shortages and an administration that is hostile to the industry have made it difficult to project what the next 12 to 18 months will be like for the upstream sector.
- Because of the overall world economy, it appears that crude oil demand may continue to slow down while the crude oil supply level remains steady. This will keep downward pressure on oil prices. I still think the overall economics of the industry will remain positive.
- Supply-chain issues and rig availability are still causing problems for our firm.
- People are running scared, and the Federal Reserve rate increases are certainly doing their job.
- Delivery times are still challenging. Costs are continuing to increase.
- Everyone is bearish on natural gas in 2023 and bullish in 2024 and after. Is this too much group think for an obvious trade?
- The U.S. needs to and should build more energy infrastructure immediately: pipelines, liquefied natural gas export facilities, etc. The regulatory and approval process needs to be expedited and improved significantly.
- Supply delivery times are difficult. Inflation affecting operating expenses (wages and salaries) is an issue affecting our business. Also, pending state and federal regulations are impacting operational expenses (most are emissions related).
Oil and Gas Support Services Firms
- Pricing for many services is still below where it should be, while oil and gas producers have enjoyed disproportionate gains from higher oil and gas prices.
- Attracting and retaining labor remains our most significant and intractable challenge. Despite wage and benefit increases, retaining newly hired labor is difficult.
- The labor market continues to be incredibly tight in the Permian Basin. Our company is relying more heavily on rotational employees to service equipment. Permian Basin infrastructure seems to be at max capability. We are seeing an increase in safety incidents due to poor road conditions and traffic.
- Although the mid-term election results likely reduced the risk of further negative administration impacts on the U.S. oil and gas industry (as they do not control both chambers of Congress), the uncertainty of China (COVID-19) and Russia (Ukraine) is creating a great deal of demand uncertainty. Ultimately, global demand for fossil fuels will likely outstrip available supply due to nearly eight years of underinvestment combined with still-constrained capital availability to the industry. The only question is when this violent swing to undersupply will occur. Previously, I thought it could happen by the end of 2022. Today, it seems more likely in second half 2023.
- Regulatory agencies, like the Occupational Safety and Health Administration, have been weaponized in a way that makes it difficult to operate even though the drilling contractor community has an excellent safety track record. There is always room to improve, but we feel they are picking on us for political purposes.
- Leasing has increased and new drilling has increased.
- Regulatory uncertainty from prospective environmental and/or environmental-, social- and governance-driven compliance is an overhang.
- The single biggest challenge to the domestic oil and gas industry is a systemic lack of available capital to conduct exploration activities. New exploration in the United States would add jobs, increase the tax base and lower energy costs for consumers.
Questions regarding the Dallas Fed Energy Survey can be addressed to Michael Plante at Michael.Plante@dal.frb.org or Kunal Patel at Kunal.Patel@dal.frb.org.
Sign up for our email alert to be automatically notified as soon as the latest Dallas Fed Energy Survey is released on the web.