
Mexico Economic Growth Tumbles in First Quarter; Outlook Worsens Considerably
May 8, 2020
Mexico’s gross domestic product (GDP) contracted an annualized 6.2 percent in first quarter 2020—the largest quarterly drop since 2009 during the global financial crisis. The GDP growth forecast for 2020, compiled by Banco de México, was markedly revised down from -3.5 percent in March to -7.1 in April due to the combined impacts of COVID-19 and low oil prices on the Mexican economy. [1]
The latest data available, mostly reflecting pre-COVID-19 conditions, show that exports, industrial production, employment and retail sales fell. Inflation declined as the peso continued losing ground against the dollar in April.
Output Falls in First Quarter 2020
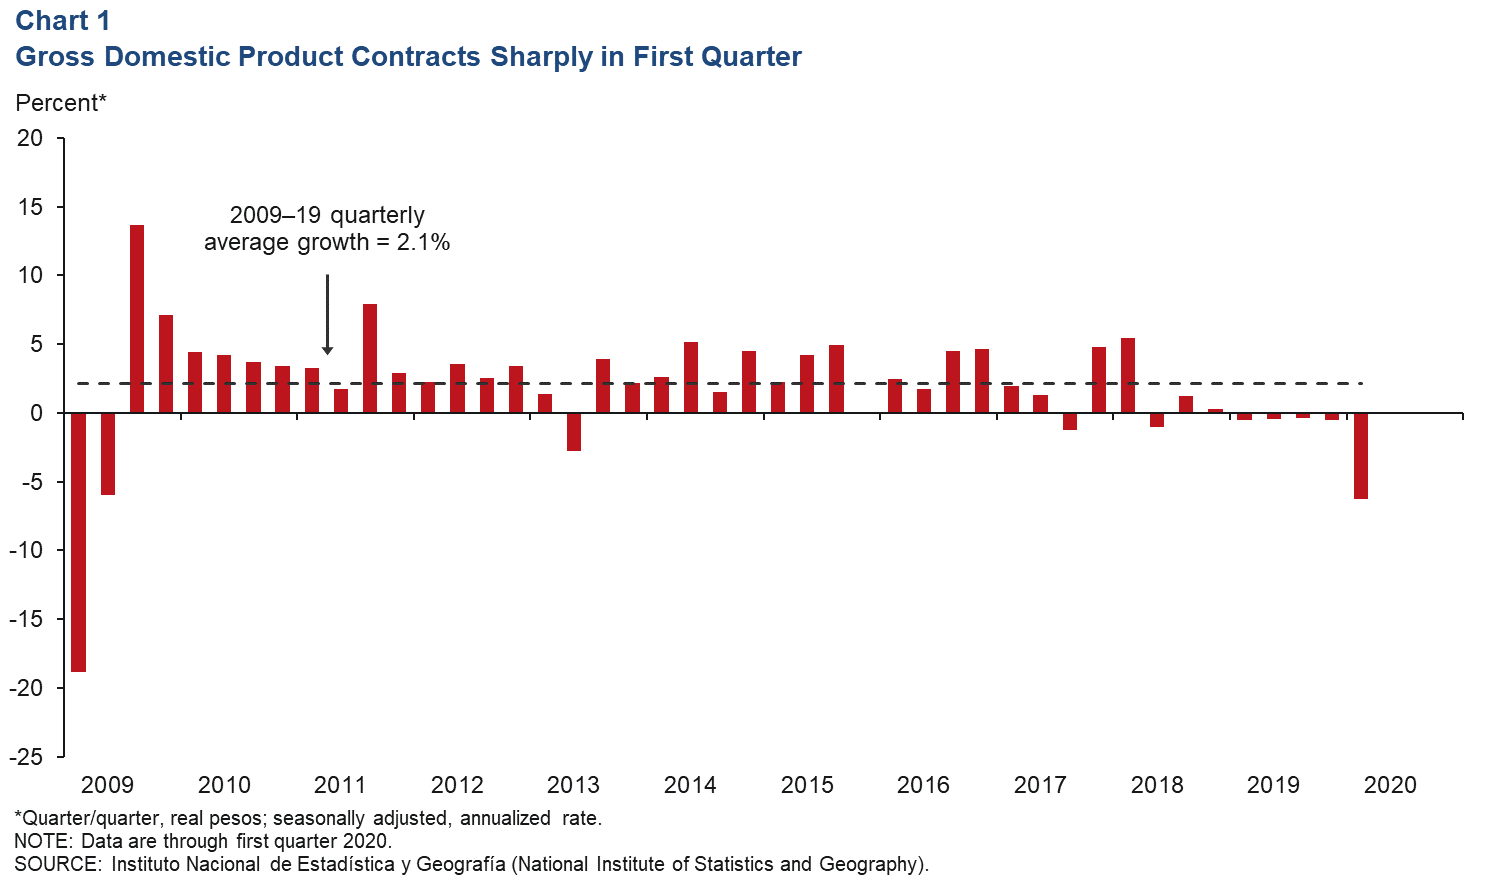
Mexico’s first-quarter GDP dropped by an annualized 6.2 percent, pushing growth further from its long-run average of 2.1 percent (Chart 1). Output from both goods-producing industries (manufacturing, construction, utilities and mining) and service-related activities (wholesale and retail trade, transportation and business services) fell 5.5 percent. Agricultural output rose 2.0 percent.[2]
Exports Tick Down
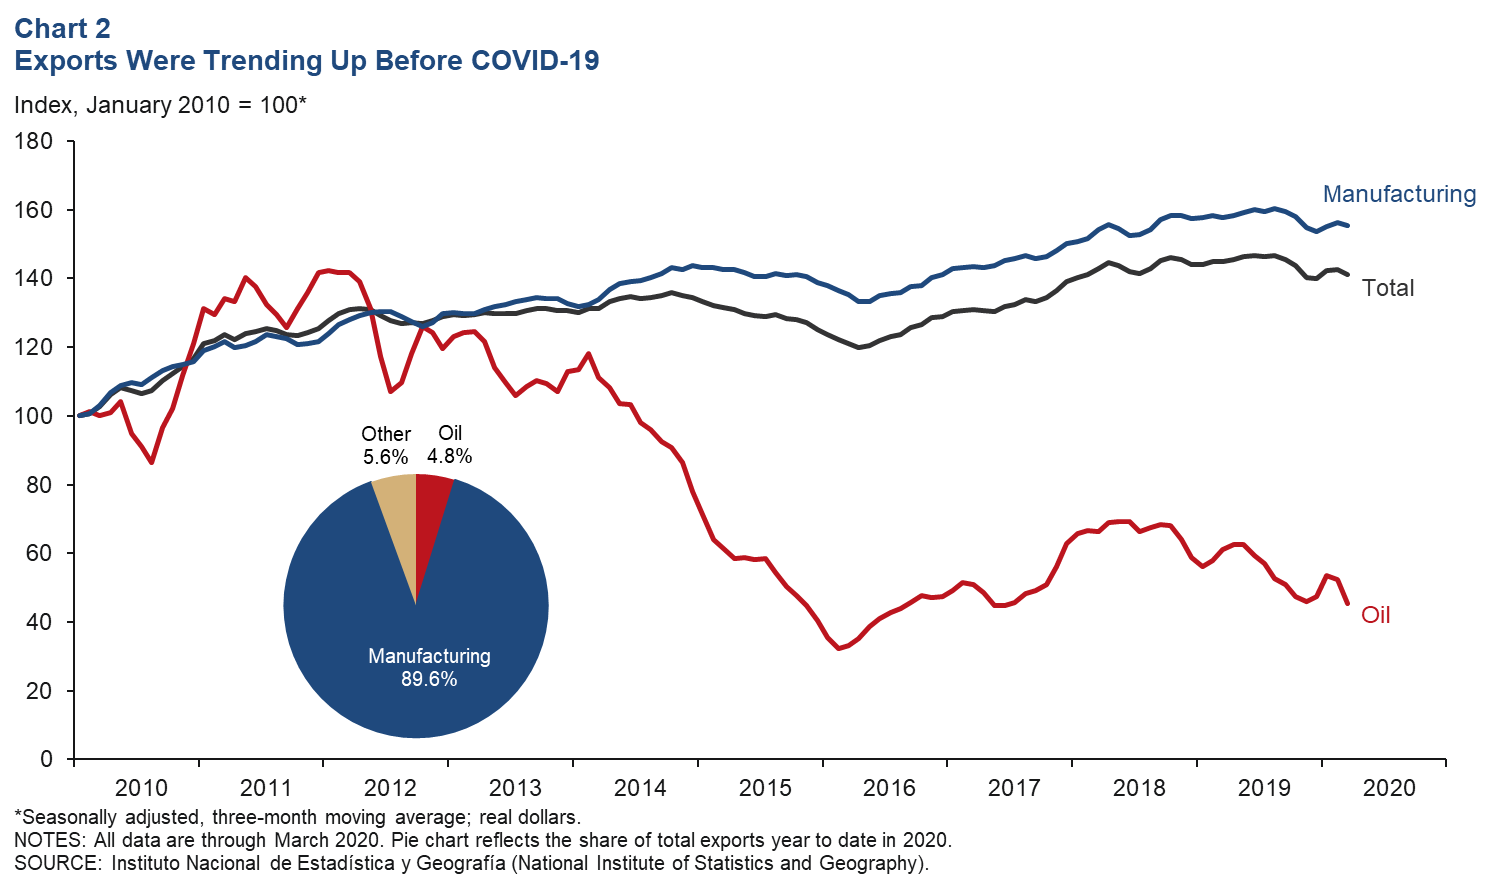
The three-month moving average of total exports dipped 1.1 percent in March, as oil exports fell 13.2 percent, and manufacturing exports contracted 0.6 percent (Chart 2). On a month-over-month basis, total exports fell 3.5 percent in March, and manufacturing exports declined 3.4 percent. First-quarter exports fell 2.6 percent compared with the same period in 2019, as manufacturing exports declined 1.6 percent and oil exports were down 25.6 percent.
Industrial Production Falls
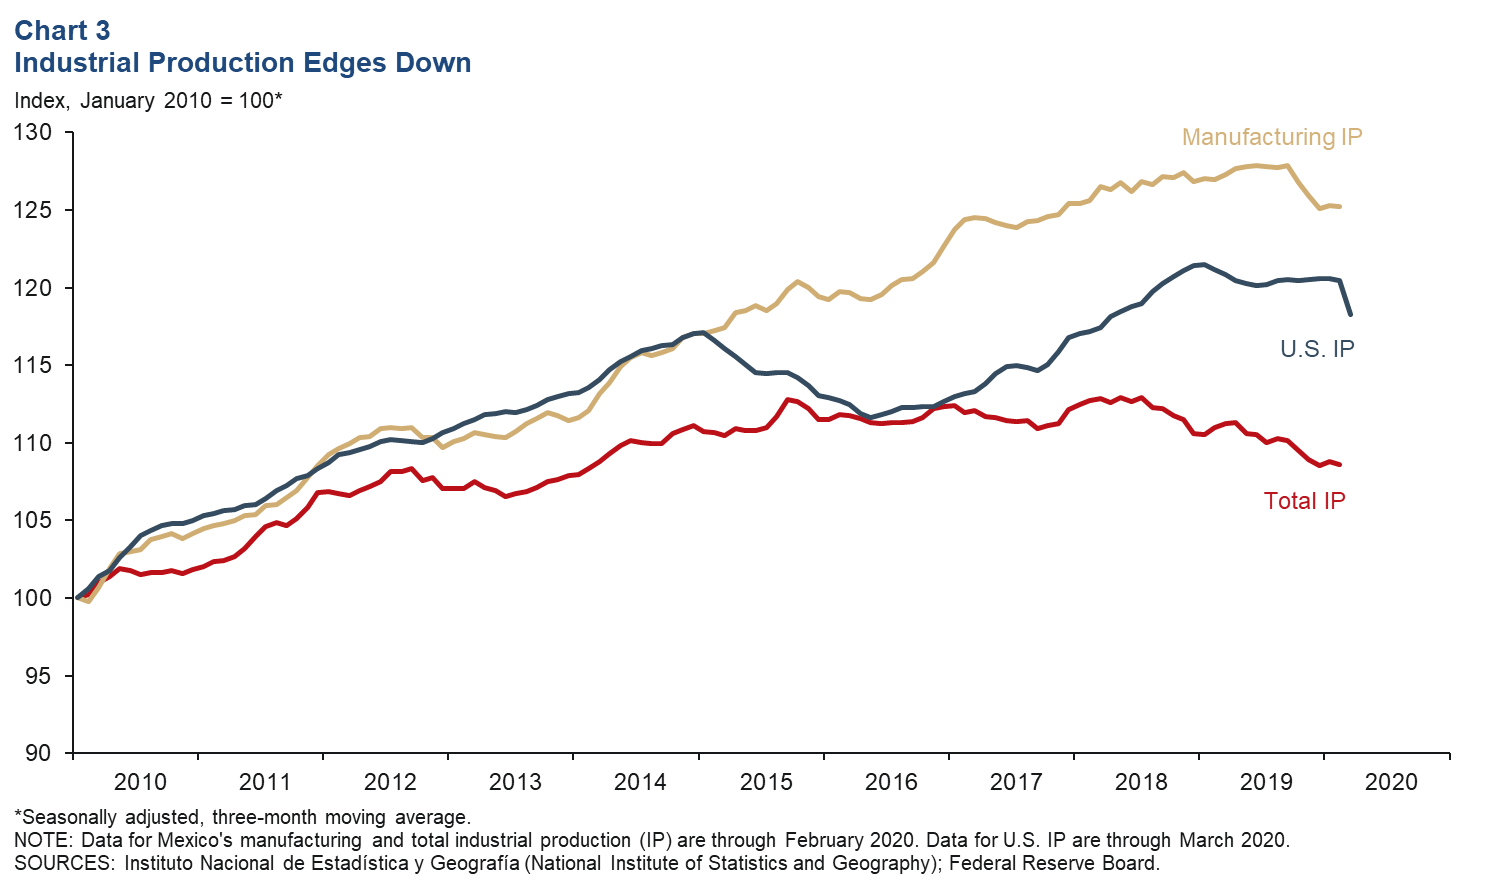
Mexico’s industrial production (IP) three-month moving average (December–February) index—which includes manufacturing, construction, oil and gas extraction, and utilities—fell 0.2 percent, and manufacturing was relatively flat (Chart 3). On a month-over-month basis, IP decreased 0.6 percent in February, and the manufacturing index fell 0.7 percent. North of the border, U.S. IP decreased 5.4 percent in March after rising 0.5 percent in February. Mexico’s manufacturing sector most likely followed suit in March. The correlation between IP in Mexico and the U.S. increased considerably with the rise of intra-industry trade after the implementation of the 1994 North American Free Trade Agreement.
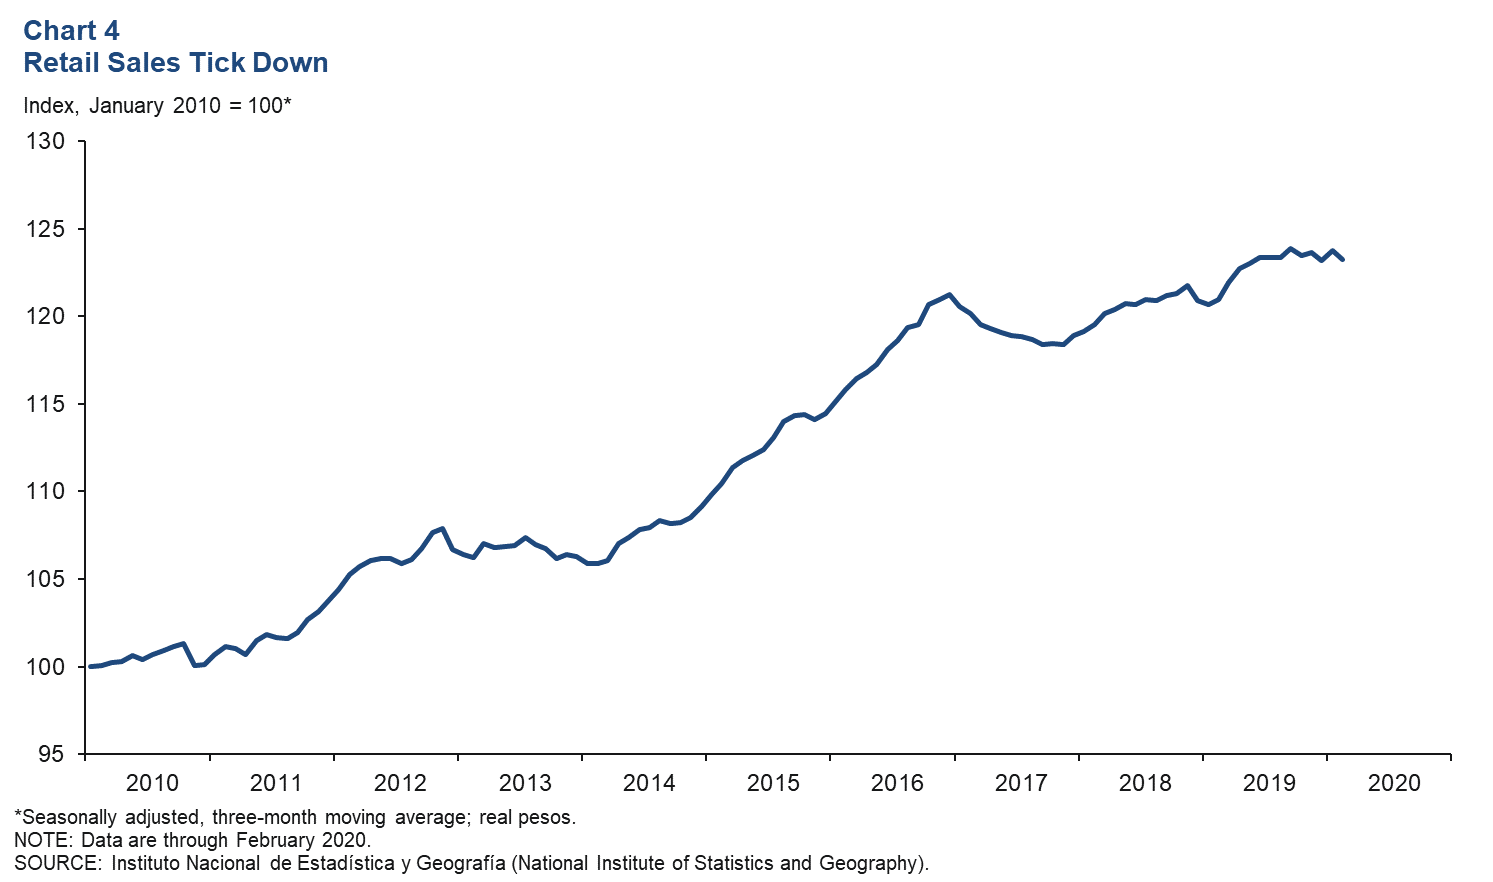
Retail Sales Decline
The real retail sales three-month moving average (December–February) index decreased 0.4 percent (Chart 4). On a month-over-month basis, retail sales fell 1.1 percent in February. Since December 2019, the retail sales index has fallen 0.7 percent.
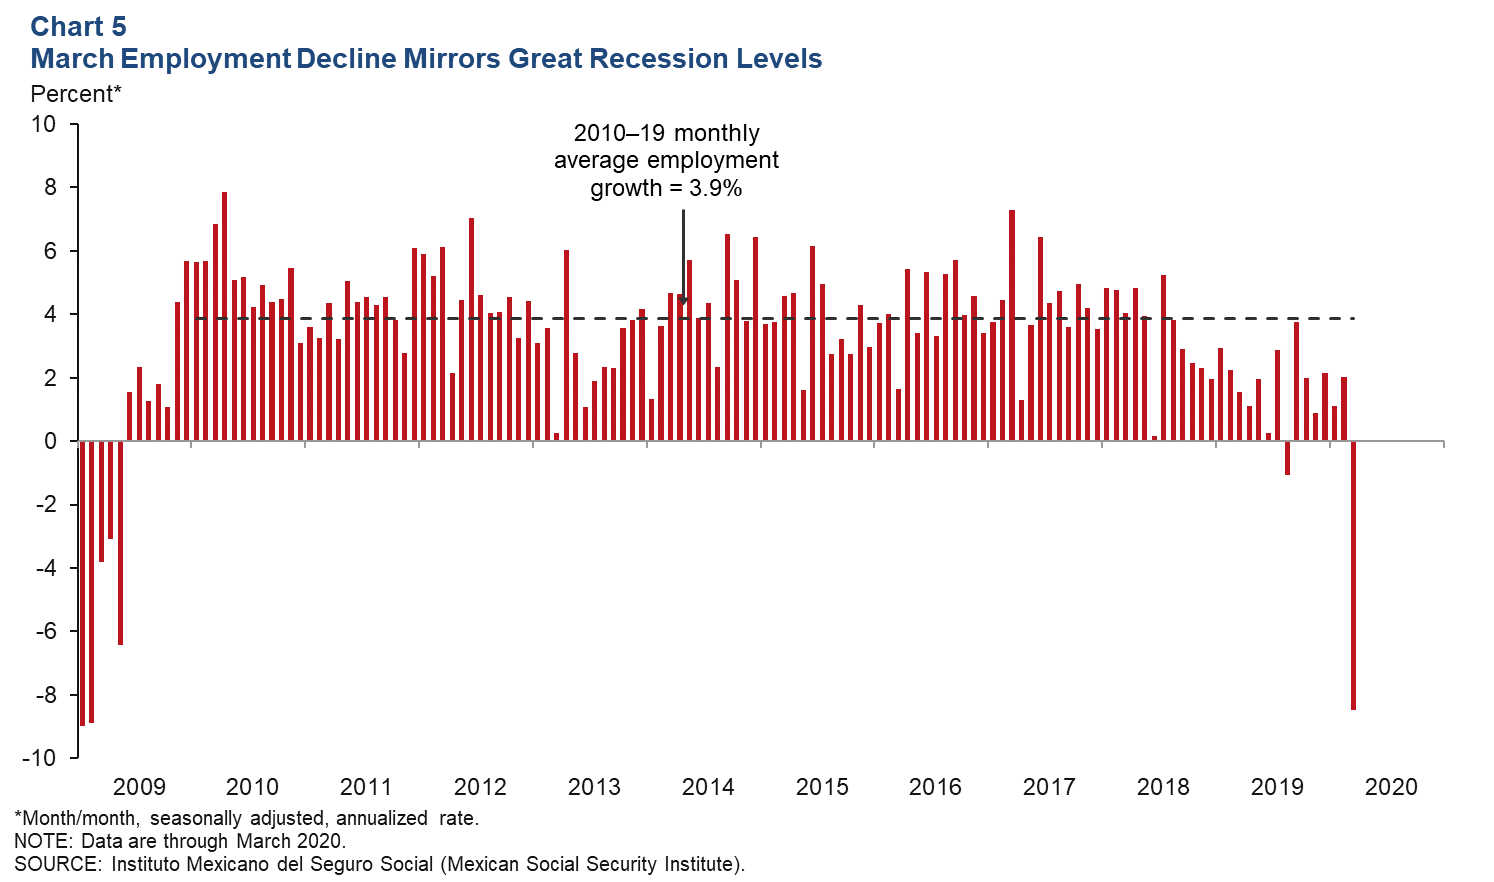
Employment Contracts Sharply in March
Formal sector employment—jobs with government benefits and pensions—fell an annualized 8.5 percent in March, its sharpest decline since February 2009 (Chart 5). Year-over-year employment grew 0.7 percent, the slowest annual growth since the end of the Great Recession. Meanwhile, total employment, representing 55 million workers and including informal sector jobs, grew 2.7 percent year over year in fourth quarter 2019, above its 10-year average of 1.9 percent. The unemployment rate in March was 3.3 percent, down from 3.6 percent a year earlier.
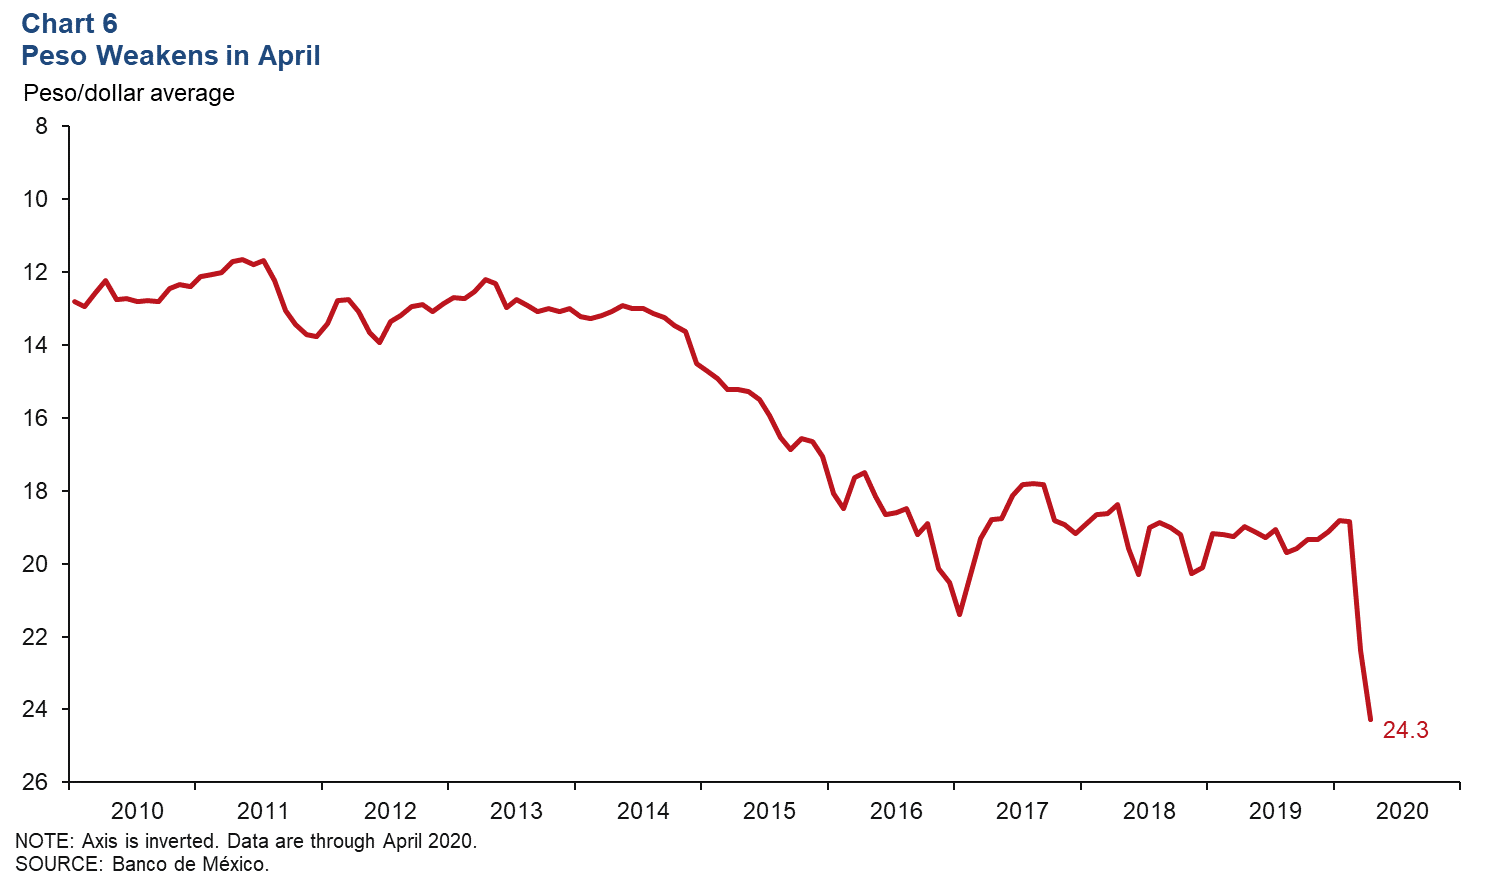
Peso Loses Ground Against the Dollar in April
The Mexican currency averaged 24.3 pesos per dollar in April (Chart 6). The peso has depreciated 24 percent against the dollar since February 2020. The Mexican peso has been under pressure due to increased uncertainty regarding how COVID-19 will affect domestic and global growth.
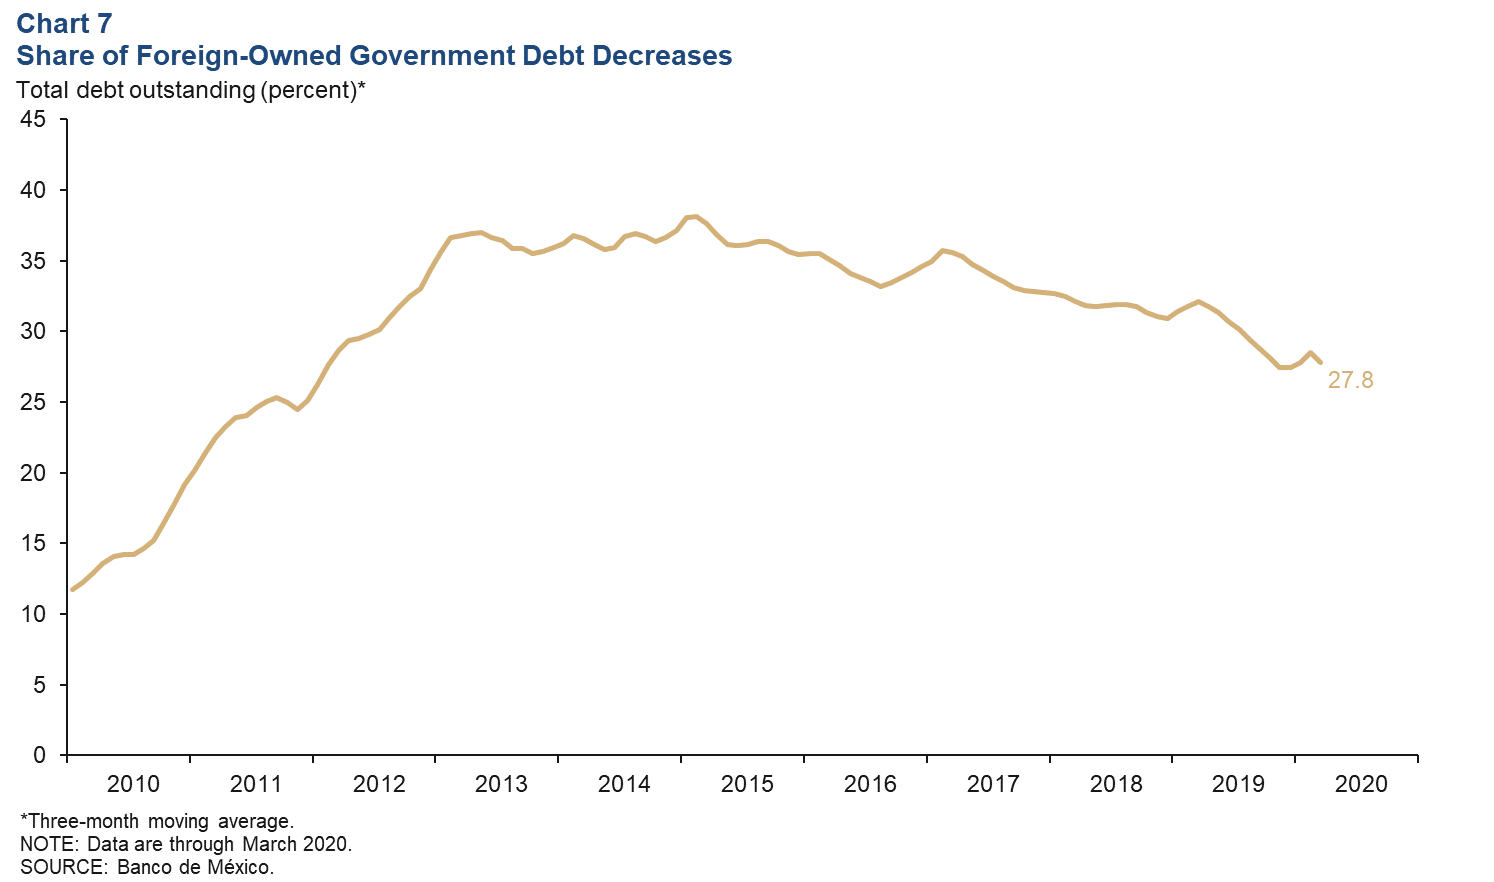
Foreign-Owned Government Debt Share Inches Down
The share of peso‐denominated Mexican government debt held abroad fell to 26.1 percent in March. The three-month moving average ticked down to 27.8 percent (Chart 7). The extent of nonresident holdings of government debt is an indicator of Mexico’s exposure to international investors and is also a sign of confidence in the Mexican economy.
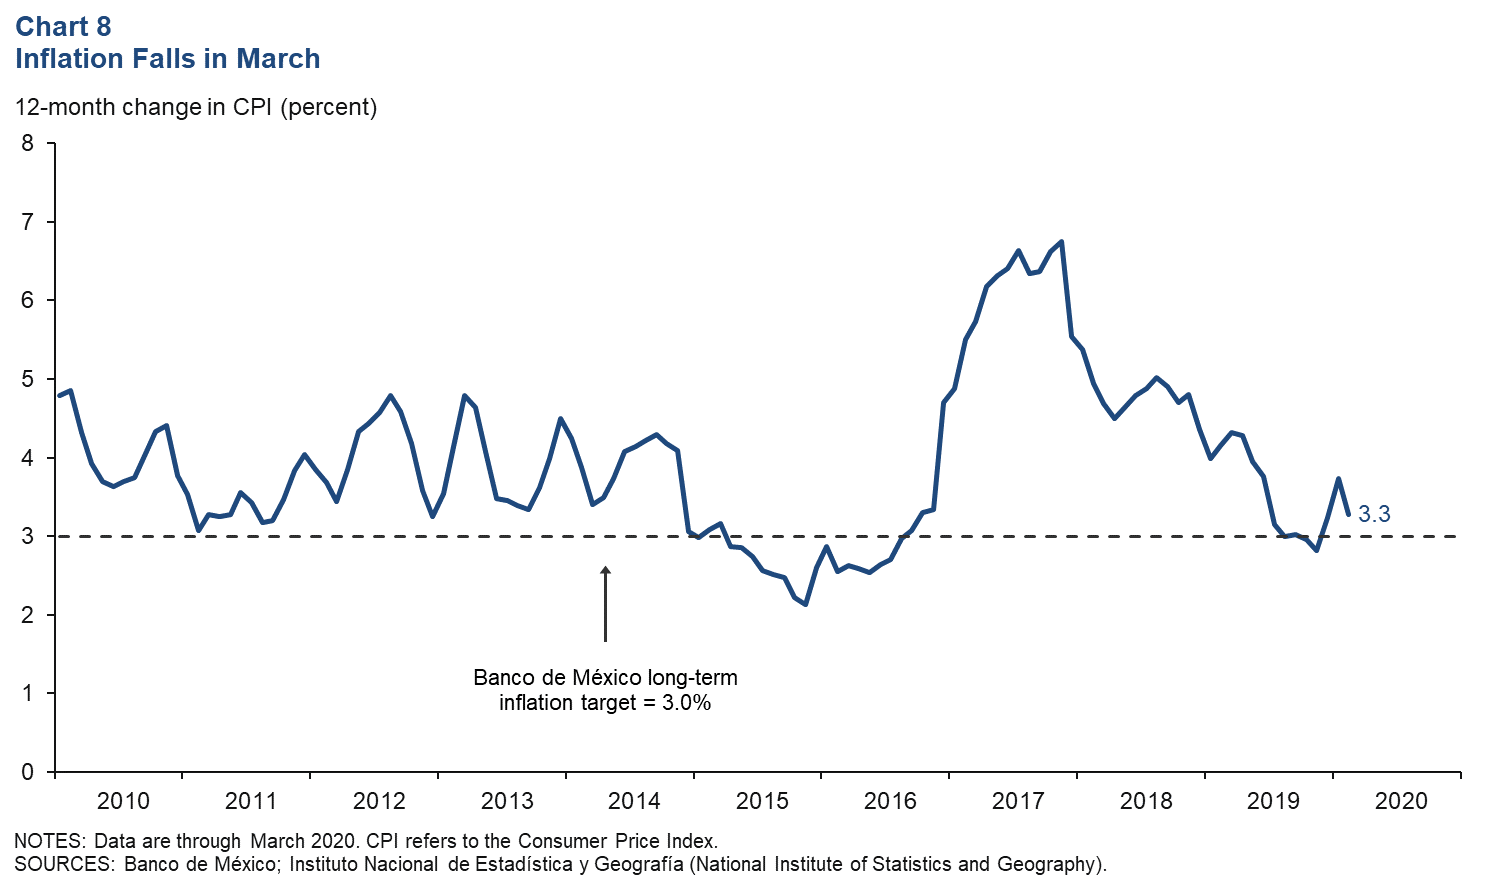
Inflation Drops
Mexico’s consumer price index (CPI) increased 3.3 percent in March over the prior 12 months, down from 3.7 percent in February (Chart 8). CPI core inflation (excluding food and energy) rose 3.6 percent over the previous 12 months in March. Banco de México reduced the benchmark rate by 50 basis points to a three-year low of 6 percent at an unscheduled meeting on April 21. Officials had already surprised markets with a half-percentage point cut on March 20. They also announced plans to boost liquidity to stabilize financial markets and facilitate bank lending to small and medium-sized businesses in addition to dollar auctions to support the peso. In making its rate cut, Mexico’s central bank cited the financial market volatility stemming from uncertainty regarding the impact of COVID-19 on world economic activity, and the recent fall in international oil prices.
Notes
- Encuesta sobre las Expectativas de los Especialistas en Economía del Sector Privado: Abril de 2020, (communiqué on economic expectations, Banco de México, April 2020). The survey period was April 23–29.
- Annualized growth by sector may not add up due to preliminary numbers and seasonal adjustments by source.
About the Authors
Cañas is a senior business economist, and Smith is a research assistant in the Research Department at the Federal Reserve Bank of Dallas.