
Pandemic pushed the U.S. into recession … and hourly wages rose?
It’s commonly understood that “tight” labor markets—low unemployment rates—are associated with faster wage growth, while “slack” labor markets—high unemployment rates—are associated with slower wage growth.
The onset of COVID-19 in spring 2020 prompted an unprecedented rapid rise in the unemployment rate. However, a popular and widely cited wage measure—average hourly earnings (AHE)—rose sharply as the health crisis grew. We show that the anomalous behavior of AHE growth was largely due to a dramatic change in the composition of the workforce produced by the economic fallout from the pandemic.
COVID-19 hit the U.S. last March, and by the end of April, more than 22 million jobs were lost. This created tremendous slack in the labor market, with the unemployment rate leaping from 4.4 percent to 14.8 percent. A natural assumption would be that such an unprecedented rise in unemployment would result in a marked slowing of wage growth.
In the case of AHE, however, wage growth accelerated as the unemployment rate shot up.
Calculating average hourly earnings
AHE is based on data from a large survey of establishments that the Bureau of Labor Statistics (BLS) reports monthly. It is calculated as aggregate payroll expenses divided by aggregate hours. Payroll expenses include overtime pay and bonuses, if paid regularly. The data cover nonsupervisory workers in the private nonagricultural sector.
Notably, AHE covers workers in industries particularly hard hit by the pandemic, such as leisure and hospitality and personal services.
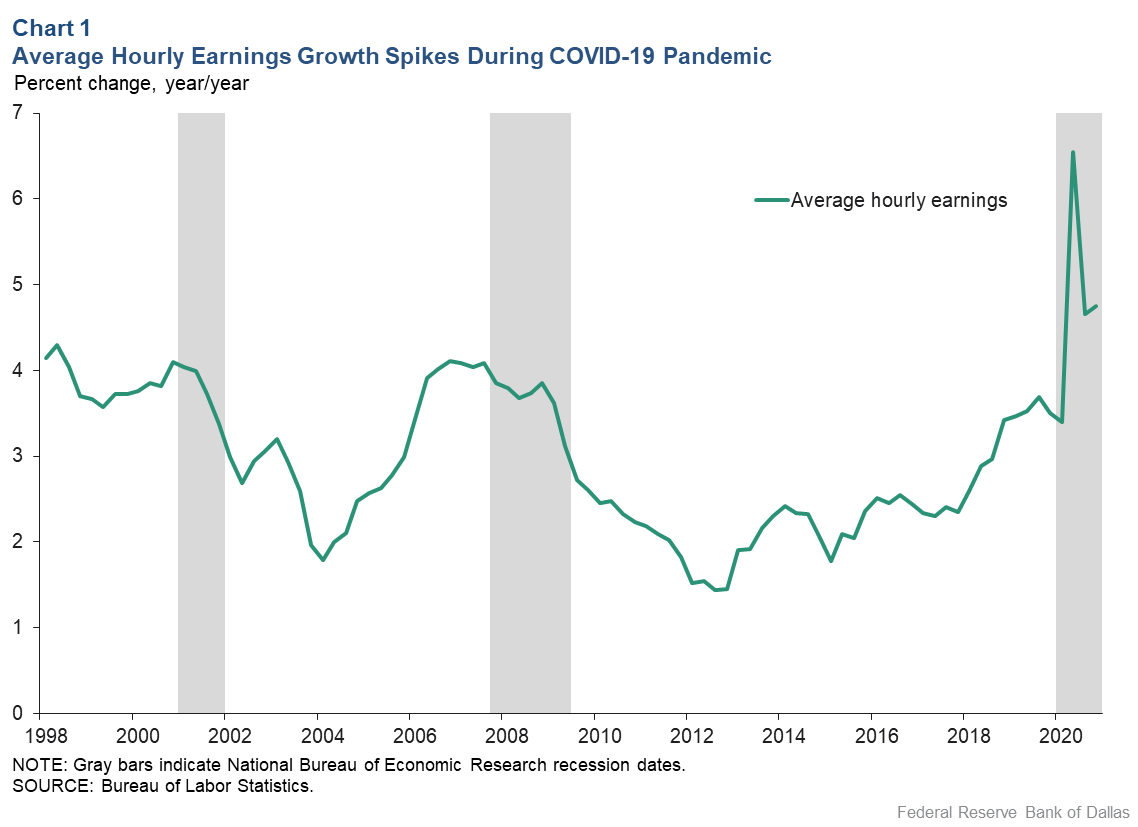
Over a nearly 25-year period through 2020, AHE growth typically varied between 2 and 4 percent (Chart 1). Looking at the two prior recessions, AHE growth slowed with the onset of each downturn and continued lower for several years after the end of the recession.
By comparison, AHE growth increased an unprecedented 3 percentage points from fourth quarter 2019 to second quarter 2020, when the COVID-19 recession began.
‘Composition effect’ reflects who remained at work
This rapid rise is due to what economists call a “composition effect,” reflecting a change in who was working during the COVID-19 health crisis.
To illustrate what we mean by a composition effect, consider the simple example of three individuals: Sally, Frank and Bob (Table 1).
Table 1: Example of Composition Effect on Average Hourly Earnings
| Dollars per hour; average hourly earnings (AHE) based on 40-hour workweek | |||||
|---|---|---|---|---|---|
| Year | Sally | Frank | Bob | AHE | AHE growth |
| 2018 | $20.00 | $18.00 | $10.00 | $1,920.00/120 = $16.00 | |
| 2019 | $20.60 | $18.72 | $10.50 | $1,992.80/120 = $16.61 | 3.79% |
| 2020 | $20.60 | $18.72 | — | $1,572.80/80 = $19.66 | 18.36% |
We assume their jobs require them to work 40 hours per week. In 2018, Sally’s weekly earnings are $800, Frank’s are $720 and Bob’s are $400. Consequently, their aggregate weekly earnings are $1,920 and their aggregate weekly hours are 120, producing an AHE of $16.00 for the year.
In 2019, Sally receives a 3 percent wage increase, Frank a 4 percent increase and Bob a 5 percent increase. Repeating the calculations for 2019 and incorporating the wage increases produces an AHE of $16.61 and, consequently, AHE growth of 3.79 percent.
We now consider the information for 2020. Due to the pandemic, Sally and Frank do not receive a wage increase. Bob is in a job that he cannot perform from home and becomes unemployed.
Let’s calculate the 2020 AHE and the resulting AHE growth between 2019 and 2020. Because Bob is paid less than the group’s AHE in 2019, when he loses his job and is removed from the calculation, the AHE in 2020 increases from $16.61 to $19.66. Consequently, AHE growth rises from 3.79 percent to 18.36 percent—even though Sally and Frank received no wage increase. This change in AHE growth due to Bob leaving work is an example of composition effect.
A composition change of this nature occurred during the pandemic because layoffs were particularly prevalent in high-contact, low-pay service businesses.
Creating a proxy measure for AHE wage growth in 2020
We would need wage and employment data on individual workers from the establishments surveyed by the BLS to know if a composition effect explains the spike in AHE growth. Unfortunately, the establishment data used to produce the AHE is limited to earnings and hours at the aggregate level.
Alternatively, the BLS Current Population Survey (CPS) provides individual-level information on wages and employment for around 50,000 people per month. We can match individuals across a 12-month span as long as they do not move residences.
For the sample of nonmovers, we can measure their wage and employment status at both ends of the 12-month period. This allows us to calculate the individual wage growth for people who work in both periods (Sally and Frank in our example), and the wage and employment status for individuals who enter or exit work over the time period (Bob in our example).
We can use the CPS to calculate a CPS-based version of AHE by calculating the aggregate earnings and hours from the data. Because the CPS survey is smaller than the establishment survey, we would expect the CPS AHE growth to be more variable than the official AHE growth (Chart 2).
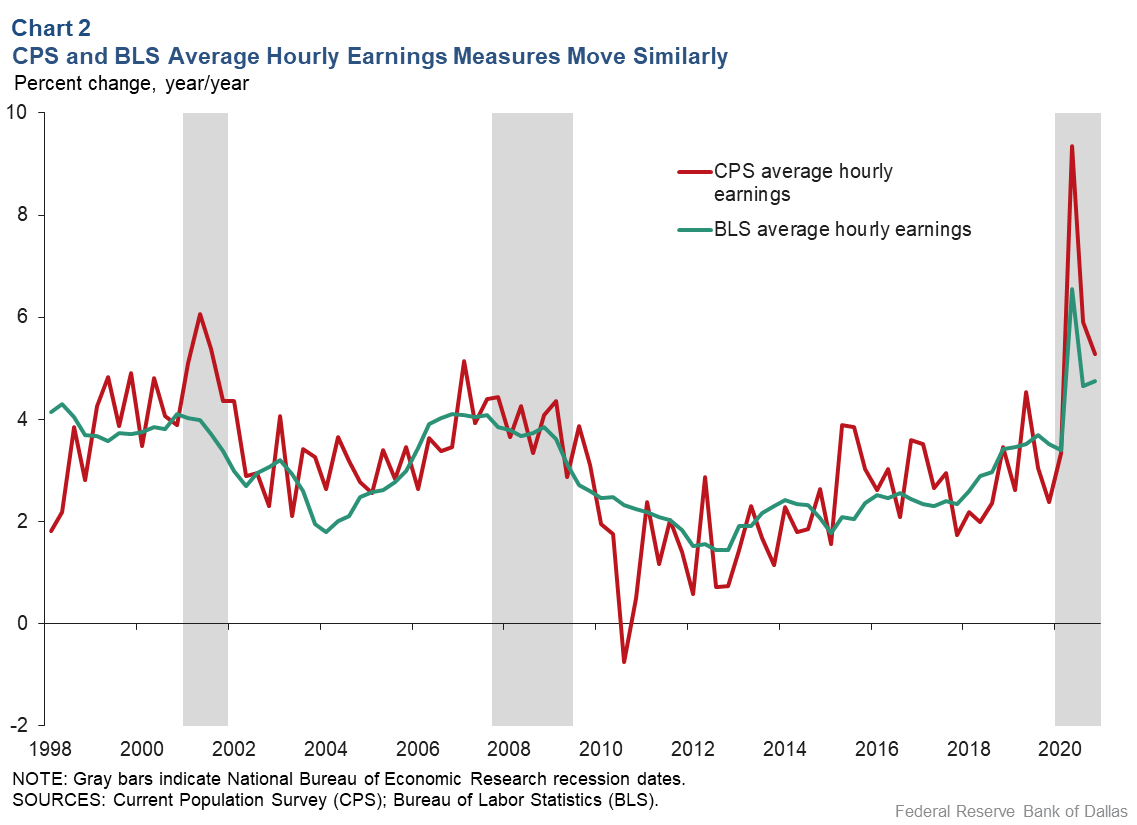
The CPS AHE growth closely tracks the BLS AHE growth—with a 73 percent correlation—over our nearly 25-year period. Importantly, CPS AHE growth shows the same sharp increase in early 2020.
Does our simple example of low-wage workers losing employment in response to the COVID-19 crisis agree with the CPS data?
To check this, we compare the distribution of wages in the first half of 2019 for individuals in the CPS who report being unemployed a year later (like Bob) and the distribution of wages for individuals in the CPS who report they are still working a year later (like Sally and Frank) (Chart 3).
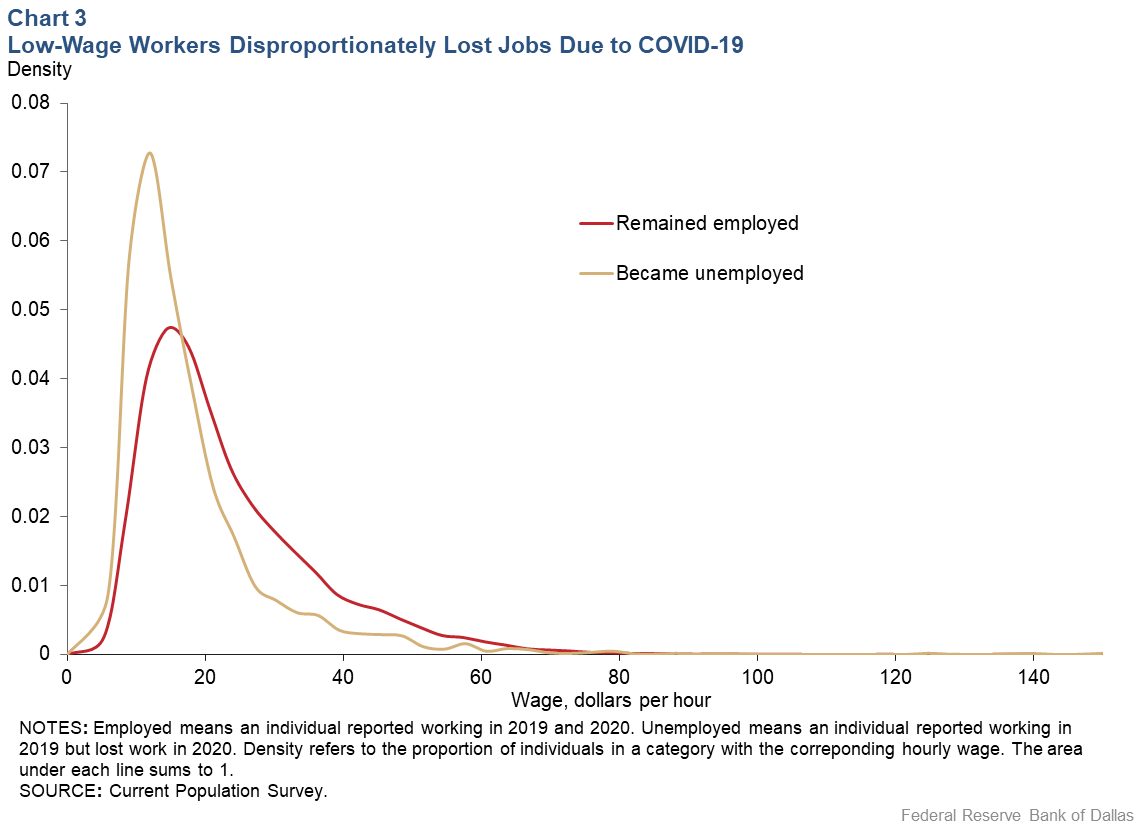
The mean 2019 wage for individuals not working in 2020 is $18.18. In contrast, the mean 2019 wage for individuals still working in 2020 is $23.46. That is, individuals who lost their jobs due to the health crisis earned wages that were on average lower by $5.28, or 23 percent. This aligns with our simple three-person example.
We can use the individual CPS data on wages and employment to decompose the CPS AHE growth into the contribution of wage growth from individuals who work in both periods (what we call the “aggregation effect”) and the contribution from wage-level differences for individuals who exit or enter work over the 12-month span (the composition effect). In each period, the sum of the aggregation term and the composition term equals the overall CPS AHE growth (Chart 4).
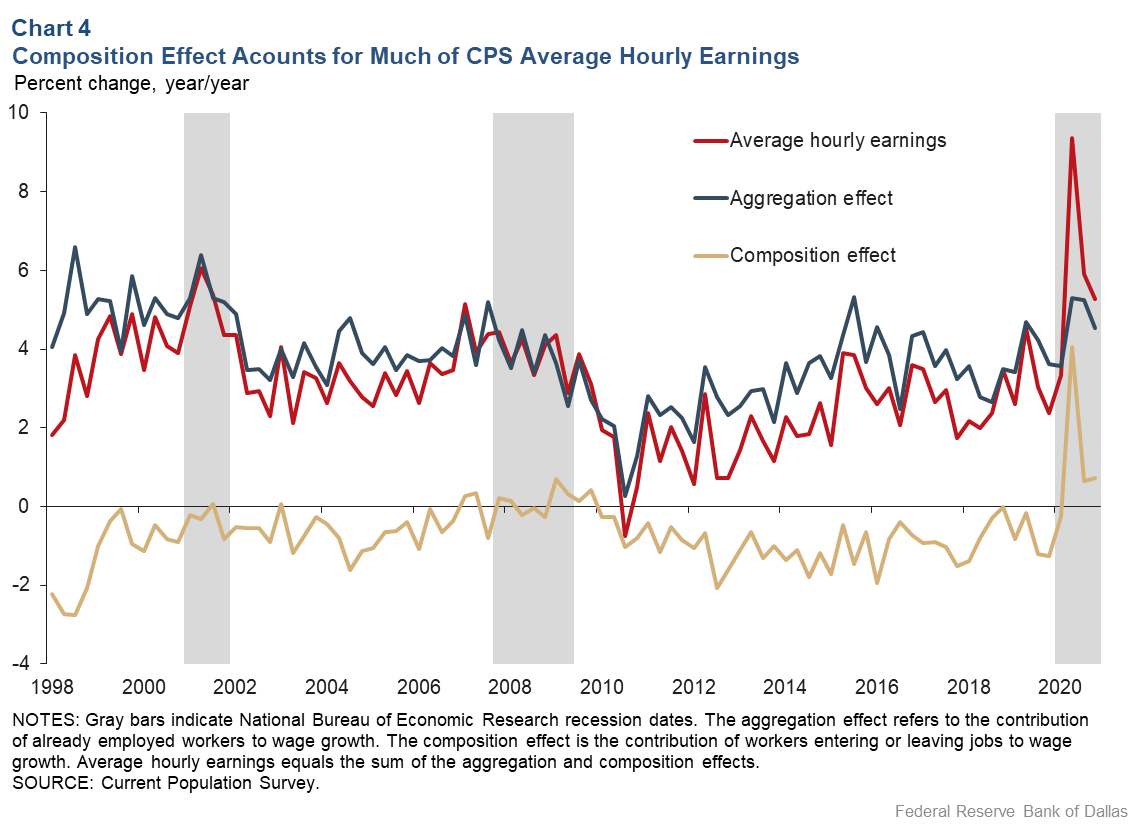
The spike in our CPS AHE growth from fourth quarter 2019 to second quarter 2020 was 7 percentage points (larger than the 3 percentage points for the official AHE growth). The composition term contributed 5.3 percentage points, or three-quarters of the total change.
An anomaly of the pandemic downturn
Note that this large, positive growth in the composition term is unprecedented over the more than two-decade period studied. In fact, the composition term typically is negative, averaging −0.77 percent over the period prior to the COVID-19 health crisis. This reflects that individuals entering work often do so at relatively low wages (as would be the case in our example if Bob were rehired) and that individuals retiring (as opposed to becoming unemployed) often do so at relatively high wages.
Composition effects generally lower AHE growth below what would be indicated by looking only at data on individual wage growth.
An implication is that composition effects will likely make AHE growth appear sluggish this year due to displaced low-wage workers regaining employment as the economy recovers from the pandemic crisis.
About the Authors

Sean Howard
Howard is a research analyst in the Research Department at the Federal Reserve Bank of Dallas.

Robert Rich
Rich is a senior economic and policy advisor in the Research Department at the Federal Reserve Bank of Cleveland.

Joseph Tracy
Tracy is executive vice president and senior advisor in the Research Department at the Federal Reserve Bank of Dallas.
The views expressed are those of the authors and should not be attributed to the Federal Reserve Bank of Dallas or the Federal Reserve System.