Transfer payments, household savings play key roles in growing U.S. deficit
The U.S. government has incurred substantial budget deficits in recent years. Transfer payments and subsidies paid to U.S. residents make up an increasingly large share of the government budget.
Thus, while recent levels of government borrowing have been high, particularly during recent crises, private savings by U.S. residents have been elevated as well. As a result, overall borrowing for the entire U.S economy has been remarkably stable.
Understanding U.S. government expenditures
The U.S. general government budget deficit , the combined federal, state and local deficits, amounts to 7 percent of GDP (a way of measuring outlays relative to output over time). The level substantially exceeds what it was for most of the country’s history before the 2008–09 Global Financial Crisis. Knowing what goes into the government’s expenses helps explain how the government has sustained higher levels of debt in recent years.
Current expenditures fall into three broad categories: government consumption, transfers and subsidies (which we subsequently refer to as simply “transfers”), and interest payments on the debt.
From 1970 to 2024, government current expenditures rose from around 30 percent of gross domestic product (GDP) to 34 percent of GDP, while government revenue remained fairly constant at 27 percent of GDP.
U.S. residents have received the bulk of outlays in recent years, largely via interest payments and government transfers (Chart 1).
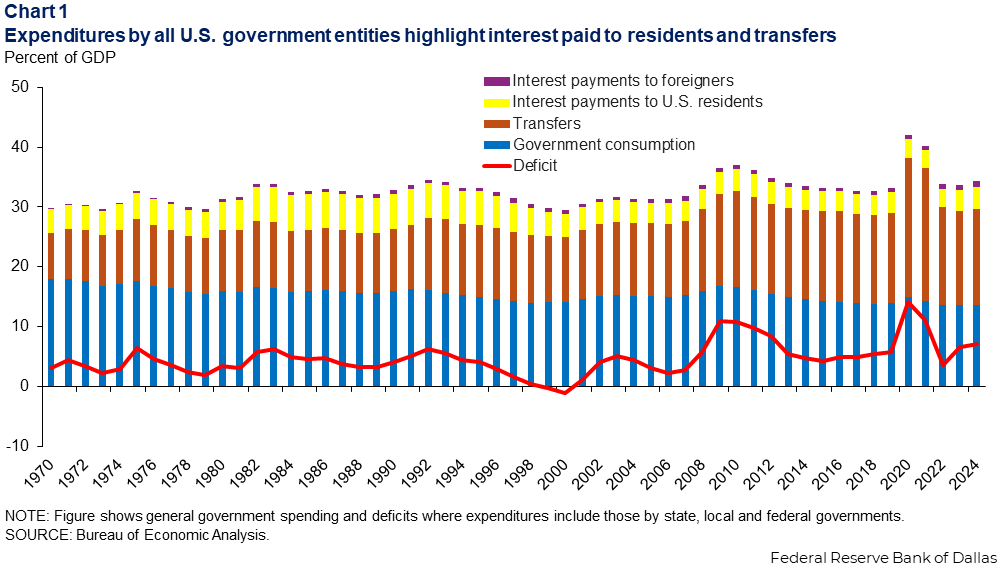
Interest payments equal nearly 5 percent of GDP. About 80 percent of these interest payments are to U.S. residents. Interest payments exceeded $1 trillion during the past two years—$1.4 trillion in 2024 alone, with more than $1.1 trillion to domestic residents and around $300 billion to foreigners.
Government consumption fell from 18 percent of GDP to 14 percent from 1970 to 2024. Transfers increased from 8 percent to 16 percent of GDP during the period.
Budget deficit rises during recent crises
The government budget deficit exceeded 10 percent of GDP twice in recent history. During the financial crisis it reached 11 percent of GDP in 2009, and during the pandemic crisis it reached 14 percent of GDP in 2020. Apart from those episodes, the last time the government budget deficit exceeded 10 percent was during World War II in 1945.
Year-to-year budget deficit movements are the sum of increases in transfers, interest payments, government consumption and decreases in revenue. Chart 2 shows the increase in the budget deficit after the 2008 crisis arose from a combination of decreased revenue, increased government consumption and increased transfers.
More specifically, between 2007 and 2009, the government budget deficit rose by 8 percentage points of GDP because of a 3 percentage-point increase in transfers, a 1.5 percentage-point increase in government consumption and a 3.5 percentage-point decrease in revenue. Thus, transfers made up a significant proportion of the government budget deficit rise.
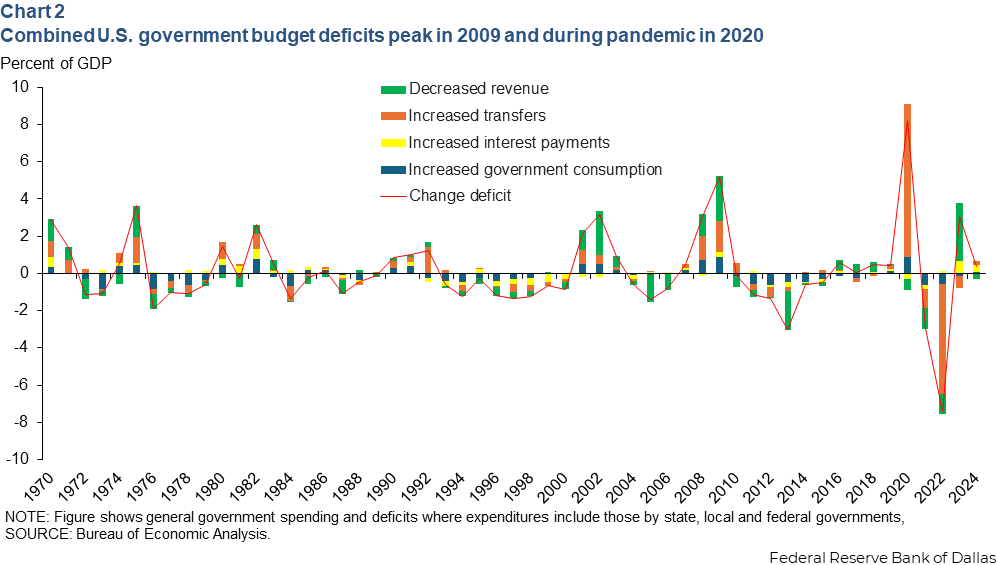
During the pandemic, the deficit expansion was even more skewed toward increased transfers. The deficit in 2020 again rose by 8 percentage points of GDP. Transfers rose by 8 percentage points of GDP, government consumption rose by 1 percentage point of GDP, interest payments fell by 0.4 percentage points of GDP, and revenue rose by 0.6 percentage points of GDP.
The same pattern holds internationally across developed countries making up the Organization for Economic Cooperation and Development. Transfers, rather than greater government consumption, drove budget deficits higher after the 2008 crisis and especially during 2020 (Chart 3).
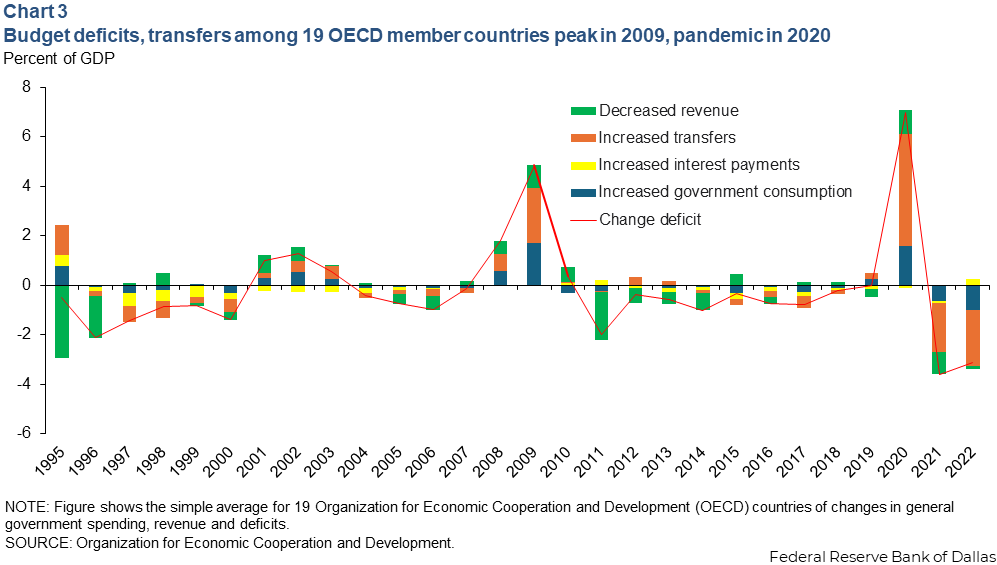
The average deficit rose by 7 percentage points of GDP from 2007 to 2009 due to a 3 percentage-point increase in transfer payments, a 1.5 percentage-point decrease in revenue and a 2.5 percentage-point increase in government consumption.
In 2020, the average deficit again rose by 7 percentage points of GDP, attributable to a 4.5 percentage-point increase in transfers, a 1 percentage-point revenue decline and a 1.5 percentage-point increase in government consumption.
In response to both the Global Financial and pandemic crises, government transfers increased around the world as leaders attempted to alleviate economic strain. Both times it was a leading cause of higher budget deficits.
Increased government deficits produce higher private sector savings
Beyond government borrowing by itself, government net savings is one part of overall net national savings (Chart 4). The sum of net savings across federal, state and local governments, U.S. households and businesses equals the U.S. current account—net savings for the economy as a whole.
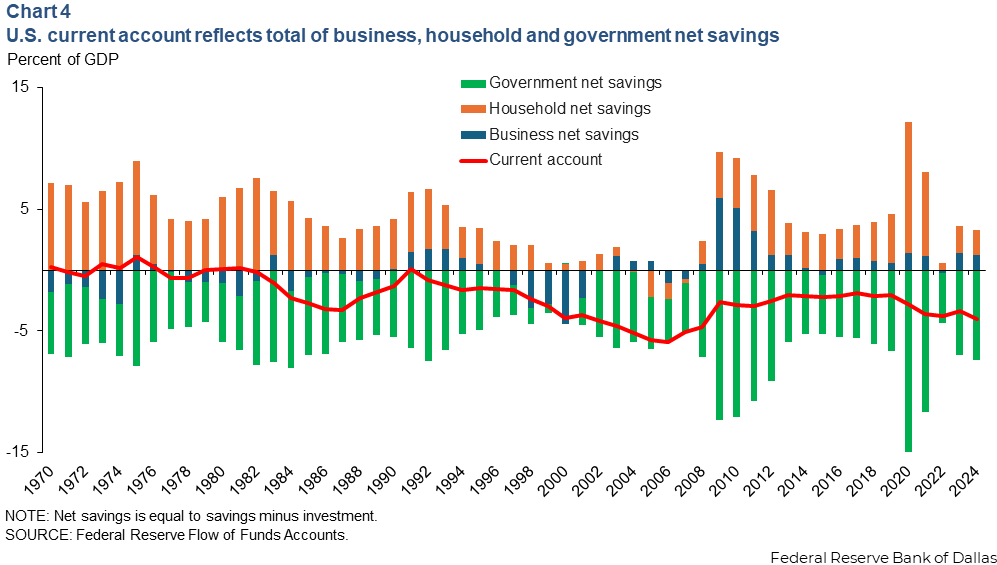
Strictly speaking, the government budget deficit (the difference between current revenue and current expenditures) is not simply the negative of net government savings. Net government savings is equal to the budget surplus minus net government investment.
However, for practical purposes, net government investment has averaged about 1 percent of GDP since 2000, although it is cyclical and tends to rise during recessions. Net government investment rose to 1.4 percentage points of GDP following the 2008 recession.
Chart 4 plots U.S. government net savings, household savings and business savings, as well as their sum, the current account.Government and private sector net savings are very negatively correlated. This was especially true during the 2008 and 2020 crises.
Between 2007 and 2009, the U.S. current account increased by 2 percentage points of GDP, from -5 percent to -3 percent of GDP. During this period, government net savings fell by 9 percentage points of GDP, but household and business savings rose by 11 percentage points of GDP over the same timeframe. Thus, household and business savings more than offset the increase in government borrowing.
Similarly in 2020, the U.S. current account only fell by 0.6 percentage points of GDP, despite a decrease in government net savings of 8 percentage points of GDP. Increased savings by U.S. households largely offset the increased government borrowing. This offset allowed total national savings to remain fairly stable despite surging government borrowing.
Who holds U.S. government debt?
The value of outstanding Treasuries fluctuated between 20 and 40 percent of GDP from 1970 to 2008; it then rose to nearly 70 percent of GDP in the five years after the 2008 crisis, increasing again after the pandemic crisis (Chart 5). It is at about 93 percent of GDP currently.
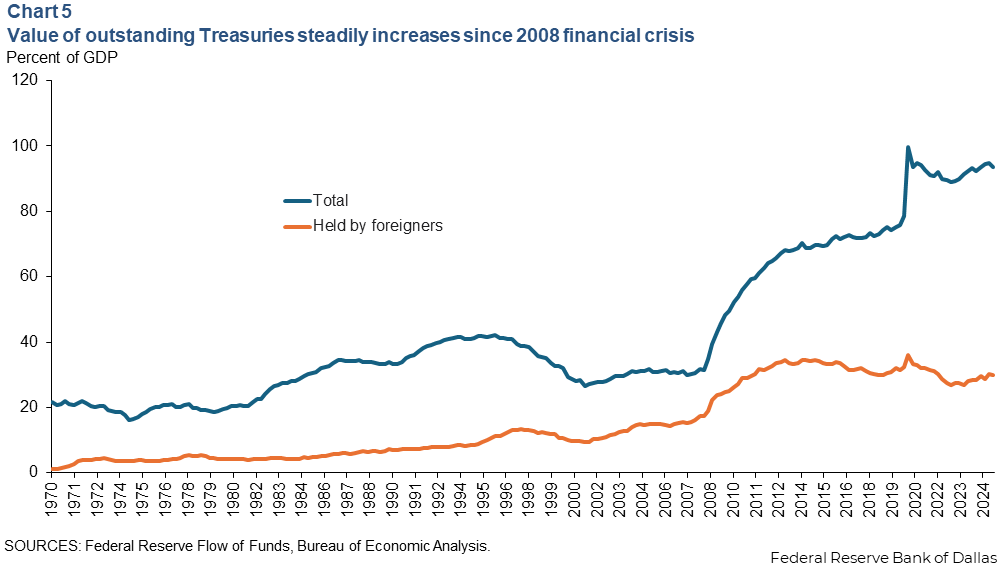
Foreigners held 34 percent of all outstanding Treasuries in 2000. The foreign share rose to 56 percent by 2008, the result of low or even negative net savings of U.S. households, businesses and the government during the early 2000s.
However, foreign Treasury holdings increased far less dramatically than the overall supply of Treasuries after the 2008 crisis, and the share of foreign-held Treasuries (as a share of GDP) has declined since 2015.
There was almost no increase in foreign-held Treasuries following the pandemic crisis, and thus, the foreign-held share of the Treasury market declined to 30 percent, the lowest since 1996. U.S. private sector savings accounted for much of the government debt issued over the last 15 to 20 years.
While government budget deficits greatly increased in recent years, especially during the 2008 and pandemic episodes, much of that increased government spending was in the form of transfers to U.S. residents.
In short, the U.S. government is borrowing a lot of money in order to give that money to its citizens. Those citizens take that money and buy government bonds. The result is a huge deficit for the government and large savings for households.
About the authors

Scott Davis is an assistant vice president in the Research Department of the Federal Reserve Bank of Dallas.

Lillian Derr is a research analyst in the Research Department at the Federal Reserve Bank of Dallas.