
How much slack is left in the labor market?
Through June 2021, the U.S. labor market—measured by civilian employment of those age 16 or older—has contracted by 7.1 million out of 158.7 million total jobs since February 2020, before COVID-19 took hold.
This would seem to indicate that considerable slack remains in the labor market. However, slack should be measured relative to the number of jobs that would exist in a “neutral” labor market—one absent all movement due to the business cycle. We show that the labor market was tight in February 2020 and, after taking this into account, it remains around 675,000 jobs short of returning to neutral.
Federal Reserve Chairman Jerome Powell announced a new operating framework for the Federal Open Market Committee (FOMC) in August 2020. Under the new framework, the Fed will base policy decisions on “shortfalls” rather than “deviations” in employment from the estimate of its maximum level. This means that the FOMC will no longer look to tighten policy once slack has been removed from the labor market unless there are signs of inflation increasing to unwelcome levels.
A standard measure of labor market slack or tightness is the unemployment gap—the difference between the unemployment rate (U) and an estimate of the natural rate of unemployment (U*) when the economy operates at its potential level of output.
Assessing the employment-to-population ratio
There are, however, alternative indicators of labor market conditions, such as the employment-to-population ratio, which measures civilian employment among individuals age 16 or older relative to the total working-age population. Compared with the unemployment rate, the employment-to-population ratio has advantages as a gauge of the state of the labor market. Most notably, the employment-to-population ratio accounts for individuals without jobs who elect to stop actively searching for employment (called “discouraged” workers) and consequently are not counted as unemployed.
As an analogue to the unemployment gap, we measure the current employment shortfall by estimating a “natural” employment-to-population ratio (E*/P) and compare this to the actual employment-to-population ratio (E/P).
Similar to the natural rate of unemployment, the natural employment-to-population ratio (E*/P) is the aggregate employment rate that would prevail if the economy were operating at its potential level of output. Slack exists in the labor market when E/P is below E*/P. Given the population of individuals 16 years or older, the employment shortfall is given by the difference between E* and E.
To estimate E*/P, we use Current Population Survey data on more than 57 million individuals age 16 or older from 1976 to present. We divide these individuals into one of 360 different cohorts defined by their decade of birth, sex, race/ethnicity and completed education.
Removing cyclical, seasonal effects
For each cohort, we estimate the life-cycle employment-rate profile in a way that removes cyclical and seasonal effects. This allows us to capture how changing demographics in the U.S. population affect the value of E*/P over time.
To illustrate the role of aging and education on E*/P, Chart 1 first shows five examples of estimated life-cycle employment-rate profiles—in this case for white males born in the 1950s by their level of education.
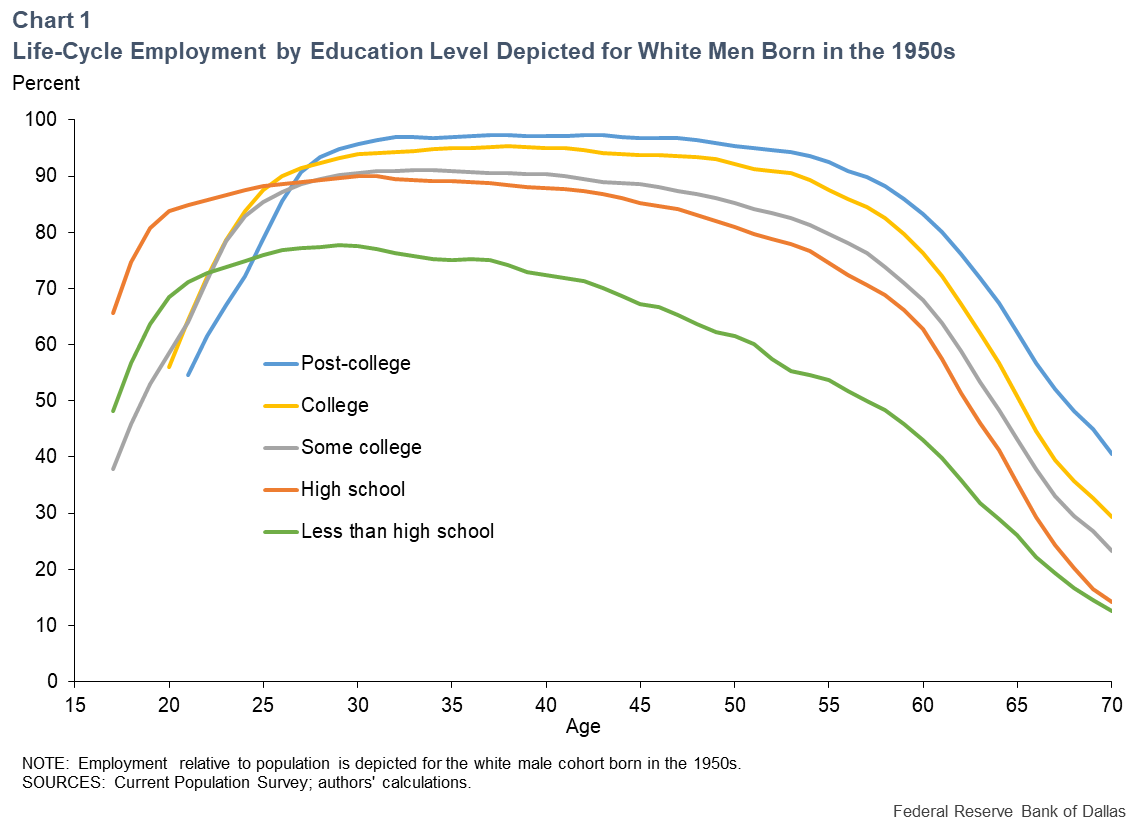
These life-cycle profiles have an inverted U-shape indicating that employment rates typically rise early in an individual’s career, flatten out over mid-career and decline late in the career, with the pace accelerating for individuals in their 60s.
As the population ages, employment rates decline, exerting downward pressure on E*/P. Note also that individuals with higher levels of education tend to have higher employment rates.
Estimated life-cycle employment-rate profiles for white women with a college education by birth decade provide another view (Chart 2).
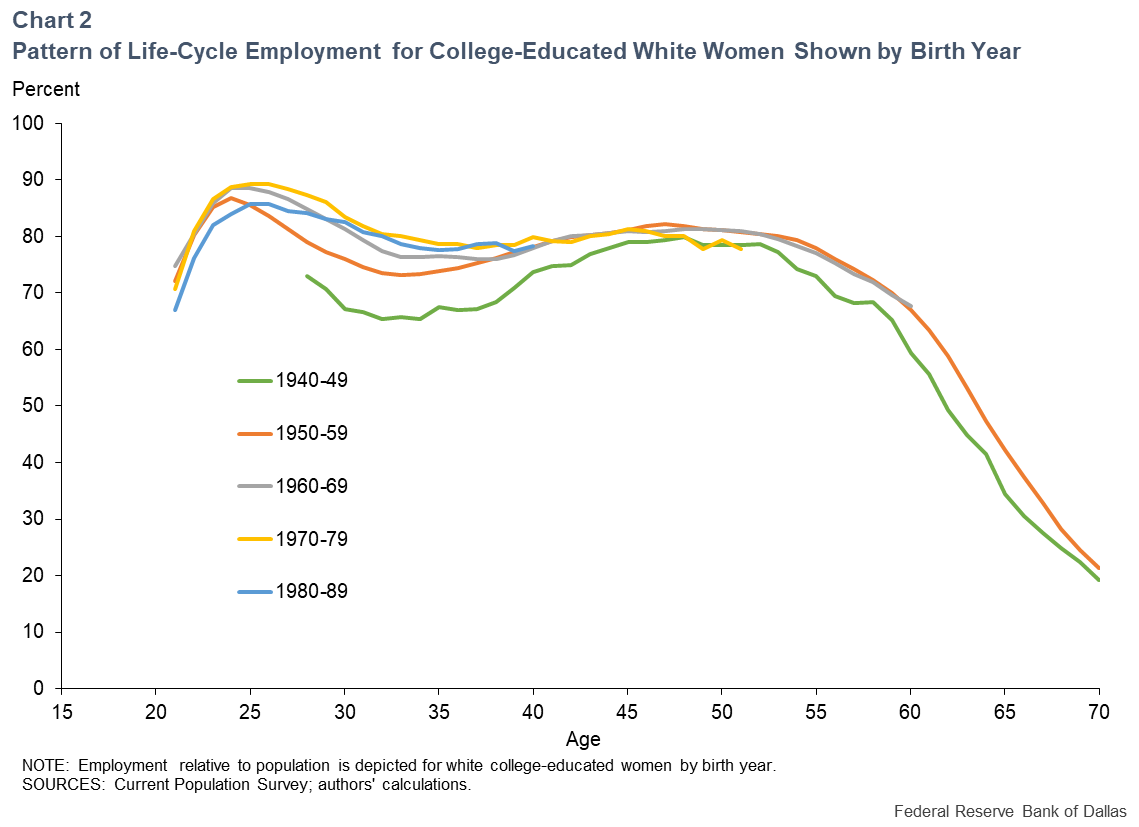
In contrast to men, the employment rates for women tend to decline between age 25 and 35 as some women take time off to start families. Employment rates recover from age 35 to 45 and decline as women reach age 55 or older.
The transition of more women into the workplace is shown by an upward shift in these life-cycle profiles across decades. The more recent cohorts have life-cycle profiles that have converged, which suggests the upward pressure on E*/P from women entering the workforce has largely ended.
Pulling it all together
To construct our natural employment-to-population ratio, we use these 360 estimated cohort life-cycle employment-rate profiles to assign to every individual 16 years or older in our data an employment rate that would be consistent with a neutral labor market. The value of E*/P is the average of these predicted employment rates across individuals in each period.
Chart 3 shows the comparison of E*/P to E/P starting in 2005 and running through May 2021. The natural employment-to-population ratio has been slowly declining due to the aging of the U.S. population, which moves more individuals into the downward-sloping section of their life-cycle employment-rate profiles.
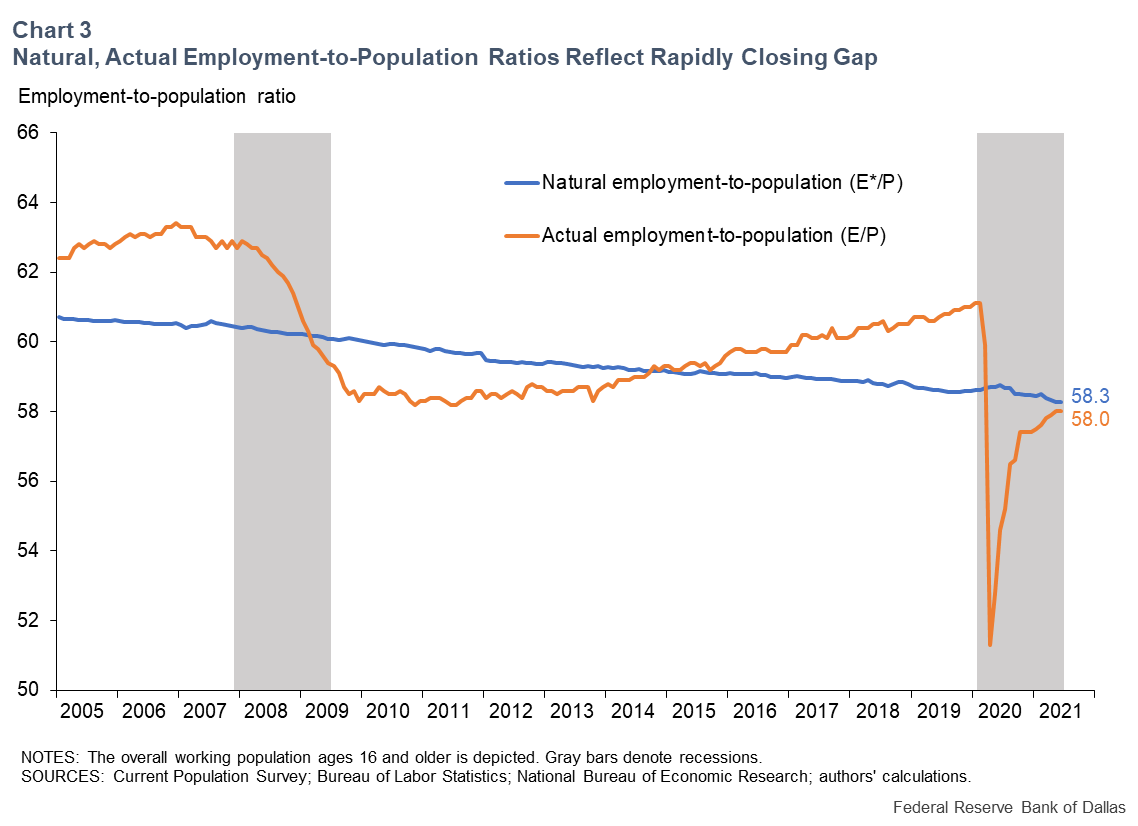
Using our estimated natural employment-to-population ratio, we can see that the labor market was tight before the 2007–09 Great Recession. Labor market slack created by the Great Recession slowly disappeared during the subsequent economic expansion, with the labor market returning to neutral in 2015 to 2016. In February 2020, the labor market was also tight, with E/P exceeding E*/P by an amount similar to that in spring 2006.
Employment plunged by 25.4 million from February to April 2020, coinciding with measures limiting economic activity to slow the spread of COVID-19. Over this period, the employment-to-population ratio declined from 61.1 to 51.3—a 9.8 percentage-point decline that created an unprecedented E/P gap of 7.4 percentage points. As of June 2021, E/P had recovered to 58.0.
Our estimate of the June 2021 natural employment-to-population ratio is 58.3, indicating that the E/P gap has declined to 0.3 percentage points. The recovery to date has closed 96 percent of the April 2020 E/P gap.
Given the size of the population age 16 or older in June 2021, this E/P gap of 0.3 represents a shortfall of 675,000 jobs.
Returning to the 7.1 million jobs lost after February 2020, our analysis indicates that apart from the 675,000 due to slack in the labor market, the bulk (6.4 million) represent jobs that exceeded E*/P due to the tight pre-COVID-19 labor market—with the balance reflecting factors such as expected retirements since February 2020.
While overall employment in June remained 7.1 million jobs below the February 2020 level, almost all of the labor market slack created by COVID-19 had already been absorbed. The remaining slack is likely to be absorbed by the end of summer. This is consistent with many other labor market indicators discussed in Dallas Fed Economics a month ago (“The Labor Market May Be Tighter than the Level of Employment Suggests”).
Our analysis shows that viewing the level of employment through the lens of the employment-to-population ratio does not indicate considerable slack in the labor market. Notably, the February 2020 labor market was tight and is not an appropriate benchmark for gauging the degree of remaining slack in the labor market.
About the Authors

Sean Howard
Howard is a research analyst in the Research Department at the Federal Reserve Bank of Dallas.

Robert Rich
Rich is a senior economic and policy advisor in the Research Department at the Federal Reserve Bank of Cleveland.

Joseph Tracy
Tracy is executive vice president and senior advisor in the Research Department at the Federal Reserve Bank of Dallas.
The views expressed are those of the authors and should not be attributed to the Federal Reserve Bank of Dallas or the Federal Reserve System.