
The labor market may be tighter than the level of employment suggests
Nonfarm payroll employment disappointed in April, increasing just 266,000, well below consensus expectations of nearly 1 million new jobs. With payroll employment remaining well below its prior peak, slow job growth would typically suggest weak demand for labor from firms and limited employment opportunities for job seekers. Current conditions in the labor market, however, may be far from typical.
There are several reasons why previously employed individuals may not currently be actively looking for work or are searching with low intensity. These reasons might include lingering health concerns; working mothers staying home to care for children, perhaps reflecting a lack of accessible child care options; generous unemployment insurance benefits; and decisions to retire or prioritize other activities.
Based on these issues, it may be wise to consider a wider range of indicators, in addition to headline employment data releases, in order to assess the state of the current labor market.
Indicators of labor market tightness
Many of the labor market indicators that we track at the Dallas Fed point to labor market conditions that are tighter than the headline level of employment would suggest.
For example, the red line in Chart 1 plots the ratio of job openings to the number of unemployed, excluding temporary layoffs.[1]
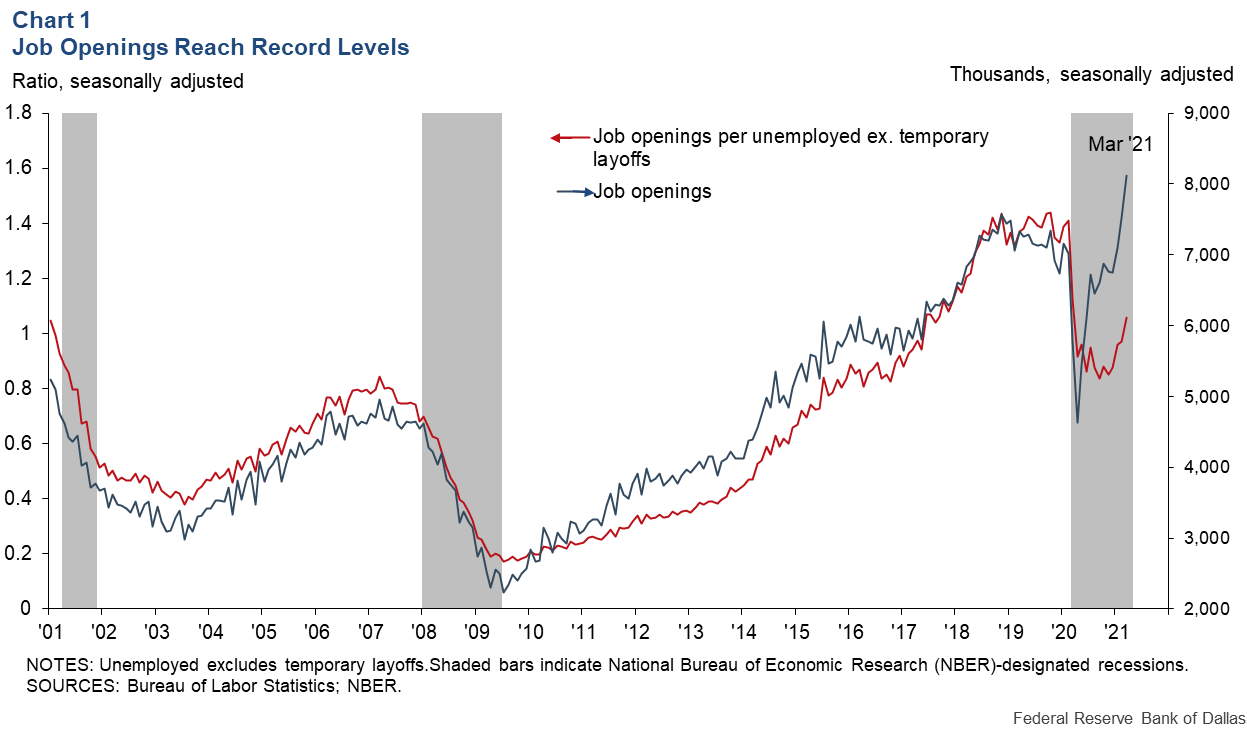
You can see in this chart that, as of March 2021, job openings were at a historically high level (blue line) and the ratio of job openings per unemployed is similar to mid-2017. Consistent with this analysis, a recent National Federation of Independent Businesses (NFIB) survey indicates the percentage of small businesses that report few or no qualified applicants for job openings increased to 54 percent in April, above the 2019 average of 52 percent.
Chart 2 plots the Conference Board labor market differential, which takes the share of consumer survey respondents saying jobs are plentiful and subtracts the share saying jobs are hard to get.
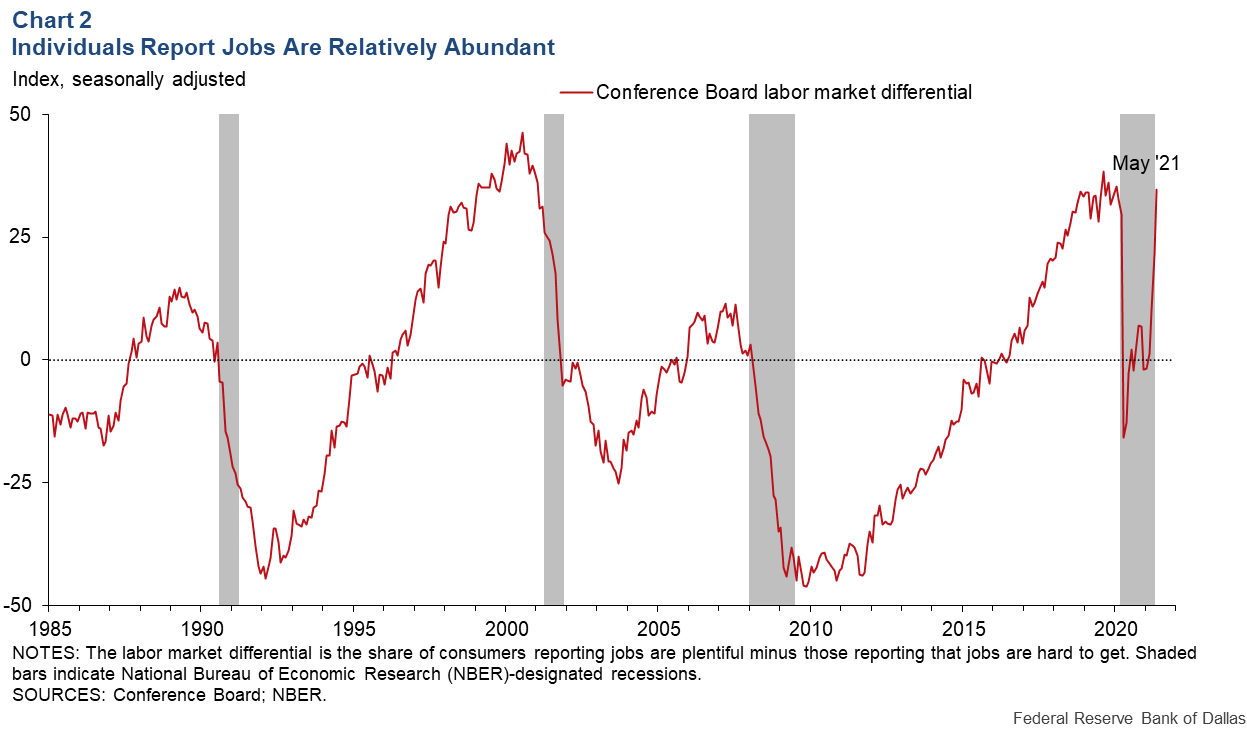
This differential has increased rapidly since March 2021, reaching 34.6 in May. This exceeds its 2019 average of 33.2, suggesting that jobs are relatively abundant for those looking for work.
In addition, the rate that employed workers quit their jobs was 2.4 percent in March, equal to its record high in 2019. The quits rate was historically tightly correlated with the unemployment rate through 2019—a high quits rate has been consistent with a tight labor market, as workers are confident enough to leave their current positions in order to pursue better opportunities.
Wage growth has remained resilient
The signals coming from wages are consistent with those coming from our alternative measures of labor market tightness. According to the employment cost index, which adjusts for composition effects, wages increased 2.7 percent over the 12 months ended March 2021. This is only slightly below the pace of wage growth in 2019 and much stronger than during the slack labor market conditions that existed during the aftermath of the Great Recession.
In the most recent April jobs report, growth in average hourly earnings accelerated sharply to 0.7 percent month over month, even though greater employment growth in lower-wage industries should have had the impact of weighing down this measure. It should be noted that last year, as the economy shed relatively low-paying jobs, compositional shifts appear to have artificially boosted average hourly earnings. This recent data is consistent with reports from employers throughout the Eleventh Federal Reserve District that the labor market has recently tightened, and that wage pressures have intensified since the first quarter of 2021.
Many former employees are unwilling to return to their previous positions
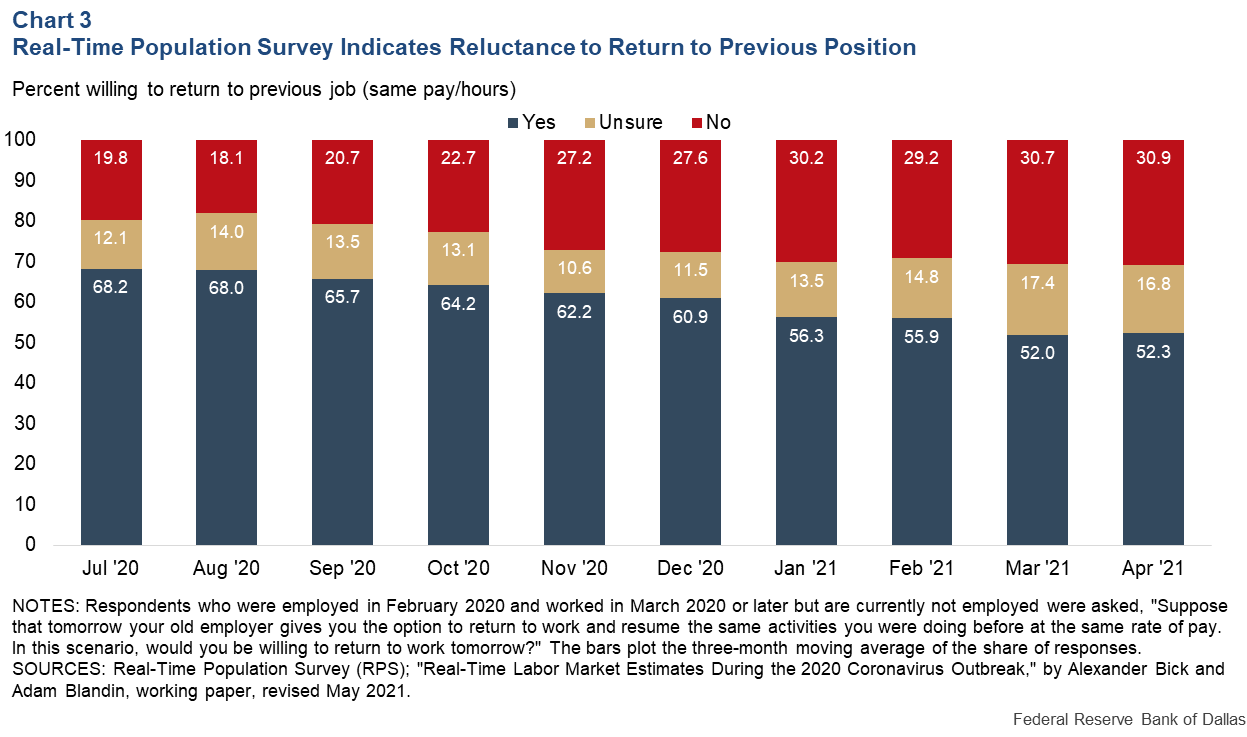
Many employers throughout our district report that they are struggling to rehire former employees as the economy reopens, as many of their former employees are reluctant to return to their old jobs. The Real-Time Population Survey asks individuals who were employed in February 2020, but not currently employed, whether they would be willing to return to their previous position for the same pay and hours. The share responding yes has declined to just over 50 percent in April (Chart 3).
Role of retirement
Since February 2020, the economy-wide employment-to-population ratio has declined by 3.2 percentage points, or by about 8.5 million workers. About 1.6 percentage points (4.1 million people) of the decline consists of unemployed workers who will likely eventually return to employment.
The remaining roughly 1.7 percentage points (4.4 million) represents a higher share of individuals not in the labor force—meaning that they are not currently actively looking for work. What is driving the higher share out of the labor force? Out of this 1.7 percentage points, 1.0 percentage points (2.6 million) report that they are currently retired, and 0.5 percentage points (1.3 million) report to be caregivers (individuals whose primary activity is taking care of a household or family).
Can we expect the 2.6 million workers who have self-identified as retired to return to the workforce? Chart 4 shows that the share of the population in retirement increased from 18.5 percent in February 2020 to 19.5 percent in April 2021. Assuming 2019 retirement rates for the various age groups, we estimate that 0.4 percentage points of the rise in retirement (1.2 million) would have retired regardless of the pandemic. The additional retirements account for approximately 0.6 percentage points (1.5 million).
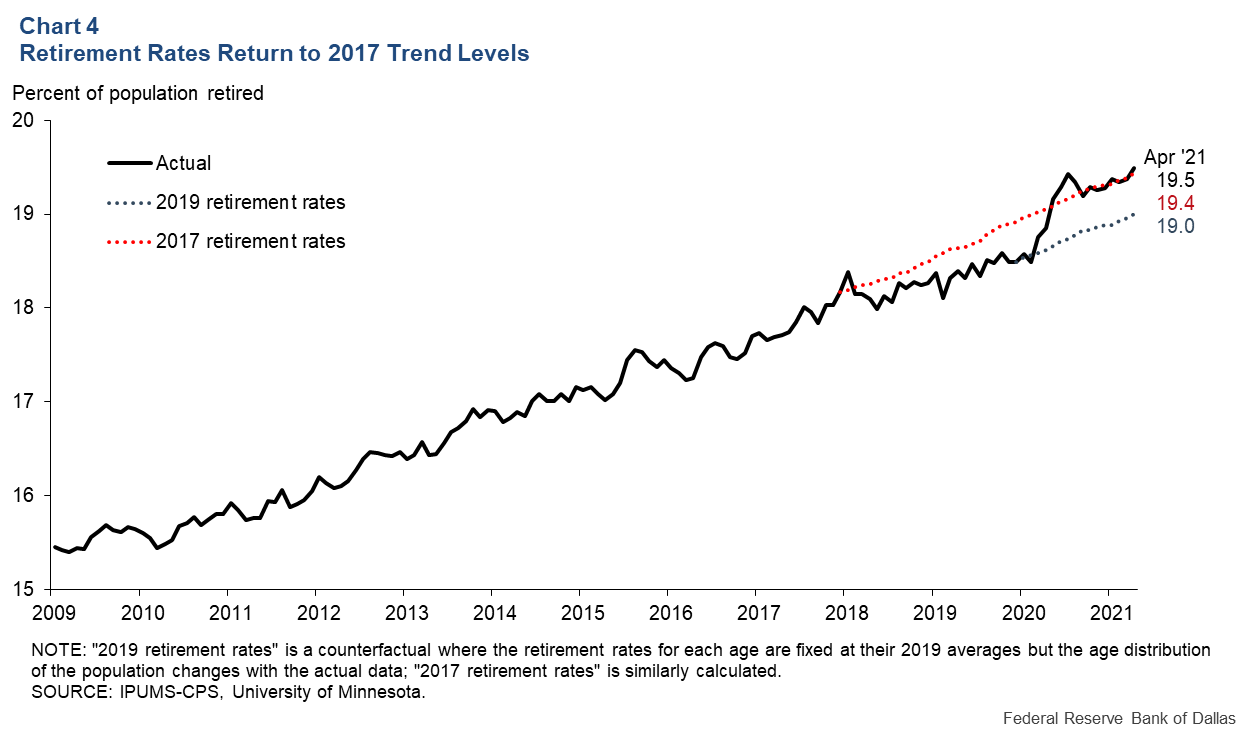
One might expect a number of individuals who have retired during the pandemic to return to the labor force as the effects of the pandemic continue to fade. However, in making this judgment it is worth comparing rates of retirement in the three years leading up to the pandemic.
Chart 4 shows how a hot labor market in 2018 and 2019 likely prompted many older workers to delay retirement, causing the share of the population in retirement to increase more slowly than the rate of aging would have implied. We see that during 2020 and 2021, the rate of retirement returned to its 2017 trend. How this trend unfolds—along with the degree to which caregiving, unemployment benefits and other special factors influence employment—will impact the ultimate size of the available workforce.
Teenage employment fully recovered
One group that is increasing its participation is teenagers. According to the latest employment report, the employment-to-population ratio for individuals age 16–19 increased to 32.8 percent in April, exceeding its prepandemic level of 32.1 percent in February 2020.
This increase in teenage employment accounted for approximately 78 percent of the increase in employment in the April 2021 jobs report. While this may signal increased opportunity for younger workers, it could also have negative implications for educational attainment and future productivity.
In particular, a wide range of school superintendents in the Eleventh District are expressing concern about dropout rates for their junior and senior classes and the long-term impact on the workforce if these young adults don’t return to achieve their high school certificate.
Implications for monetary policy
The Federal Reserve is committed to supporting a broad and inclusive recovery from the COVID-19 pandemic and resulting recession. However, as the Federal Open Market Committee’s 2020 statement on longer-run goals and monetary policy strategy states, maximum employment “changes over time owing largely to nonmonetary factors.”
In this post, we wish to suggest that policymakers should be cognizant of a range of supply factors that may currently be weighing on employment. These factors may not be particularly susceptible to monetary policy.
We would expect that many of these factors will fade as the year progresses, increasing the number of job seekers and potentially reducing labor market tightness. However, it is also possible that labor supply will increase less than expected. It is our view that this possibility should be kept in mind as policymakers assess the appropriate stance of monetary policy.
Note
- Temporary layoffs are excluded from this calculation as these individuals expect to return to a previous employer and are not necessarily searching for new employment.
About the Authors

Robert S. Kaplan
Kaplan was president and CEO of the Federal Reserve Bank of Dallas, 2015–21.

Tyler Atkinson
Atkinson is a business economist in the Research Department at the Federal Reserve Bank of Dallas.

Jim Dolmas
Dolmas is an economic policy advisor and senior economist in the Research Department at the Federal Reserve Bank of Dallas.

Marc Giannoni
Giannoni is senior vice president and director of research in the Research Department at the Federal Reserve Bank of Dallas.

Karel Mertens
Mertens is a senior economic policy advisor in the Research Department at the Federal Reserve Bank of Dallas.
The views expressed are those of the authors and do not necessarily reflect official positions of the Federal Reserve System.