
Rent inflation remains on track to slow over the coming year
The dynamic relationship of rent growth and inflation has been extensively analyzed during the past several years. Measures of market rents—the rental rate for new leases—increased about 15 percent in 2021. The surge occurred despite a modest increase of less than 4 percent in the rent and owners’ equivalent rent (OER) components of the most commonly watched U.S. inflation gauges, the Consumer Price Index (CPI) and personal consumption expenditures (PCE).
The CPI rent component lags measures of market rents by around a year because the CPI considers rents for all tenants, reflecting leases signed over the past year or so, and only gradually shows changes in market rents as leases are renewed. Consistent with this relationship, rent in the inflation data accelerated in 2022, likely peaking at a year-over-year growth rate exceeding 8 percent in April 2023 (Chart 1).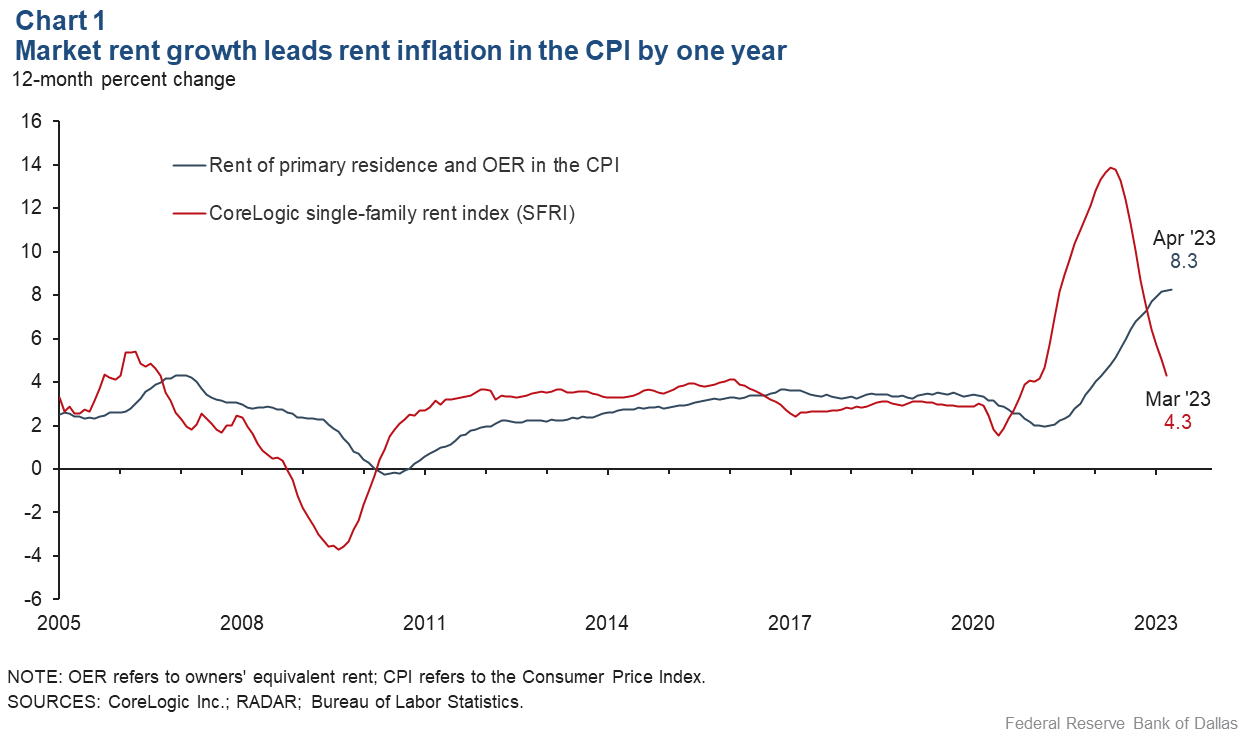
A forecast of rent inflation using the Single Family Rent Index (SFRI) from CoreLogic, a financial analytics firm, would have accurately predicted this path a year in advance and currently anticipates rent inflation slowing to below 6 percent by the end of first quarter 2024.
Using market rents to forecast rent inflation
Researchers at the Bureau of Labor Statistics and the Federal Reserve Bank of Cleveland created a new-tenant repeat-rent index based on the microdata underlying the CPI, using only leases of tenants who recently moved. As one would expect, it has a strong leading relationship with rent and OER growth in the CPI. However, the index is not regularly updated, making it unsuitable for forecasting the rent component of inflation.
The authors report that an alternative measure of market rents, the CoreLogic single-family rent index (SFRI), is a good proxy for their microdata index, even though the sample is not representative. The SFRI has the benefit over other popular measures of market rents because it goes back to 2005. This history allows estimation of the relationship between the SFRI and rent and OER in the CPI and evaluation of how a forecast would have performed.
Chart 2 depicts the same series from Chart 1 but in levels instead of growth rates. It shows that in 2008–09, market rents declined significantly, with CPI rent inflation gradually slowing as leases expired and reset to the lower level.
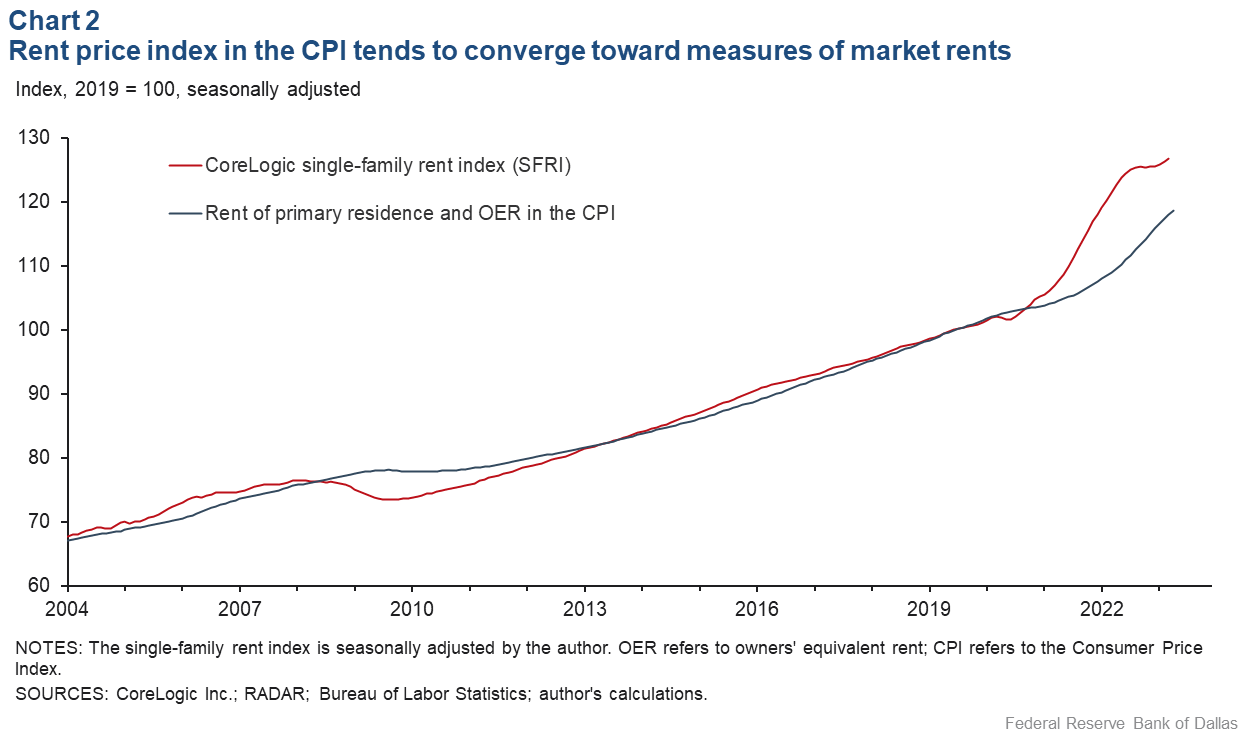
Similarly, market rents spiked in 2021, and rent CPI gradually accelerated, reaching 9 percent in late 2022. Since the second half of 2022, market rents have flattened, leading to optimism that rent in the CPI will slow quickly as well. What does the statistical relationship between these two indicators say about the likely path ahead?
A vector error correction model (VECM) is estimated on the two series in Chart 2. A VECM explains growth rates of the two series, taking into account past growth rates as well as their level relationship and any tendency for the series to move toward each other when a gap opens up, as in 2008 or 2021.
Chart 3 shows how a forecast with a horizon of one year would have performed out of sample—estimating the relationship with data only through the period over which the forecast would have been made. While the speed and magnitude of the rent surge’s contribution to inflation in 2022 surprised many, this model would have accurately predicted the path of rent CPI a year in advance, as shown in the dashed line. The root mean squared error—the size of a typical forecast miss—was only 0.34 percentage points for the period from 2012 to first quarter 2023. It would be difficult to achieve smaller forecast errors with alternative approaches.
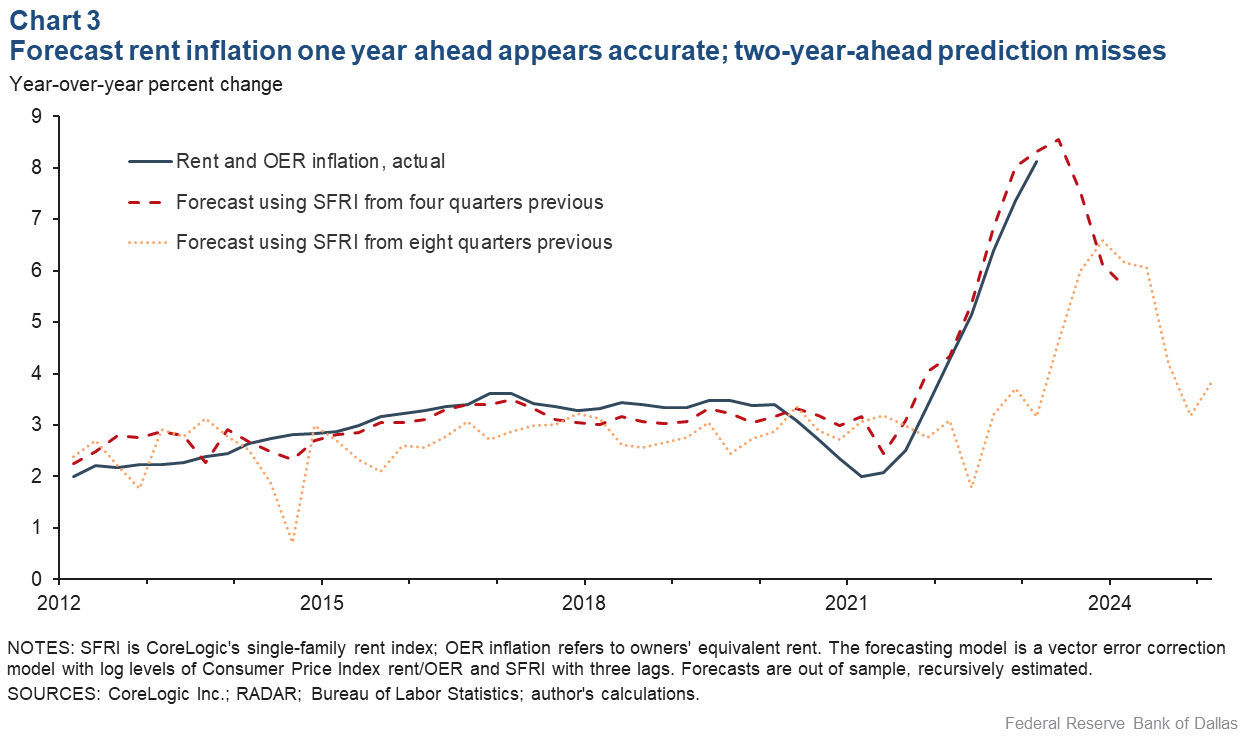
The dotted line in Chart 3 repeats this exercise but at a horizon of two years out. This performance is much less impressive, with a root mean squared error of 1.33 percentage points. A simple forecast of a constant 3.0 percent prediction would have outperformed it. Evidently, there is little information in market rents about the path of average rents two years out, which is sensible given the lead–lag relationship of the two series and leases typically running less than two years.
What to expect for rent inflation over the next year
The dark squares in Chart 4 plot the forecast starting from first quarter 2023 data. The year-over-year rates of rent and OER growth are predicted to slow from 8.3 percent in April to 5.7 percent in first quarter 2024.
Rent and OER make up 41 percent of CPI (excluding food and energy), so this deceleration would imply a 1.1-percentage-point smaller contribution to core CPI. Rent and OER make up 17 percent of the other inflation indicator—the PCE (excluding food and energy)—and would contribute 0.4 percentage points less. The lighter squares plot the one-quarter annualized growth rate forecast. Notably, the March and April 2023 one-month growth rates have slowed to a pace consistent with this forecast.
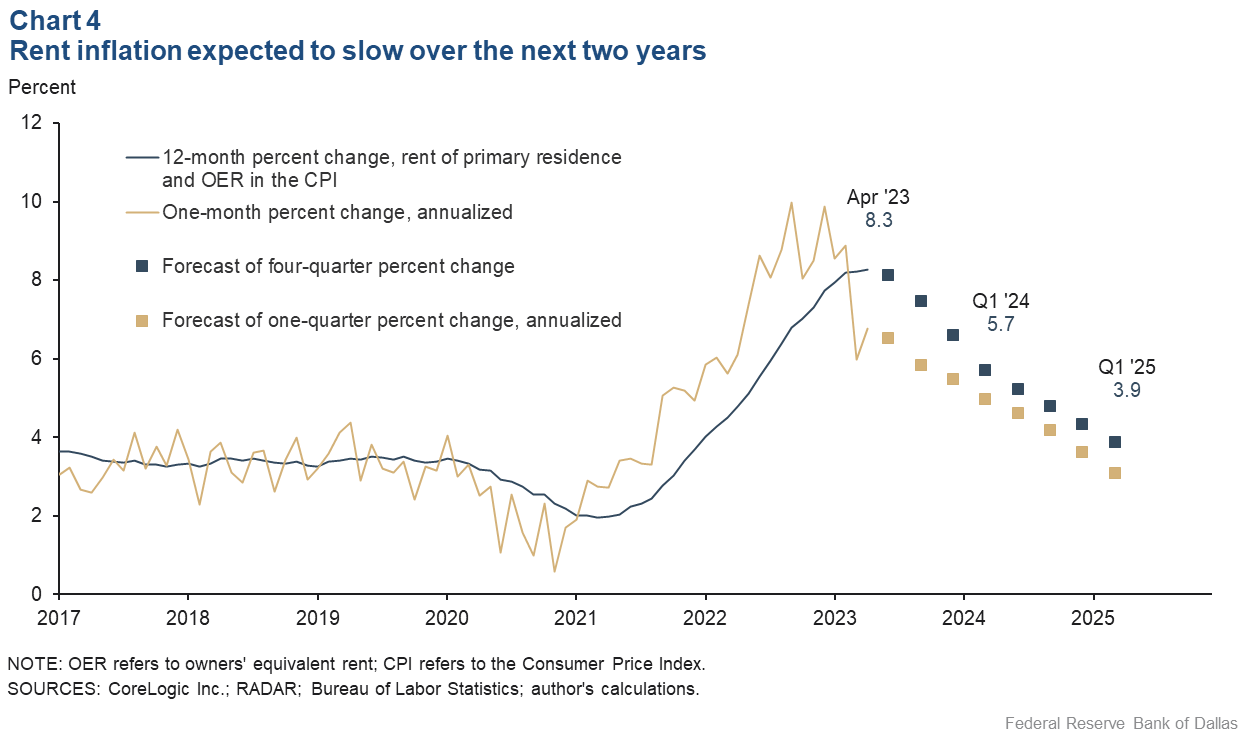
The forecast for the year ending in first quarter 2025 is for even more slowing, to 3.7 percent, near the 2017–19 average of 3.4 percent. However, as noted, this model at a two-year horizon has not been accurate. The path of rent inflation beyond one year is much more uncertain, depending on the evolution of market rents over the coming year and the overall strength of the economy.
About the Author

Tyler Atkinson is a senior business economist in the Research Department at the Federal Reserve Bank of Dallas.
The views expressed are those of the author and should not be attributed to the Federal Reserve Bank of Dallas or the Federal Reserve System.