
Mexico’s productivity woes limit nearshoring, growth potential
Industrial policy reform, nearshoring and a deeper Mexico-U.S. partnership could provide tailwinds for Mexican economic growth. Whether Mexico can harness the full potential of such transformative change is less clear.
Mexico’s economic gains have been disappointing for several decades despite a series of reforms since 1986, which included opening the economy to foreign trade and investment, achieving fiscal discipline and privatizing state-owned enterprises.
Mexico’s real (inflation-adjusted) gross domestic product (GDP) per capita grew on average 0.7 percent per year from 1980 to 2019, considerably below peer countries that started from comparable income levels. Over the same period, Chile averaged 3.0 percent growth and South Korea 5.3 percent.
Low productivity gains explain this gap. Mexico’s economic growth has largely been driven by an expanding labor force and, to a lesser extent, by capital investment, reflecting Mexico’s long-time position as a top U.S. trade partner. Yet, this progress has been offset by poor total factor productivity (TFP) gains, that is, how efficiently inputs are used in creating output. TFP is the primary driver of growth in most advanced and emerging economies.
Mexico can no longer solely depend on favorable demographics for economic expansion. Its fertility rate of 1.9 children per woman is below the replacement rate, the number of children needed to keep the population stable from generation to generation. Mexico’s demographic dividend—its disproportionately large increases in the working-age population—is expected to end by 2030.
Mexico’s large informal sector, operating mostly outside of government oversight, has sidestepped policy reforms enacted a decade ago that were designed to draw it more into the formal economy. Additionally, Mexico still struggles with persistent violent crime that remains outside the control of authorities. These factors complicate Mexico’s economic outlook and its attractiveness to investment.
Taken together, to develop its economy, Mexico will need to increasingly rely on boosting TFP growth. To make this pivot, Mexico must renew its reform efforts. A comparison to countries with economic backgrounds that resemble Mexico offers insight, among them Korea, a one-time middle-income country that undertook reforms and successfully became a high-income country.
Decomposing growth in Mexico’s GDP per capita
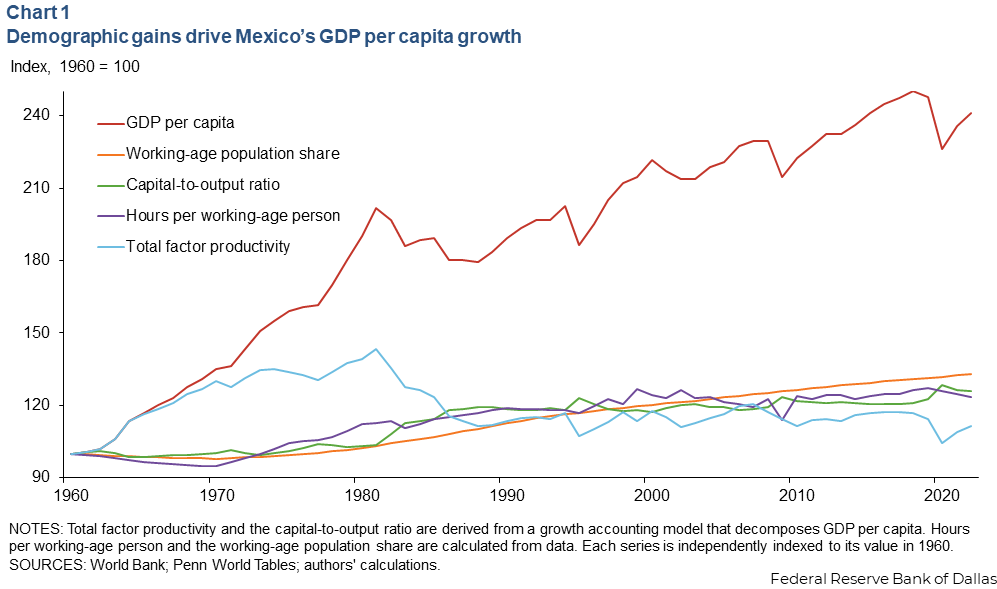
In a standard neoclassical model, economic growth results from increasing the amounts of capital and labor, and the productivity of these inputs. This provides a framework to examine changes in Mexico’s real GDP per capita. By separating labor into two components—hours worked per working-age person and the working-age share of the total population—GDP per capita becomes the product of four terms:[1]
- Productivity: TFP that increases with technological improvement, raising the productivity of the inputs to production (capital and labor).
- Capital: The capital stock (assets including plants and equipment) relative to GDP.
- Hours worked: The intensity of labor, measured as hours worked per working-age person.
- Working age population: The extent of potential labor, measured as the share of the population that is of working age (age 15–64).
Compared with other countries of similar economic stature, Mexico’s growth dynamics are unusual. Typically, TFP drives per capita GDP growth over long periods of time. However, Mexico’s TFP fell sharply in the 1980s and has since stagnated (Chart 1). On the other hand, the capital-to-output ratio, hours worked per working-age person and particularly the working-age population ratio have all increased considerably, driving per capita GDP growth over the past four decades.
Mexico’s stagnant TFP
Mexico’s lackluster economic performance has been the subject of much study, including by economists Gordon H. Hanson and, more recently, Santiago Levy. Factors holding back productivity growth include poorly functioning credit markets that limit borrowing; extensive monopolies in certain industries that limit competition and drive up costs; and a large informal sector that reduces tax revenue and limits firm size.
An informal economy is made up of mostly small businesses that are not taxed or regulated, with workers who lack benefits such as health care and pensions. Because informal firms are off the books, they typically cannot borrow from banks. In Mexico, the informal sector accounts for a staggering 24 percent of GDP and 55 percent of employment.
Levy credits the reforms that occurred from the 1980s to 2018 for lasting macroeconomic stability and for resiliency to negative external shocks such as the 2008–09 Global Financial Crisis. In addition, tax reform and declining oil production reduced Mexico’s fiscal vulnerability to sometimes volatile international oil prices.
However, reforms only went so far. Productivity failed to grow because the informal economy continued, efforts to promote competition didn’t yield the expected results and weakness of the rule of law persisted.
Despite extensive banking reforms following Mexico’s 1994–95 financial crisis and currency devaluation (the Tequila Crisis) and improved credit access since 2000, the country’s financial sector remains notable for its low levels of credit extended to firms and households. During 2000–22, domestic credit to the private sector as a share of GDP averaged just 24 percent compared with Chile, 99 percent; Brazil, 51 percent; and Korea, 131 percent. Such a low rate of credit hampers production, capital formation and innovation that ultimately generates economic growth.
Some national and local monopolies for goods, services and energy have persisted and also contribute to poor productivity growth. Before the energy and telecommunications reforms, electricity in Mexico was expensive, raising production costs and hurting productivity in energy-intensive sectors such as manufacturing. In addition, pricey telecommunication services limited the competitiveness of Mexican firms. More recently, the earlier energy reforms were reversed, increasing prices and hampering accessibility to reliable power, particularly for manufacturing.
The informal sector has hardly been touched. Informal firms tend to remain small, with low productivity and limited access to finance. Hanson cites plant-level research showing that Mexico’s aggregate TFP would have grown an additional 100 percent in manufacturing and roughly an additional 300 percent among non-manufacturing establishments from 1999 to 2004 if factors of production had moved from unproductive firms toward more productive ones.
Moreover, formal sector firms (which also tend to be more productive) face greater regulatory and tax burdens. This added oversight hinders the allocation of factors toward these firms. In addition, Mexico’s dual system of social protection, in which formal sector workers and firms indirectly subsidize their informal counterparts’ access to public services, further incentivizes business owners to keep operations in the informal economy.
A World Bank study of Mexico’s lackluster TFP growth examined 20 million Mexican firms between 1994 and 2019 and came to conclusions similar to those of Hanson and Levy. The World Bank study also identified a geographic productivity divide running between the north-center and the south of Mexico.
There is also a divide between modern firms: those firms that can access finance and strong management and are integrated into global value chains, and traditional firms that have limited access to finance and are unable to benefit from Mexico’s global integration. The World Bank identifies a lack of competition in the banking sector as a primary factor behind the lack of credit to small firms, which are overrepresented in the south, a region with a smaller bank presence.
Exploring Mexico’s growth potential
Looking at countries similar to Mexico, including those that went on to become high-income countries, clarifies Mexico’s per capita GDP growth potential and how it can transition from its middle-income status in coming decades.
Brazil, Chile, China, Japan and Korea provide insights. Brazil is a large but still middle-income Latin American country, much like Mexico. China is larger than Mexico. It is also middle income and benefits from massive exports to western countries, while aiming to make the jump to high income. Chile, Japan and Korea are all success stories, elevating from middle- to high-income countries. These economies serve as benchmarks to project a best-case scenario for Mexico’s growth over the next two decades.
Mexico is analyzed relative to its peers based on productivity (TFP), capital, hours worked and working-age population. The potential growth of each factor in Mexico is forecast based on how countries in the dataset grew at comparable stages of their development. For example, 10-year forward growth in the TFP factor is based on the performance of the benchmark countries as each moved to and beyond where Mexico is today as measured by GDP per capita relative to the U.S.
Similarly, the 10-year forward average growth of the capital-to-output factor and hours-per-working-age-person ratio are based on how each grew in the peer countries after attaining a level resembling Mexico’s current position.
Ten-year-forward average growth is defined as the geometric mean of the annual growth rates during the 10 years following each current observation. The plots for Brazil, Chile, China, Japan, Korea and Mexico are combined and ordinary least-squares regression is fit on the combined data.
Using fitted regression lines derived from these plots, Mexico’s 10-year-forward average growth for each factor/ratio can be estimated for 2022–31 and 2032–41 given the actual values in 2022.
For the working-age share of the population, the expected 10-year average growth rates are directly derived from U.N. population projections.
Chart 2 shows the relationship between per capita GDP relative to the U.S. and the 10-year forward average growth in the TFP factor. The relationship is downward sloping because as a country moves closer to the technological frontier (data points on the right side of the graphic), innovation becomes more difficult. Countries usually grow faster earlier in their development (the left side of the graphic, at low levels of income) because they are able to adopt existing technologies and blueprints for growth.
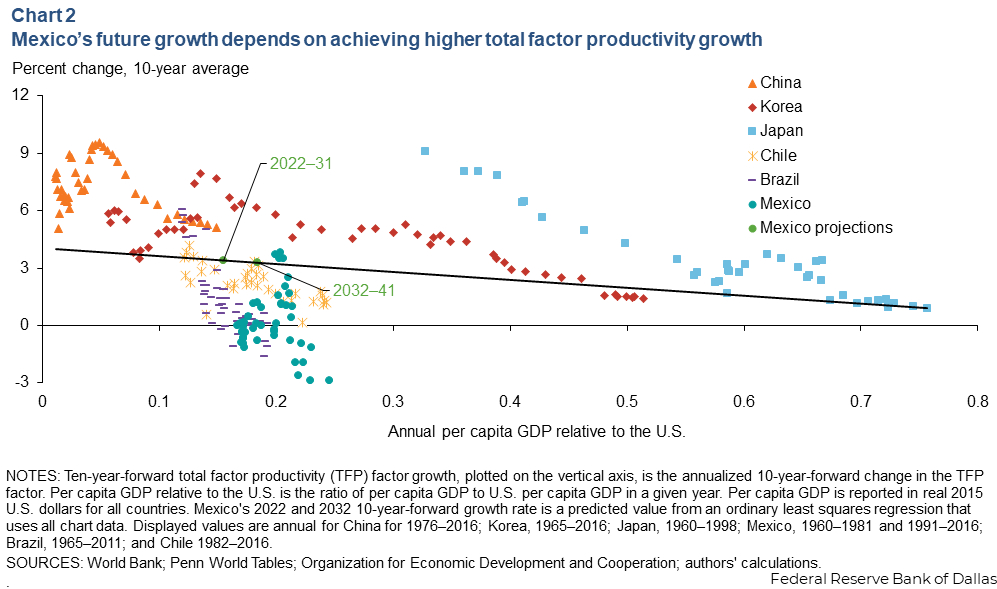
Almost all of the points for Mexico lie below the regression line, many in negative territory, reflecting Mexico’s struggles with TFP growth. Given Mexico’s low income level, TFP growth should have been much higher.
Thus, estimated 10-year forward TFP growth for 2022 and 2032 should be viewed as where TFP growth could be if Mexico undertook reforms similar to those in other countries that have transitioned to high income. In this scenario, TFP’s contribution to Mexico’s growth over the next 10 years would be 3.4 percentage points and 3.3 percentage points the following 10 years.
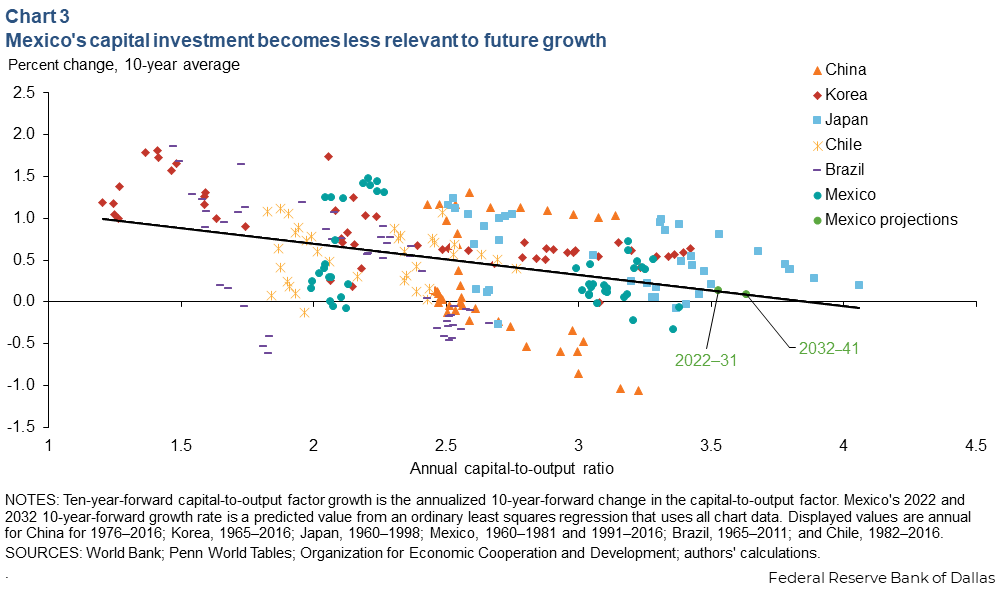
Chart 3 shows the downward-sloping relationship between the 10-year forward capital-to-output factor growth and the capital-to-output ratio. The downward sloping relationship can be understood by considering the Solow growth model. A consequence of the model is that countries with scarce capital tend to experience higher returns on investment in capital, leading to capital deepening, while countries with abundant capital tend to see smaller returns on capital, leading to capital shallowing.

Over the years, much capital has been invested in Mexico largely due to the long-standing manufacturing linkages and trade arrangements with the U.S. In 2022, Mexico was relatively capital abundant, so the model predicts only 0.1 percent growth in the capital-to-output factor over the next two decades.
Nearshoring has gained momentum following recent trade tensions and supply chain disruption between the U.S. and China, potentially pointing to greater capital investment in Mexico among U.S. firms and suppliers. Our analysis suggests, because Mexico is already very capital abundant, these developments are unlikely to boost GDP per capita growth in a sustained way purely through capital accumulation. Such GDP growth gains would likely occur through productivity growth, potentially as a positive spillover from nearshoring.
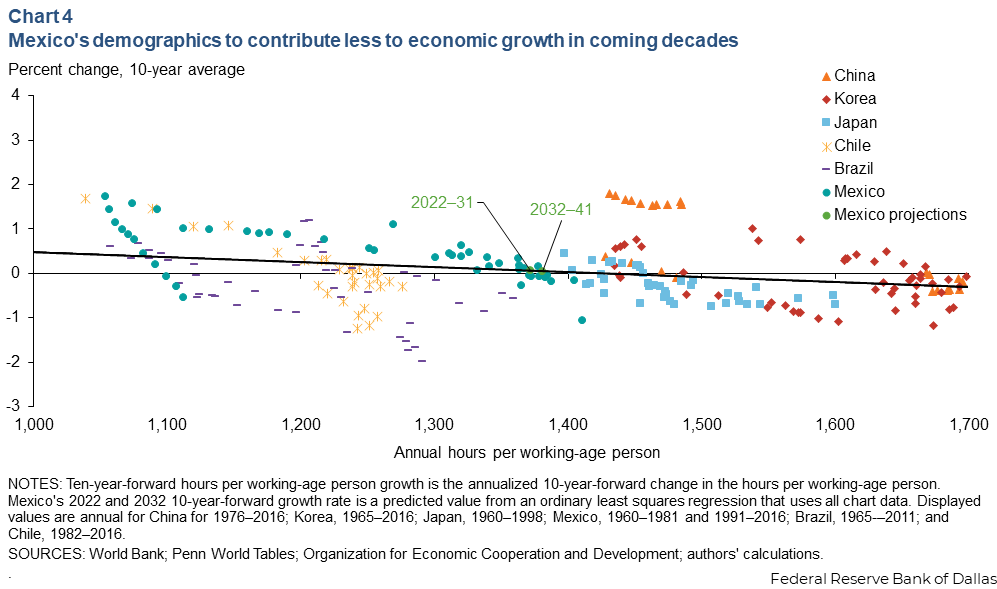
Chart 4 shows the relationship between hours per working-age person and 10-year average growth in hours per working-age person. The relationship is downward sloping for a reason similar to the explanation for the capital-to-output factor. When hours worked per working-age person are high, there is not much room for further increases since the average worker is already working many hours, or labor force participation is already high.

Mexico’s current hours per working-age person is in the middle of the distribution, so little change is likely over the next 20 years. This factor is expected to grow by 0.1 percent annually over the next two decades.
The final factor, the working-age share of the population, uses the U.N.’s projections of population by age. The working-age share is projected to grow only 0.2 percent annually over the next 10 years and decrease by 0.3 percent annually over 2032–42, as Mexico’s population dividend runs out.
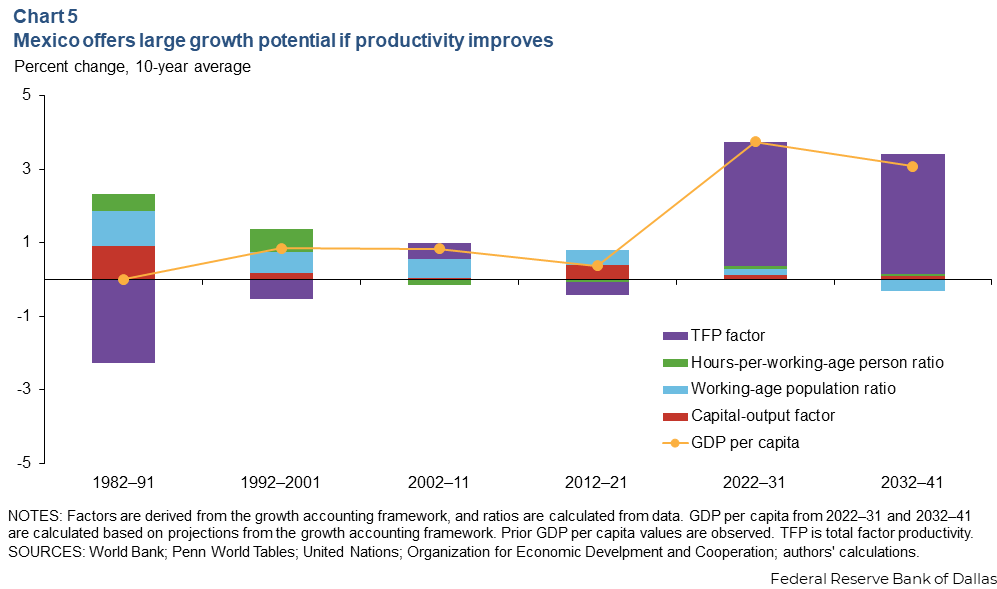
Taking these four estimates together, Mexico’s real per capita GDP is projected to grow 3.8 percent annually over the next 10 years and 3.1 percent annually over the following 10 years. Chart 5 shows the GDP per capita forecasts and breakdown by each factor, indicating future growth would be largely driven by the TFP growth.

Such performance would require Mexico to reform in ways that enable it to break from its trend of flat to negative TFP factor growth over the past 40 years.
Since these estimates are designed to be an upper bound, reflecting the full potential of Mexico’s economy, they are in contrast to other projections of Mexico’s per capita real GDP growth.
For example, the International Monetary Fund projects Mexico’s real per capita GDP to grow at an annual average of 1.4 percent over 2022–28.
How can Mexico reach its potential?
If Mexico aspires to make the transition from middle income to high income, it could look at reforms similar to those undertaken in Korea during the 1990s and early 2000s. When they were implemented, Korea was a middle-income country similar to Mexico today.
A World Bank report characterized these reforms and the underlying goals as a transition to a “knowledge-based economy.” Such reforms, also detailed in a recent paper, included promoting competition and taking antitrust actions, reducing barriers to finance and to market entry for firms, encouraging higher education and vocational training, and relaxing restrictions on investment, particularly foreign direct investment.
Mexico has progressed in some areas, and policy research has outlined some additional steps the government can take to reverse the productivity gap of the past few decades. Recommendations include increasing competition in the telecommunications, energy, pharmaceutical and certain food industries, and incentivizing workers and firms to move to the formal sector. Also suggested are increasing protections for creditors and tackling the education quality gap, which leaves many workers with limited educational attainment.
Even if Mexico gains from the reorganization of global value chains and industrial production relocation via nearshoring, the country clearly needs to unlock its productivity growth potential in order to maximize its opportunities and ascend to the next level of development.
Note
1. More formally, the GDP per capita decomposition is:
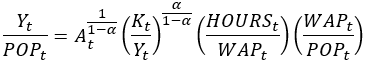
Thus, GDP per capita,  , is the product of the total factor productivity (TFP) factor,
  , the capital-to-output factor,
  , the hours-to-working-age-population ratio,
  , and the working-age-population-ratio,
  . Explicitly including the working-age population ratio reveals how it directly contributes to Mexico’s growth. The latter three factors and GDP per capita are observable, but the TFP factor is calculated as a residual by dividing GDP per capita by the latter three factors for each year.
About the authors

Jesus Cañas is a senior business economist in the Research Department of the Federal Reserve Bank of Dallas.

Sewon Hur is a principal research economist in the Research Department of the Federal Reserve Bank of Dallas.

Braden Strackman is a research analyst in the Research Department at the Federal Reserve Bank of Dallas.

