Russian ruble buckles under trade sanctions, declining export earnings
Russia’s currency is losing value, falling 40 percent against the U.S. dollar since December 2022. To stabilize the currency, the Russian central bank held an emergency meeting in August and raised interest rates from 7.5 percent to 11 percent.
The move is reminiscent of Russia’s 1,150 basis-point (11.5 percentage-point) policy rate increase in response to Western financial sanctions after its Ukraine invasion. However, the current currency malaise is different. This time, the ruble’s decline is attributable to trade sanctions and plunging export earnings rather than sanctions affecting the central bank and individual financial institutions.
Initial impact of sanctions appears fleeting
The Group of Seven and its allies imposed harsh financial and economic sanctions on Russia beginning in late February 2022, following the invasion. Severe limits were placed on a number of Russian banks, and most foreign exchange reserve assets of the Russian central bank were frozen.
The moves aimed to collapse the Russian currency, making it hard to finance and conduct the war. Initially, in early March, this appeared to work. But the Russian central bank reacted, sharply boosting its policy rate and imposing strict capital controls to limit capital outflows. The response prevented the ruble’s collapse.
In May 2022, we concluded that the combination of Western financial sanctions and Russian capital controls stabilized the currency by effectively shutting down a large portion of the capital and financial account. In balance-of-payments accounting, a country’s net receipts of capital can be divided into a current account (the trade balance plus net income from overseas investment) and the capital and financial account (net receipts due to purchase and sale of foreign assets).
A positive current account—a trade surplus—puts upward pressure on the value of a currency as more capital flows into a country than flows out. Similarly, net purchases of a country’s assets put upward pressure on the value of the currency.
On the eve of the Ukraine invasion, Russia had a large trade surplus, and net capital flows into Russia through the capital and financial account were negative, that is, investment capital was flowing out. Taken together, the trade account put upward pressure on the value of the currency, while net foreign purchases of overseas assets applied downward pressure.
The combination of Western sanctions and central bank capital controls removed this downward pressure, and the Russian currency appreciated. As Chart 1 shows, after the immediate depreciation following the invasion, the Russian currency appreciated, and by the summer of 2022, the ruble traded well above prewar levels.
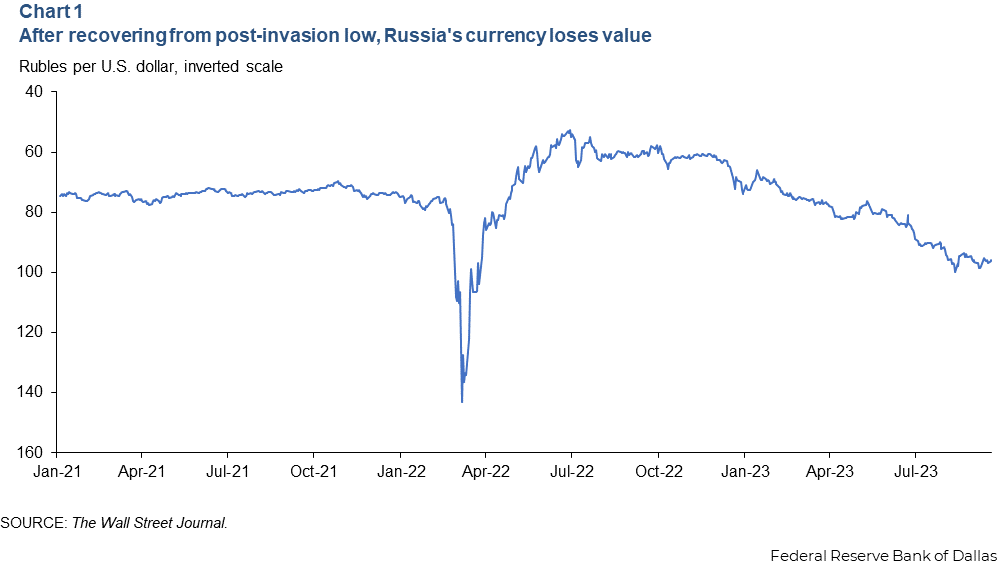
In our previous article in 2022, we concluded that as long as the Russian trade surplus held, the Russian currency had found a new, stable equilibrium. This continued to be the case until December 2022, when the ruble’s value steadily declined, falling 40 percent through mid-September 2023.
Why did the stable equilibrium with a strong trade balance fall apart? Chart 2 plots Russian goods exports and imports. The chart, which begins in 2013, shows that Russia has run a strong trade surplus, but this surplus has fallen over the 18 months since the invasion.
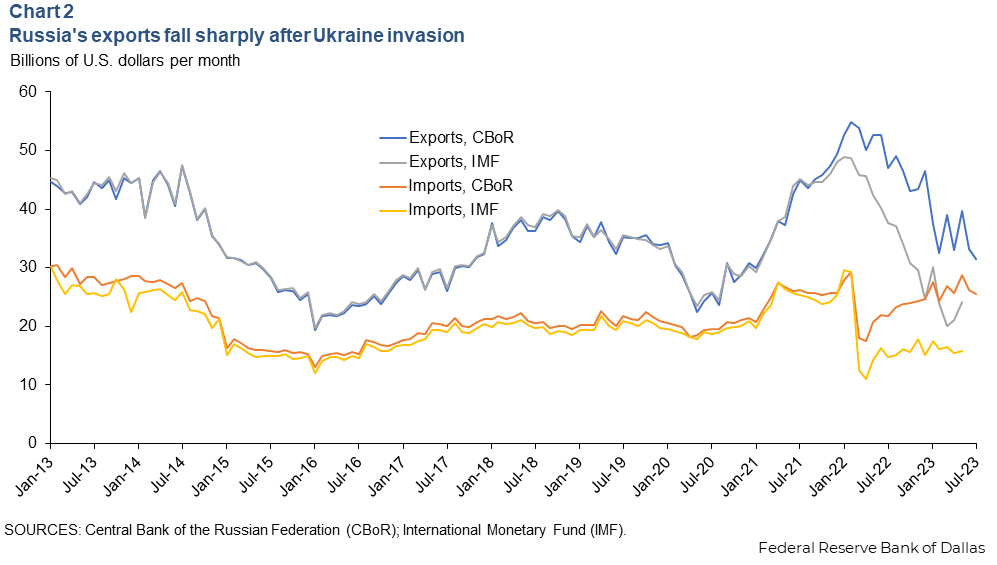
There has been a discrepancy in Russian trade data since February 2022. The chart plots exports and imports from two sources, International Monetary Fund Direction of Trade statistics and the Russian central bank. Before 2022, these two series were nearly identical, but after the invasion, a gap opened between the two. Explaining that discrepancy is beyond the scope of this article, but importantly, the trade surplus has been this low only twice over the past decade—during the COVID-19 crisis of early 2020 and in January 2016.
Declining value of energy exports drives overall exports lower
Crude oil, petroleum products, natural gas and liquefied natural gas (LNG) made up nearly half of all Russian exports in 2021. Crude oil and petroleum products alone totaled 36.6 percent of total exports ($181 billion); natural gas accounted for 12.7 percent of exports ($63 billion). Russia was the second-largest producer of crude oil and natural gas globally behind the United States by year-end 2021.
Interestingly, previous episodes of low Russian trade surpluses, in 2016 and 2020, occurred when the price of Brent crude fell below $30 a barrel (Chart 3). Brent crude, the North Sea benchmark, now trades above $80. The chart also shows that before the invasion, the price of Russian oil, Urals crude, was nearly identical to the price of Brent.
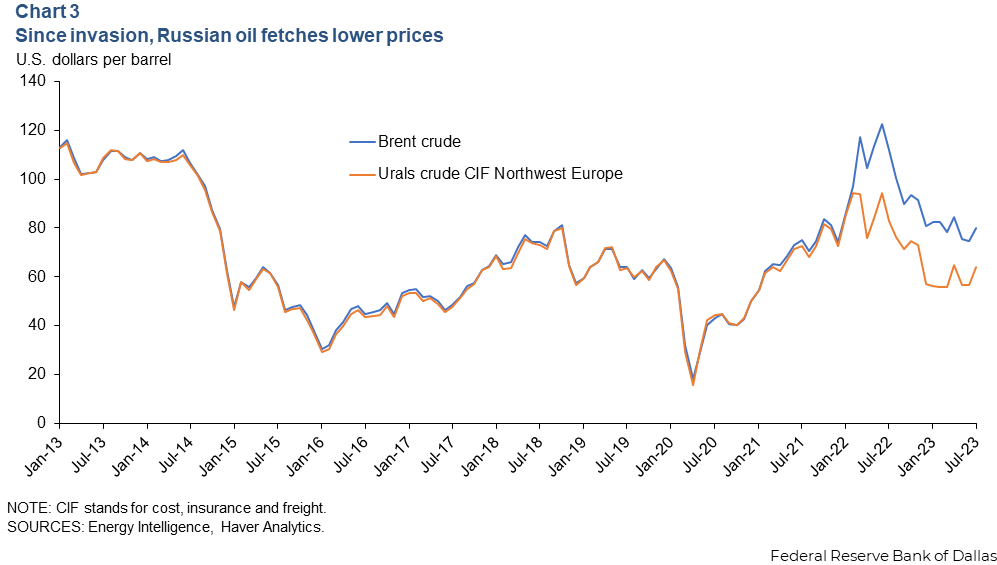
Since the invasion, Russian oil on a cost, insurance and freight (CIF) basis has traded at a discount to Brent of around $20 to $30 per barrel. The free on board (FOB) price discount is larger at Russian loading ports, as that excludes insurance and freight. So even though Brent crude trades above $80 per barrel, the price Russia receives for its oil is much less.
Sanctions help explain lower Russia oil receipts
The European Union (EU) countries, along with the U.S., the U.K. and some Asian nations, sharply curtailed their Russian oil imports following the invasion. The U.S. and the U.K. placed embargoes on Russian oil early in 2022, and the EU imposed an oil embargo and a price cap in December 2022. The result has been a dramatic shift in the buyers for Russian oil (Chart 4).
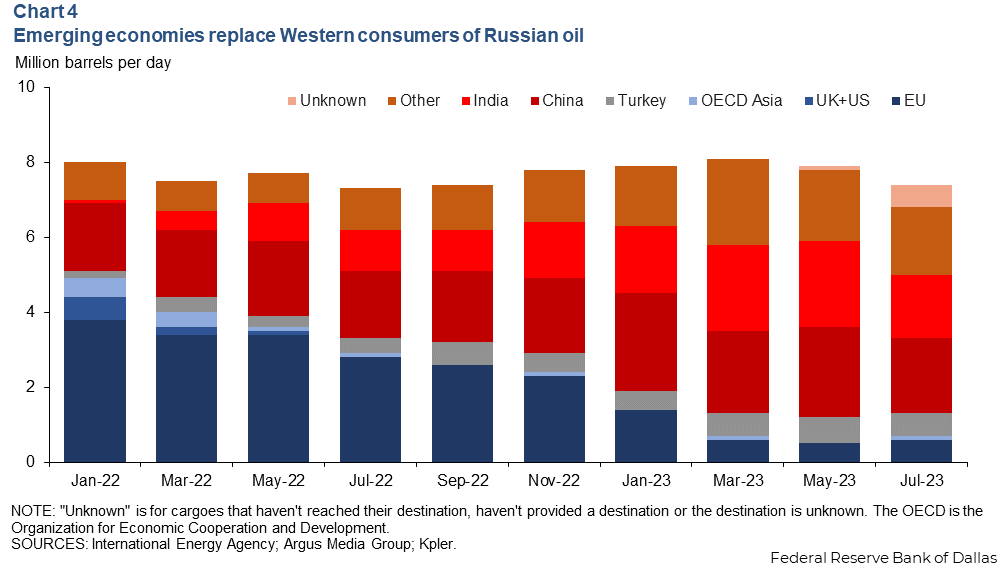
Before the invasion, almost 5 million barrels per day of Russian crude oil and oil products went to the EU, the U.S., the U.K. and the Asian members of the Organization for Economic Cooperation and Development. This represented over 60 percent of Russia’s total oil exports. Now 0.7 million barrels per day go to those countries, or less than 10 percent.
However, the total quantity of Russia’s oil exports has remained fairly stable, as China, India and other emerging markets buy the embargoed oil that once went to Western countries. Federal Reserve Bank of Dallas research earlier this year explained how this trade diversion helped ease the embargo’s impact on Russia.
Ongoing research supports the view that the limited number of potential buyers for Russian crude and refined products increased their bargaining power, allowing purchasers to demand greater discounts to the global market as early as March 2022.
Because of the embargo, Russian petroleum exports must travel significantly longer distances to the new buyers than to the Western buyers, driving up shipping costs. The price cap, instituted in December 2022 for crude oil and in February 2023 for petroleum products, allowed Western companies to continue insuring shipments as long as they did not exceed a maximum price.
While trade diversion didn’t much affect the volume, the pricing discounts led to a decline in the value of Russian petroleum exports. The International Energy Agency estimates Russia’s export revenue from crude and refined products fell 30 percent from the first half of 2022 to the first half of 2023, while volumes were largely stable.
Russia’s natural gas export volume, price decline
The other side of Russia’s energy export mix is natural gas. Before the Ukraine invasion, 84 percent of Russia’s exported natural gas was transported via pipelines, and the remaining 16 percent was LNG. Increased European LNG imports from non-Russian sources, warmer winter weather and European energy conservation measures contributed to sharply lower natural gas demand over the past year. The European price fell from $48 per million British thermal units (MMBtu) during the second half of 2022 to $14 per MMBtu during the first half of 2023.
Slightly more than 80 percent of piped natural gas from Russia went to Europe in 2021. The volume of Russian gas through German, Polish and Ukrainian pipelines to Europe declined by roughly 90 percent from 2021 to the first half of 2023. In the short run, there are few alternative outlets for selling piped gas.
Liquefaction facilities or new pipelines to move gas to new, non-European customers take time to construct. Plus, piped gas that would have been sold to Europe before the invasion is now probably not exported at all. While there are no official estimates regarding the value of Russian natural gas exports for 2022 and 2023, it is likely that lower prices coupled with lower export volumes amounted to a decline in the value of natural gas exports from the first half of 2022 to the first half of 2023.
Price discounts for crude oil will likely persist because of the bifurcation of buyers and the extended distance exports must travel to their destination. Piped gas volumes to Europe continue to remain low. While Russia aims to increase exports of natural gas to China, it will take many years to build new pipelines.
With measures targeting Russian exports likely to persist, the country’s balance of payments will remain under pressure, leading to continuing currency weakness.


