
How long is the soft-landing runway for the labor market?
The Federal Open Market Committee has increased the benchmark federal funds rate by 5 percentage points (500 basis points) over the past 18 months in an effort to bring down inflation. While the labor market has undoubtedly cooled, it remains strong by almost any measure.
During the three months ended in September, the unemployment rate averaged 3.7 percent, just above the rate when the monetary tightening cycle began in March 2022 and near its lowest level since the late 1960s. Similarly, payrolls expanded by 266,000 jobs over the three-month period, well above estimates of what is needed to account for trend labor force growth.
At the same time, a three-month average of the job vacancy rate—job openings as a share of the labor force—fell from 7.1 percent in March 2022 to 5.5 percent in August, according to the Bureau of Labor Statistics’ most recent Job Openings and Labor Turnover Survey (JOLTS).
Historically, such a rapid cooling in the labor market has only occurred during periods of recession and rising unemployment (Chart 1).
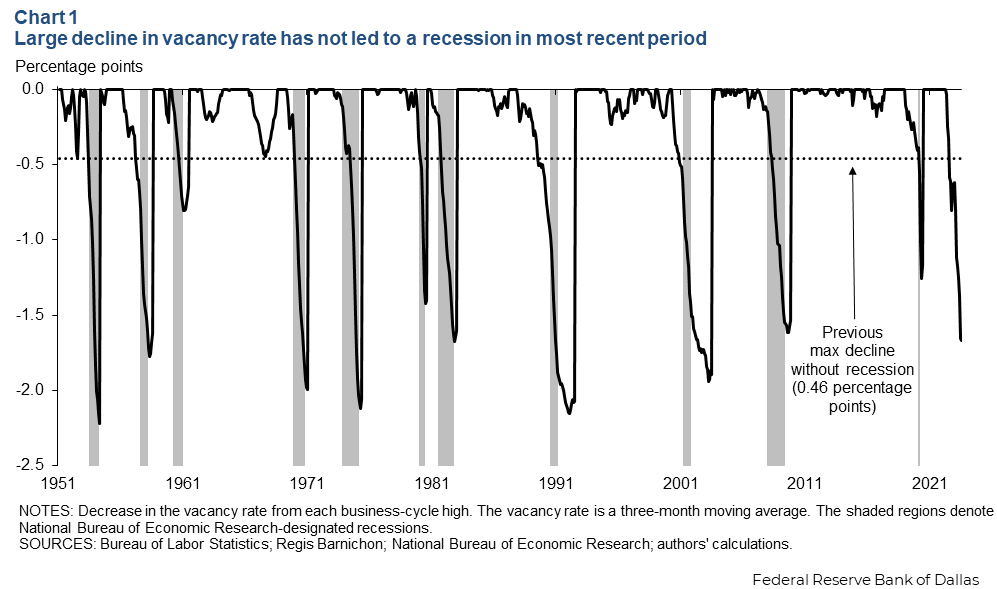
Any decline in the vacancy rate exceeding 0.5 percentage points was associated with a recession in prepandemic times. The current decline in the vacancy rate is now more than three times that threshold. Many other indicators of labor market tightness, such as the quits rate (total quits as a share of employment) or surveys of households on job availability, show a similar or greater degree of cooling in the labor market.
Why this labor market ‘de-tightening’ cycle differs from historical precedent
Last July, an influential FEDS Notes article by economist Andrew Figura and Federal Reserve Governor Chris Waller (“What does the Beveridge curve tell us about the likelihood of a soft landing?”) argued that a soft landing was possible because of the unprecedented level of labor market tightness. As the labor market slowed, businesses could reduce their job postings instead of resorting to layoffs. Under this hypothesis, the vacancy rate would return to its prepandemic level without much increase in the unemployment rate, achieving a soft landing.
The Beveridge curve—the relationship between vacancy and unemployment rates—provides a more formal illustration. Chart 2 plots vacancy and unemployment rates since 2001, the first year of the JOLTS survey. Over the business cycles from 2001 to 2007 and from 2008 to 2019 there was a clear negative relationship.
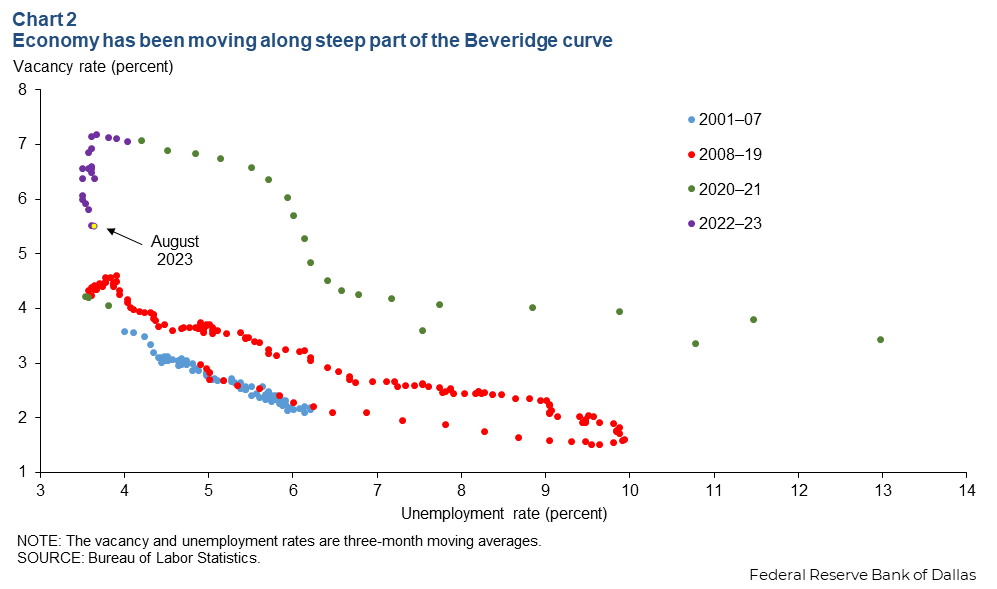
As the vacancy rate declined, the unemployment rate rose. During the 2020 and 2021 pandemic years, this relationship largely remained intact, except with the curve shifting to the right because the special circumstances of the pandemic made hiring more difficult given any level of vacancies.
Since early 2022, however, the curve appears to have been completely vertical. With vacancies at an unprecedented level, the economy has been able to move along the steep portion of the Beveridge curve and reduce the vacancy rate without a simultaneous increase in the unemployment rate, consistent with the Figura-Waller hypothesis.
The latest vacancy-unemployment rate pair, in August 2023, is approaching the top end of the prepandemic Beveridge curves. This shows the labor market could be nearing a flatter portion of the Beveridge curve, where a more normal tradeoff should reemerge.
Given the unusual nature of this business cycle, there is uncertainty about what vacancy rate threshold will trigger an increase in the unemployment rate, and once that occurs, whether the tradeoff will look similar to past de-tightening cycles.
A theory of recent unemployment dynamics and prospects for a soft landing
Central to the Figura-Waller expectation of moving down a steep Beveridge curve was an assumption that job separations (transitions from employment to unemployment) would remain historically low. An increase in separations would tend to shift the Beveridge curve out, resulting in a higher unemployment rate for any vacancy rate.
In early 2022, expecting the separation rate to remain low as vacancies fell wasn’t a given. There is typically a strong negative relationship between job separation rates and vacancy rates.
The red line in Chart 3 shows the fitted values from regressing the separation rate on an intercept, a time trend and the vacancy rate from 2001 through 2019. Since the pandemic, the relationship has broken down, as shown by the large gap between the red and blue lines since 2020.
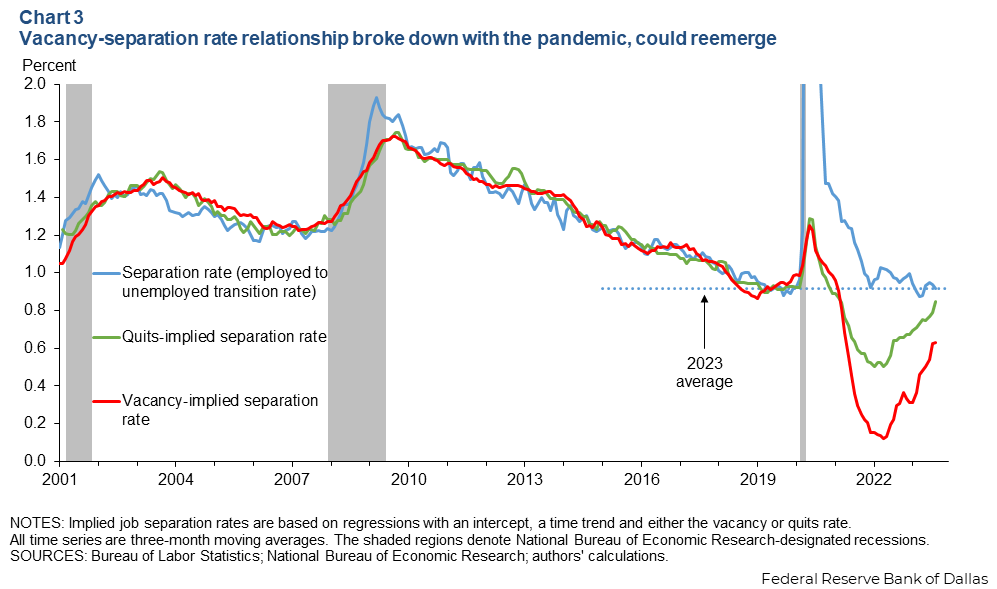
As the economy reopened following pandemic-induced business closures, labor demand was incredibly strong. Vacancies rose sharply and significantly exceeded their 2019 levels. Based on the historical relationship, this would normally lead to a sharp decrease in job separations, below 2019 levels.
However, separations may have hit a lower bound, as there is likely a minimum number of layoffs and turnover into unemployment that always occurs in the labor market regardless of the degree of labor demand. Under this theory, job separations would appear roughly constant, as has been the case this year, until vacancies decline to a point where the constraint is no longer binding.
The latest vacancy-implied separation rate remains below the 2023 average rate. This indicates that the threshold has not been surpassed, and some further cooling of the labor market is possible without rising unemployment. If vacancies continue to fall and the threshold is surpassed, the unemployment rate would likely rise.
At the pace of decline over the past 12 months, the risks of a hard landing appear low, as the threshold would not be exceeded until mid-2024. However, the degree of labor market tightness is uncertain and may not be well-captured by job openings. Other indicators, like the quits rate, have shown significantly more cooling and are approaching levels similar to 2019.
If labor market conditions are more accurately captured by the quits rate, then only a modest degree of additional cooling is likely needed before normal relationships and rising job separations reemerge, as shown in the green line in Chart 3.
Implications for the runway ahead
The cooling of the labor market and overall economy thus far has been almost costless in terms of higher unemployment, leading to a highly unusual business cycle. An important driver of this pattern may have been an unusually steady separation rate, roughly constant at a low level despite a significant rise and fall in labor market tightness.
Despite this good news, the economy needs to “land” before it can be definitively characterized as a soft landing. Stabilizing at a still-overheated labor market is likely inconsistent with achieving the Fed’s target of 2 percent inflation in a timely and sustainable manner.
Optimistically, some more cooling appears possible without higher unemployment. However, a normalized labor market likely entails a more-usual relationship between layoffs and labor market tightness indicators, and sooner or later, a higher unemployment rate.
About the authors

Tyler Atkinson is a senior business economist in the Research Department at the Federal Reserve Bank of Dallas.

Alexander W. Richter is a an economic policy advisor and senior economist in the Research Department at the Federal Reserve Bank of Dallas.
The views expressed are those of the authors and should not be attributed to the Federal Reserve Bank of Dallas or the Federal Reserve System.


