Texas among states feeling most stressed by inflation
Texas is known for its relatively low cost of living, a characteristic that has attracted a large inflow of new residents, especially from coastal U.S. states during the pandemic. However, as consumer prices have since climbed at a faster rate in Texas and surrounding states than nationally—food and shelter increasing even more—Texans are feeling especially stressed about rising prices.
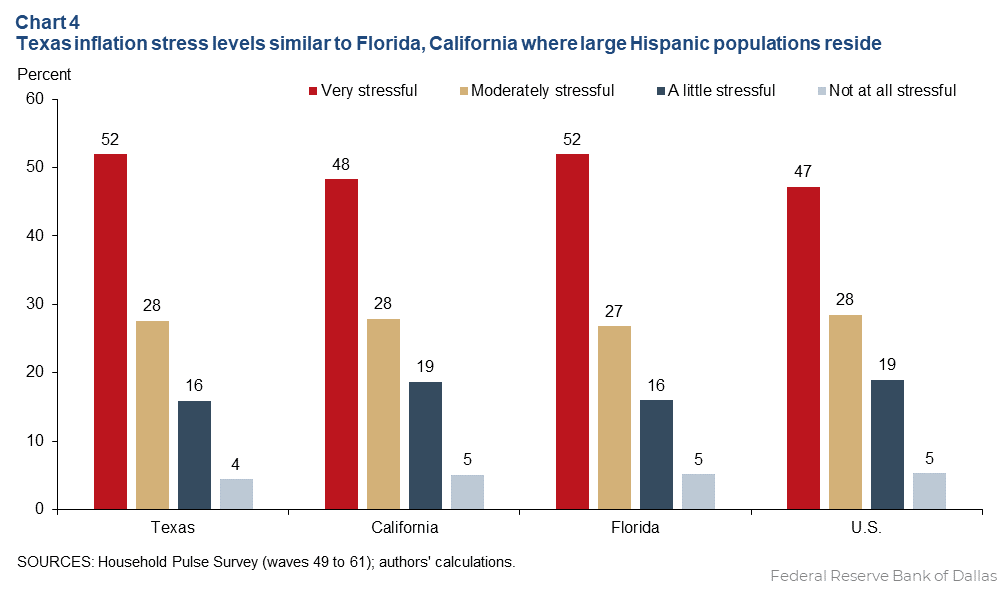
Specifically, 52 percent are highly stressed about inflation compared with 47 percent of residents nationwide. Low- and moderate-income and minority households feel most stressed.
Household Pulse Survey measures pandemic-era indicators
The Census Bureau’s Household Pulse Survey (HPS), a periodic questionnaire launched at the beginning of the pandemic, gathers data on how households have been affected by inflation along with other key indicators such as employment, difficulty paying expenses, food sufficiency, housing and childcare availability.
Over the past year, respondents were asked whether they experienced rising prices (the vast majority said they had) and, if so, how stressed they felt about inflation.
Our analysis relies on HPS data from survey waves 49 (September 2022) to 61 (September 2023). In an earlier analysis, we relied on the first three survey waves and focused on the U.S. rather than Texas. Data from the additional waves confirm that high inflation disproportionately hurts low-income households and is especially felt among Black and Hispanic households and renters.
Moreover, the recent HPS data show that the level of concern and stress about inflation has remained high, even though consumer price index (CPI) inflation has moderated from an annual rate of 8.2 percent in September 2022 to 3.7 percent in September 2023.
Texas among top states for high inflation stress
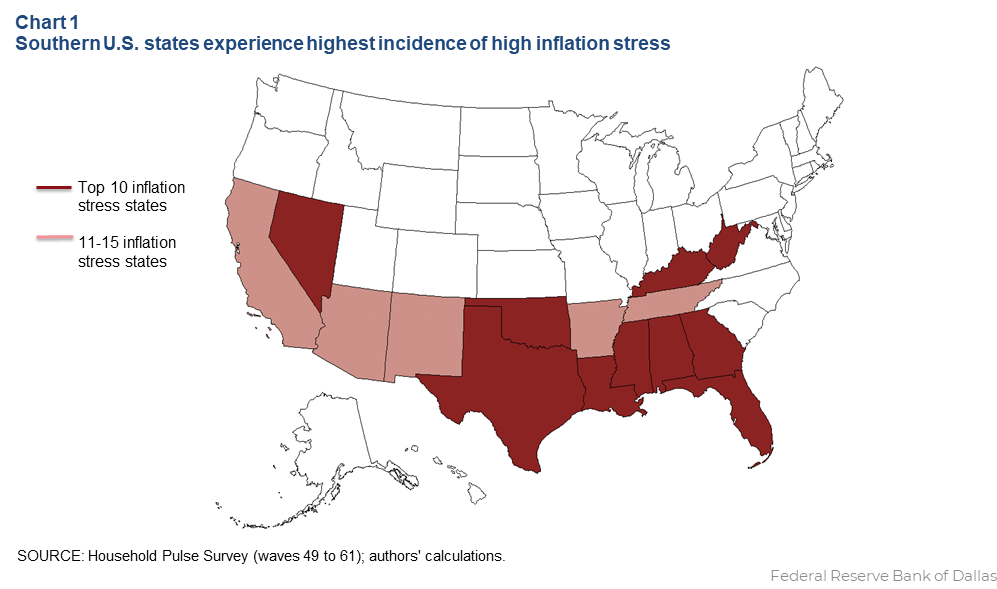
Texas, with 52 percent of the population reporting high inflation stress, ranks sixth, while Mississippi (57 percent) leads, followed by Louisiana (55 percent) and Alabama (53 percent). Lowest rates of inflation stress rates were in the District of Columbia (30.3 percent), Minnesota (36.4 percent) and Vermont (36.9 percent).
Two reasons the incidence of inflation stress is elevated in Texas: The prices of necessities such as food and shelter rose at a somewhat faster pace in the state, and more people live below the poverty level in Texas.
Geographic differences in the incidence of inflation stress are notable (Table 1).
| Table 1: High inflation stress shown by region, census division | |||
| Region | High inflation stress (%) | Census division | High inflation stress (%) |
| Northeast | 45.5 | New England Mid Atlantic | 42.1 46.8 |
| Midwest | 44.2 | East North Central West North Central | 45.1 42.0 |
| South | 50.2 | South Atlantic East South Central West South Central | 48.8 51.9 52.4 |
| West | 46.7 | Mountain Pacific | 46.9 46.6 |
| U.S. | 47.3 | 47.3 | |
| SOURCES: Household Pulse Survey, waves 49 to 61; authors’ calculations. | |||
Southern states have the highest incidence of inflation stress. The top 15 states are adjacent to one another, and most are in the South.

Historically, poverty rates are higher in southern states than in northern states. Given that income is the main driver of inflation stress, which we described in our previous article, it follows that the rising costs of basic necessities is more stressful for people living in poorer states.
Food, shelter inflation become especially important
Inflation remains stubbornly high, and prices remain elevated for everyday necessities in particular. Over the past two-and-a-half years, food and shelter prices rose at a higher rate than overall prices. These increases especially hit the pockets of low- and middle-income families, who spend a larger share of their income on essentials such as food and housing.
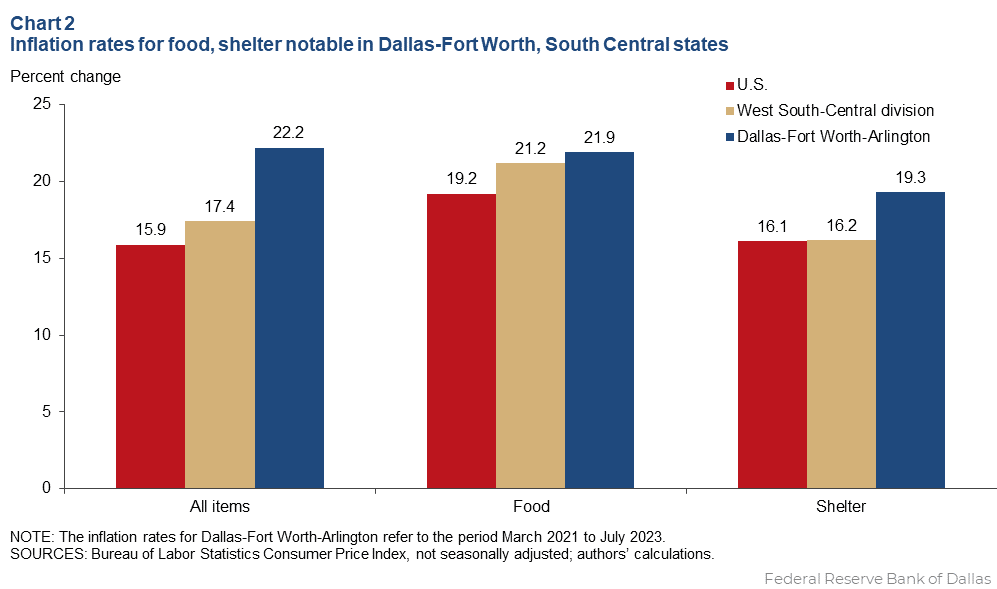
Texans face more budgeting pressure relative to the average U.S. resident despite the state’s historically low cost of living. Food and shelter price increases in the West South Central region—Texas, Oklahoma, Louisiana and Arkansas—have outpaced inflation nationally (Chart 2). Price increases have been even higher in the Dallas-Fort Worth metro area.

While inflation has slowly eased over the past year, the share of Texans who report feeling very stressed about inflation has changed little, consistently remaining above 50 percent. Inflation hasn’t cooled enough, and earnings haven’t risen enough, to reduce the stress households face.
Low-income Texas households feel heightened inflation stress
We analyzed the predictors of high inflation stress in Texas—income, household size, race and ethnicity, and housing tenure, etc.—and found the predictors are almost identical for Texas and the U.S. Low household income is the primary determinant of whether households are stressed by inflation.
Hispanic and Black families are also more likely to feel high inflation stress than other groups, as are renters and larger families. Texas households were 3 percentage points more likely to feel very stressed by inflation for each additional adult and 4 percentage points for each additional child. However, holding race, age, housing tenure, household size and other factors constant, low income is the key driver.
Despite the relatively lower cost of living in Texas than other states, the incidence of inflation stress in Texas is slightly higher across every income bracket. For example, 67.9 percent of Texas households earning less than $25,000 and 61.2 percent of those earning between $25,000 to $35,000 reported high inflation stress. Nationally, 66.2 percent households earning less than $25,000 annually and 60.6 percent of those earning between $25,000 to $35,000 reported high inflation stress.
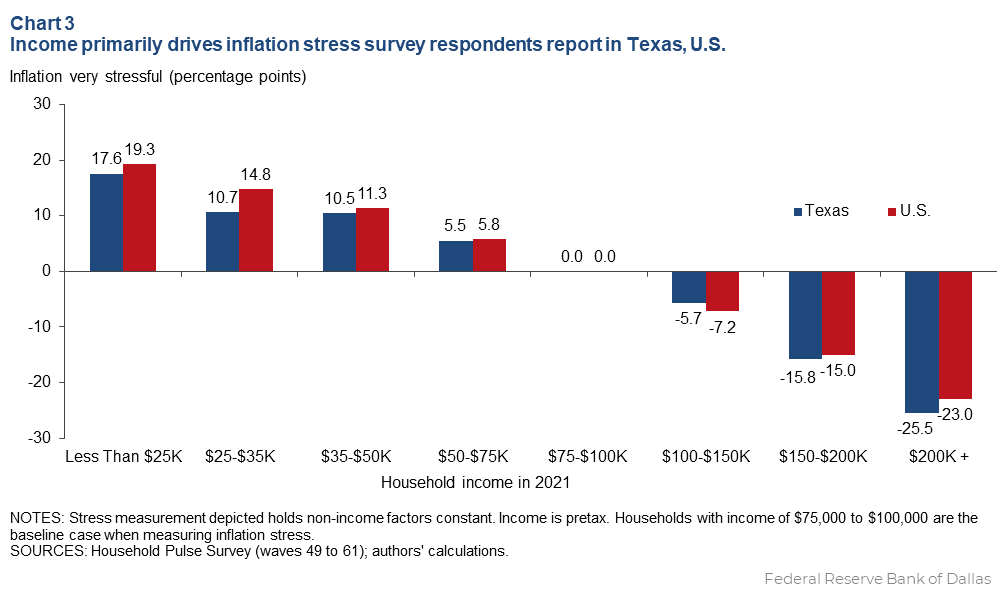
However, the marginal effect of being in a low-income bracket—the estimated impact of income on the probability of reporting high inflation stress (holding non-income factors constant)—is slightly lower in Texas than nationally.
Thus, Texas households earning less than $25,000 were 17.6 percentage points more likely to report high inflation stress than households earning $75,000 to $100,000 (Chart 3). Nationally, the marginal impact was a 19.3 percentage-points differential. The bottom line: A lower of cost of living does not shield Texans, especially low-income households, from the stress of high inflation.

Hispanics more likely to feel impact of high inflation
Texas’s racial and ethnic mix is also a predictor of inflation stress. Hispanic people make up 40 percent of the Texas population. Holding other factors such as income constant, Hispanic residents were 2 percentage points more likely to report high inflation stress than non-Hispanic white people. While Hispanic individuals residing outside of Texas are also more likely to experience inflation stress, they comprise just less than 19 percent of the U.S. population.
To examine how Texas compares to the rest of the country, we analyzed Florida and California, with similarly large Hispanic populations. Both states are experiencing greater inflation stress than the average state. In Florida, 52 percent residents are very stressed by inflation; in California, 48 percent were similarly stressed (Chart 4).

Of the six states with the highest Hispanic population shares—New Mexico, Texas, California, Arizona, Nevada and Florida—three are among the top 10 inflation stress states, and all are among the top 15.
Vulnerable groups more exposed as pandemic-era support programs end
During the pandemic, the federal government created new assistance programs and expanded existing ones. They included mortgage forbearance for homeowners and eviction moratorium policies for renters. Families also received stimulus cash payments, enhanced child tax credits and expanded unemployment benefits.
These benefits have largely ended. For example, many student loan borrowers who were able to pause monthly loan payments restarted them in October. Thus, financial pressures may increase for some Texas groups, including low-income and Hispanic households. Groups such as these are particularly exposed to inflation, which remains elevated relative to before the pandemic.
About the authors
The views expressed are those of the authors and should not be attributed to the Federal Reserve Bank of Dallas or the Federal Reserve System.


