
Korea, Japan growth experiences suggest China’s economy to slow in next 20 years
The Chinese economy has grown at an unprecedented pace since the 1980s, gaining importance globally, particularly after the country joined the World Trade Organization in 2001. However, the pace of growth is likely to slow as China’s economy matures because of its demographic structure and its increasing proximity to economic and technological frontiers.
Additionally, China may face more significant headwinds than would be typically expected. Notably, the country’s growth in total factor productivity (TFP)—the efficiency of production—the largest contributor to China’s growth, has steadily declined since 2000. This trend is projected to continue over the next decade and beyond.
The size of the working-age population has also declined—a product of China’s one-child policy—at the same time the youth unemployment rate has sharply increased. Massive investment in the real estate sector, which had bolstered growth in recent years, has recently tailed off and is not expected to be a major source of future expansion. These developments and the expected slowdown in TFP will negatively and substantially impact China’s aggregate output.
Decomposing per capita GDP
Consensus Economics reported that China’s GDP should grow 5.0 percent in 2023 before decreasing to an annual average of 3.8 percent over the next decade. These estimates, released in October, are considerably lower than the 7.8 percent average annual per capita growth rate over the previous two decades. Such a change in output is likely to present challenges for the global economy and the U.S. economy.
To supplement the forecasts that predict China’s growth, we use a growth accounting framework that allows examination of key factors that will alter China’s growth path. We begin with the growth accounting framework proposed by economists Timothy Kehoe and Edward Prescott and modify it to include the fraction of the population that is of working age. With that modification, we can decompose GDP per capita into the product of four terms:
- A TFP factor that increases with technological change, which raises the productivity of the economy’s capital and labor.
- A capital-to-output factor, which increases with the ratio of the economy’s capital stock relative to GDP.
- The hours-to-working-age-population ratio, which measures total number of hours worked per member of the economy’s working-age population.
- The working-age-population-ratio, which is the share of the overall population that is of working age (ages 15–64).
Cross-country comparisons become easier using a per capita output measure. China’s current GDP per capita indicates it is a middle-income country. Crucial to its outlook, China needs to avoid becoming caught in the middle-income trap. This occurs when countries develop from low-income to middle-income due to some comparative advantage—in China’s case, abundant labor and natural resources—but never properly reform to allow a transition to high income.
The World Bank classifies 108 countries as middle income. In addition to China, the list includes Brazil, Mexico and India.
Notably, Korea and Japan, which escaped the middle-income trap, each experienced swift growth as they moved from low to middle income. Then, as they transitioned from middle to high income, they each experienced drops in the working-age share of population and slower productivity growth.
We use the experiences of Korea and Japan to project a best-case scenario for China’s growth over the next two decades. The procedure is simple and extends a similar exercise undertaken by Federal Reserve Bank of Dallas economist Kei-Mu Yi.
We plot the 10-year-forward average growth in the TFP factor on GDP per capita relative to the U.S., the 10-year-forward average growth of the capital-to-output factor on the capital-to-output ratio, and the 10-year-forward average growth of the hours-to-working-age population ratio on the hours-to-working-age-population ratio. (The 10-year-forward average growth is defined as the geometric mean of annual growth rates over a rolling 10-year period.)
Using these plots, we predict the 10-year-forward average growth of each factor/ratio for China in 2022, yielding the average growth over the next decade. Rather than using a similar procedure for the working-age share of the population, we use projections from the United Nations. We then combine the growth rates of the four factors to yield an anticipated average growth in China’s GDP per capita over the next 10 years. Using these 10-year-forward projections, we predict the level of these factors in 2032 and repeat the experiment to find average growth for 2032–41.
Graphic depictions shed light on China’s future
Chart 1 depicts the relationship between GDP per capita relative to the U.S. and the 10-year-forward average TFP factor growth. Each point on the graph shows the average growth rate of the TFP factor in the 10 years after a country attains a given level of GDP per capita relative to the U.S.
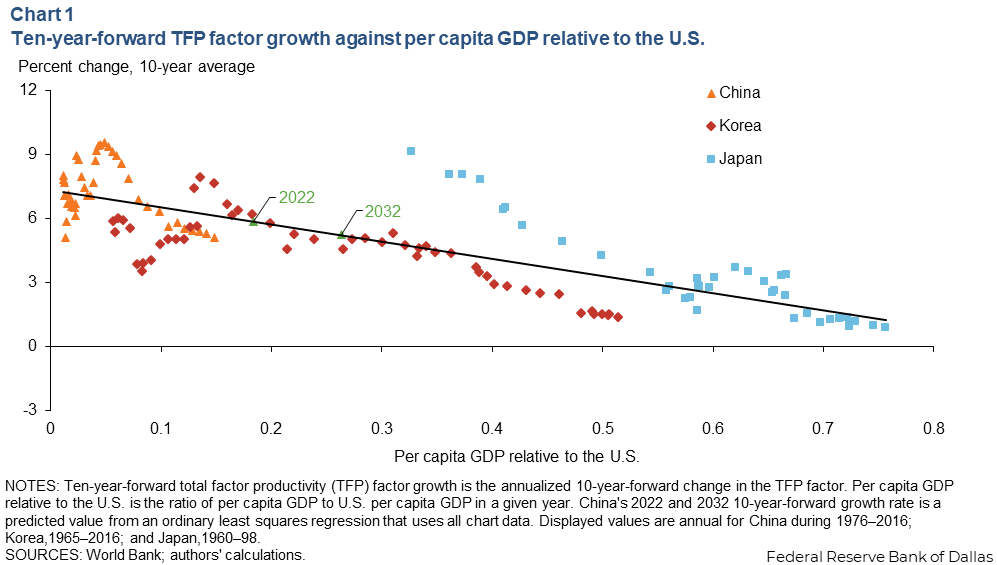
The relationship is downward sloping. Intuitively, when countries are early in their development (corresponding to the left side of the chart) their productivity growth tends to be high as they are in the “catch-up” phase of their development, adopting preexisting blueprints and technologies.
However, as they move to the right side of the chart, they are closer to the technological frontier, which makes it harder for productivity to grow at high rates. Based on the previous experience of China and that of Korea and Japan, China’s TFP factor is predicted to grow at 5.9 percent over the next 10 years and 5.2 percent in the following 10 years, well above the current trend.
Chart 2 shows the downward-sloping relationship between the capital-to-output ratio and the 10-year-forward average capital-to-output factor growth. The Solow growth model provides the intuition behind this relationship. A consequence of the model is that countries with scarce capital tend to experience higher returns on investment in capital, leading to capital deepening, while countries with abundant capital tend to see smaller returns on capital, leading to capital shallowing.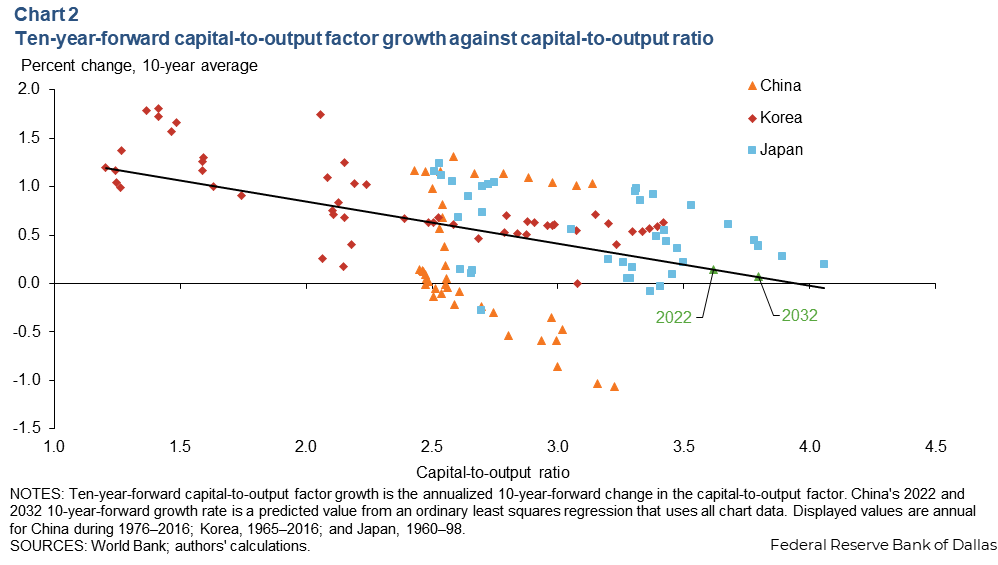
In 2022, China is relatively capital abundant, so it should not expect to experience much growth in the capital-to-output factor. With China’s predicted average annual growth that is due to growth in the capital-to-output ratio at just 0.14 percent over the next 10 years and only 0.07 percent in the following 10 years, continuing investment in capital is unlikely to boost China’s overall growth in the next decade.
Chart 3 shows the downward-sloping relationship between hours per working-age person and 10-year-forward average growth in hours per working-age person. The relationship is downward sloping for a reason similar to the explanation for the capital-to-output factor. When hours worked per working-age person are high, there is not much scope for further increases since the average worker is already working many hours, and/or labor force participation is already high.
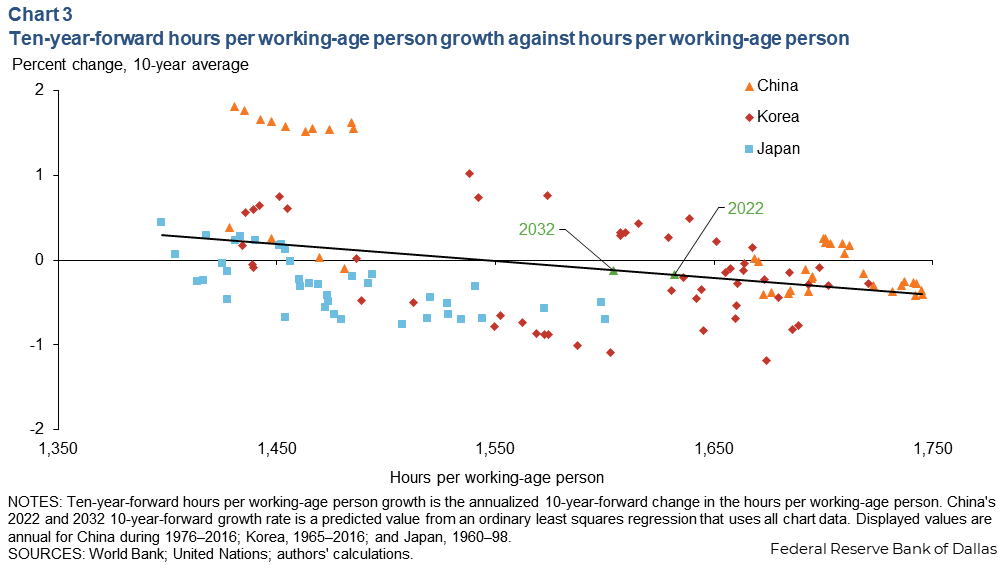
Conversely, when hours per working-age person are low, there is not much room for further reductions. Furthermore, in Korea and Japan, hours per working-age person were high early in their development but decreased as workers became more skilled and could prioritize leisure. Automation and new efficiencies in manufacturing also likely facilitated this change.
The combined experiences of China, Japan and Korea produce the downward-sloping relationship, although not as tightly as in the previous two charts. From this chart, we can forecast that the hours per working-age person will decrease in China over the next 10 years by about 0.17 percent and by about 0.12 percent in the following 10 years, though hours per working-age person decreased at a sharper rate in China recently. While much smaller than the growth contribution of TFP, declining growth in hours per working-age person impedes China’s output growth.
Additionally, we project that the working-age population ratio will decrease by 0.13 percent per year over the next decade and by 0.93 percent per year from 2032–41, based on United Nations estimates.
Taking these four estimates together, China’s GDP per capita growth is expected to trend at 5.7 percent over the next 10 years and just 4.2 percent for 2032–41.
Chart 4 shows China’s predicted growth broken down by factor/ratio contribution and compares the level of growth to prior decades. China’s growth should continue to outpace the U.S. and many other advanced economies. However, it would be sharply slower than the 7.8 percent average growth over the past 20 years.
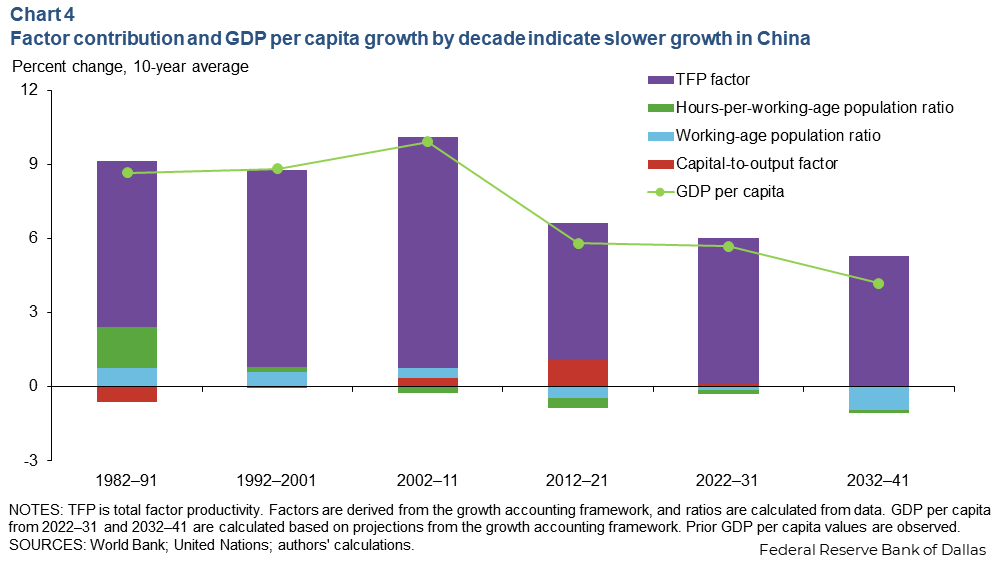
To be precise, these estimates should be thought of as an upper-bound estimate. By projecting China’s growth using the experiences of Korea and Japan, we are implicitly assuming that China will adopt strategies and policies that bring about a seamless transition from a middle- to high-income country. Thus, China is likely to experience even slower growth in the absence of continued reforms.
Korea’s and Japan’s jump from middle income to high income meant transitioning from being primarily industrial exporters to innovation and service-based economies. China has laid some of the groundwork for making this transition, such as investing heavily in higher education and building sufficient infrastructure. Both are necessary conditions for becoming a high-income country.
However, China has thus far maintained restrictions on foreign investment and been slow to transition from a heavy reliance on manufacturing exports. Immense investment in real estate and infrastructure has led to a tipping point in the Chinese real estate sector.
Moreover, the inefficient financial sector presents challenges for securing necessary funding to build a more innovative and consumption- and service-based economy. China has work to do if it aims to become a high-income country.
About the authors

Sewon Hur is a senior research economist in the Research Department at the Federal Reserve Bank of Dallas.

Braden Strackman is a research analyst in the Research Department at the Federal Reserve Bank of Dallas.
The views expressed are those of the authors and should not be attributed to the Federal Reserve Bank of Dallas or the Federal Reserve System.

