Accounting for interest rate risk: Matching Fed assets to liabilities
The Fed does not seek to maximize profit. Rather, the Fed uses its balance sheet to advance its public mission, particularly the monetary policy dual mandate of maximum employment and stable prices.
The Fed also does not have a for-profit bank’s need to avoid losses. The Fed’s main liabilities, bank reserves and currency, are redeemable only with these same liabilities, which the Fed itself creates. Unlike a commercial bank, the Fed doesn’t face the risk of being unable to pay its debts. Additionally, the Fed remits its net income to the U.S. Treasury and over time intends to hold primarily Treasury securities. That means on the consolidated balance sheet of the public sector, gains or losses on Treasuries in the Fed’s asset portfolio are offset by economic losses or gains on the U.S. Treasury’s liabilities.
Even though the Fed doesn’t seek profit, the volatility of income from its balance sheet can complicate its communications. Some policymakers and others have suggested mitigating this challenge by matching the duration of the Fed’s assets to that of its liabilities, not unlike approaches used by commercial banks and other for-profit financial institutions.
In a recent working paper, we investigated what such a matching would entail and what consequences the associated investment strategies might have for the volatility of income and mark-to-market valuations. However, we emphasize that minimizing volatility of income or mark-to-market valuations is likely not the only or the most important objective for the balance sheet, given the Fed’s public policy mission.
Bank asset management seeks to match liability risk characteristics
The basic idea behind traditional bank asset-liability management is to match the most important risk characteristics of a bank’s assets with the corresponding characteristics of its liabilities. That way, the bank will have sufficient assets to meet its liabilities across a range of contingencies. At a high level, the risk characteristic most relevant to the Fed is interest rate risk. Matching the interest rate risk of assets to that of liabilities could mitigate the potential for interest rate swings to cause large losses.
A financial instrument’s interest rate risk is frequently described in terms of the instrument’s duration. Loosely speaking, duration represents the average time over which the instrument will pay its cash flows. (In fact, this is the precise definition of the Macaulay measure of duration.) If an instrument’s cash flows will arrive in the more distant future, their present value is more responsive to interest rate changes. The modified duration of a financial instrument measures this sensitivity. Therefore, we explore the notion of matching the duration risk in the Fed’s assets to that in its liabilities.
Examining the duration of Fed liabilities
Among the Fed’s main liabilities are reserves held by banks and balances in the Fed’s reverse repurchase agreement (reverse repo) facilities, available to counterparties such as government-sponsored enterprises, money market mutual funds and foreign central banks.
Liabilities also include currency in circulation and the Treasury general account, which the U.S. Treasury uses to make federal expenditures and receive revenue. Together, these four items account for 99 percent of current liabilities and have accounted for about 95 percent of total liabilities on average for more than two decades (Chart 1).
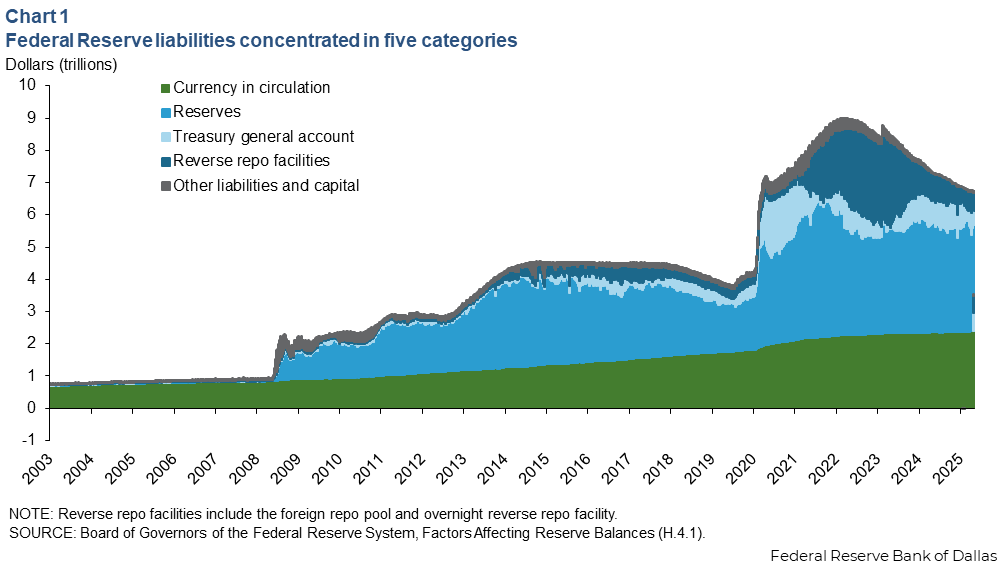
In an accounting sense, liabilities carry no interest rate risk. They appear at par value on the balance sheet. But in a financial sense, some liabilities possess interest rate risk. This risk arises because any liability may be used to pay for an investment in assets that pay a market interest rate.
Currency provides a straightforward example. Currency does not bear interest. If the Fed invests the proceeds of currency issuance in interest-bearing assets, it earns a spread equal to the market interest rate. The value of these earnings rises with market interest rates. Moreover, because currency in the aggregate almost never returns to the Fed once issued, the Fed can receive these earnings for a very long time.
If nominal short-term rates average 3 percent (the median long-run projection for the federal funds rate in the Federal Open Market Committee’s June 2025 Summary of Economic Projections), each $1 trillion in currency in circulation represents about $610 billion in additional economic present value over a 30-year horizon. The additional economic value rises to $720 billion if the average of overnight interest rates is closer to 4 percent.
In the $2.4 trillion of currency outstanding as of early June 2025, we estimate the interest rate duration risk equals the duration risk in about $3.4 trillion of 10-year Treasuries.
The present value to the Fed from outstanding currency in circulation, over a 30-year horizon, is more than $1.6 trillion (Chart 2). This represents an increase in the economic value of currency to the Fed of more than $1 trillion over the past four years, with 70 percent of that attributable to the rise in interest rates and the rest to growth in currency outstanding.
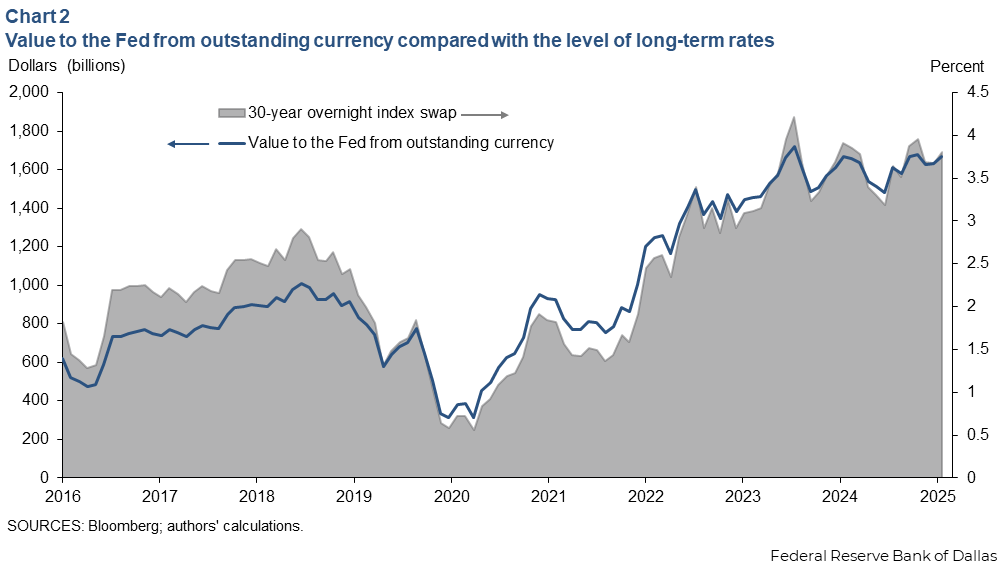
By comparison, the Fed had $1.06 trillion of mark-to-market unrealized losses on its asset holdings at the end of 2024. In other words, the rise in economic value of the Fed’s liabilities has fully offset mark-to-market unrealized losses on the Fed’s asset portfolio. However, while unrealized losses on assets are reported on the Fed’s financial statements, the mark-to-market value of liabilities is less visible because it is not reported under the Fed’s accounting conventions.
Our calculation of currency’s interest rate risk treats currency as having a 30-year lifetime, consistent with historical evidence that U.S. currency demand is highly persistent and varies little with interest rates. If currency demand became more sensitive to interest rates or were to decline in response to the development of novel payments technologies such as stablecoin, currency’s duration would be lower.
In contrast to currency, reserves and reverse repo balances pay floating interest rates. Those interest rates, in the Fed’s ample-reserves monetary policy implementation regime, are close to market rates. The economic value of reserves and reverse repo balances is therefore par regardless of changes in market interest rates, meaning these liabilities create no interest rate risk.
The Treasury general account presents an intermediate case. On the one hand, like currency, this account does not pay interest. The Treasury has said it plans over time to hold a buffer in the account equal to five days of expected outflows, so this liability could be viewed as long-lived. However, on the other hand, over short horizons, the account can be highly volatile, which could motivate viewing this liability as one with a short duration.
How liabilities’ durations affect Fed finances
Floating-rate liabilities with zero duration and long-lived, non-interest-bearing liabilities have distinct implications for the Fed’s income and balance sheet over time.
Floating-rate liabilities will cause the Fed’s interest expense to vary. If variation in interest income on the Fed’s assets does not offset the variation in interest expense, the Fed’s net income will also fluctuate.
By contrast, long-lived, non-interest-bearing liabilities do not create any variability in interest expense. The Fed can minimize the volatility of the net income associated with these liabilities by backing them with assets that lock in fixed interest rates for a long time, that is, long-duration assets.
From the perspective of mark-to-market valuations, the implications are the opposite. The Fed’s accounting rules do not call for marking assets or liabilities to market at current prices. Rather, liabilities are shown on the Fed’s financial statements at par and assets at amortized cost, similar to the accounting framework used by commercial banks. Neither floating-rate nor long-duration liabilities affects the accounting value of the balance sheet under this convention. Nevertheless, the mark-to-market value of assets can easily be computed and is shown in the notes to the Fed’s statements; the mark-to-market value of liabilities can similarly be computed.
Floating-rate liabilities’ economic value does not depend on interest rates, so their mark-to-market value is constant. Backing these liabilities with floating-rate assets, whose market value is also stable, will limit net mark-to-market volatility on this part of the Fed’s balance sheet.
Long-lived liabilities’ economic value varies with interest rates. Backing these liabilities with long-duration assets whose value varies similarly will limit net mark-to-market volatility.
Putting together these ideas, the Fed can minimize both the volatility of its net income and the volatility of the net mark-to-market value of its balance sheet by backing floating-rate liabilities with floating-rate assets and long-duration liabilities with long-duration, fixed-rate assets.
While long-duration securities help offset the economic interest rate risk intrinsic to long-duration liabilities, such duration matching can have optical implications. A long-duration asset portfolio shows unrealized mark-to-market losses when rates rise. Currency in circulation, meanwhile, is always marked at par in the Fed’s quarterly financial statements. The economic value of currency in circulation to the Fed rises when rates rise, as shown in Chart 2. That change does not appear in the financial statements, however.
As a result, when dealing with long-duration liabilities, there is an optical trade-off between income volatility and mark-to-market volatility on the asset side of the balance sheet. Neutralizing interest rate risk from an economic perspective can result in reported mark-to-market (unrealized) losses on the asset side in a higher-rate environment.
To be sure, this trade-off is purely the optical effect of marking one side of the balance sheet to market but not the other. If both sides were marked to market, the balance sheet would accurately show that long-duration assets neutralize the interest rate risk in long-duration liabilities.
Asset portfolio models show trade-offs for various interest rate paths
Our working paper examines different combinations of assets and liabilities. To study the trade-offs among these combinations, we simulate the volatility of net income and mark-to-market valuations under a range of future interest rate paths reflecting the historical volatilities of interest rates at different maturity points and the correlations among them. We focus on portfolios of Treasuries in light of the Federal Open Market Committee’s intention to primarily hold these securities in the long run.
We start by examining an asset portfolio funded only by currency (or, equivalently, the portion of the Fed’s assets held against currency). Chart 3 plots the Fed’s net income volatility, the mark-to-market volatility of assets, and the net mark-to-market volatility of assets minus liabilities for five different benchmark asset portfolios.
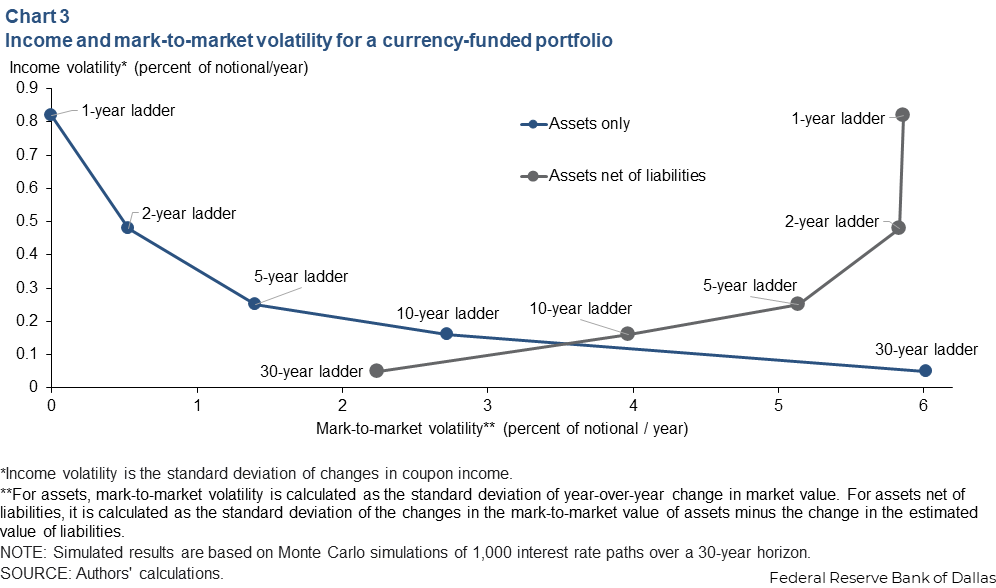
Each asset portfolio is a rolling ladder of securities. For example, the five-year ladder distributes the amount to be invested equally among Treasury securities with up to five years to maturity. In each year of the simulation, one-fifth of these securities mature, and the proceeds are reinvested in a new five-year Treasury.
We create the one-, two-, 10- and 30-year ladders similarly. Because the longest-duration Treasury securities issued are 30-year bonds, the 30-year ladder represents the longest duration asset portfolio the Fed could have if it holds all assets to maturity.
Increasing the average duration of assets beyond that of the 30-year ladder would require selling seasoned securities before they mature and replacing them with newly issued ones of longer duration. Historically, the Fed has largely avoided such active sales and purchases to reduce transaction costs and its footprint in markets.
As the chart shows, for a portfolio funded by currency, the 30-year ladder minimizes both the volatility of net income and the net mark-to-market volatility of assets minus liabilities. This result is as expected because long-duration assets have less volatile income and more closely match the duration of currency. However, the 30-year ladder also has the highest mark-to-market volatility when considering the asset side of the balance sheet on its own, illustrating the trade-off between optical effects and risk matching.
Motivated by evidence that U.S. currency in circulation has been very sticky, our simulation models currency with a life of 30 years. That results in a modified duration exceeding the 9.7-year weighted average duration of the 30-year ladder, a reason why the 30-year ladder does not eliminate net mark-to-market volatility. However, holding assets with shorter duration could help hedge the risk that currency’s duration decreases, because of the growth of novel payment technologies, for example.
Moving to the opposite extreme on the liability side of the balance sheet, the case of a reserve-funded portfolio is straightforward. Our simulation confirms the volatilities of net income, mark-to-market values and values shown under accounting conventions are all minimized by backing floating-rate liabilities such as reserves with very short duration assets.
In practice (as illustrated in Chart 1), the Fed has a mix of floating-rate and long-duration liabilities. The exact mix in the long run is uncertain because it depends on future demand growth for currency, the amount of reserves needed for the Fed’s ample-reserves regime and whether the Treasury general account is treated as having long or short duration.
As a rough benchmark for the composition of the Fed’s liabilities over time, we consider a balance sheet funded 50 percent with currency and 50 percent with floating-rate liabilities such as reserves. This benchmark is similar to the projection in the New York Fed's most recent annual report on open market operations that reserves would reach a minimum in 2026 and equal 44 percent of the Fed's securities holdings at that time.
Chart 4 shows the income and mark-to-market volatility of various asset portfolios when the Fed’s liabilities are an equal mix of currency and floating-rate liabilities. In addition to the one-, two-, five-, 10- and 30-year ladders, we consider three additional asset portfolios. One is a barbell consisting of a 50-50 mix of the one- and 30-year ladders. The second is an across-the-curve portfolio that combines the five ladders in proportions to roughly match the universe of outstanding Treasuries. The third is a 50-50 mix of the one-year ladder and the across-the-curve portfolio; this portfolio effectively pairs reserves with low-duration assets and pairs currency with investments across the curve.
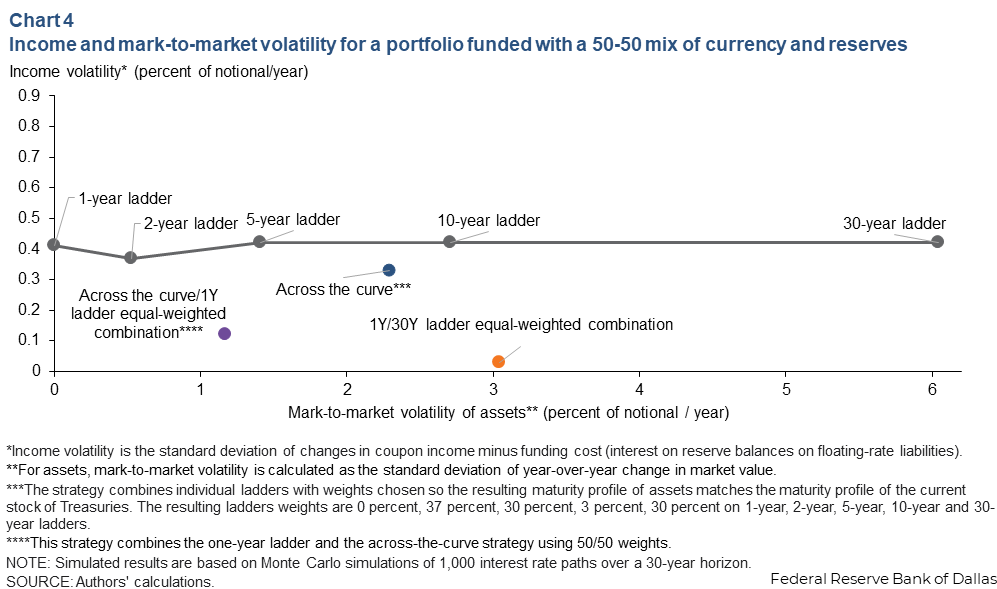
The barbell portfolio has by far the lowest net income volatility of these asset portfolios. This is because the two components of the asset barbell closely match the risks on the liability side of the balance sheet. The one-year ladder matches the floating-rate liabilities, and the 30-year ladder matches the currency liability. The mark-to-market volatility of asset value for the barbell is, unsurprisingly, halfway between that of the one-year and 30-year ladders. We do not show the mark-to-market volatility of assets net of liabilities, but this, too, is minimized for the barbell because assets closely match liabilities.
The individual ladders and the across-the-curve asset portfolio all have substantially higher net income volatility than the barbell. In particular, the across-the-curve portfolio and the 10-year ladder both have roughly the same weighted average duration as the barbell but produce much higher net income volatility. This difference arises because only the barbell precisely matches the year-to-year fluctuations in interest payments on reserves. In the other portfolios, the resetting of interest rates on liabilities matches the resetting of interest rates only on average over time—that is why the durations are similar—but not each year.
This finding produces an important insight: In managing the interest rate risk on the Fed’s balance sheet, it is not just the average duration of assets that matters, but the mix of durations that make up the average.
However, a pure barbell portfolio could be challenging to implement at scale. The Fed has $2.4 trillion of currency in circulation. Backing this liability with a 30-year ladder would require investing $2.4 trillion distributed equally across all maturities from one to 30 years.
While $2.4 trillion is about 10 percent of all Treasury coupon securities, the outstanding securities are concentrated at shorter maturities, and the Fed would end up owning a large share of the market at some maturities—around 40 percent of the 20- to 25-year sector, for example. Concentrated Fed holdings could challenge the market. Fortunately, an easier-to-implement across-the-curve portfolio can produce lower net income volatility than a similar duration ladder, although not by as much as a barbell, and with lower mark-to-market asset volatility than the barbell.
Other balance sheet considerations
Our analysis considers a long-run or steady state Fed balance sheet. On several occasions, though, the Fed has temporarily expanded its balance sheet through large-scale purchases of long-duration assets to provide monetary accommodation and support smooth market functioning. Large-scale asset purchases, which require backing newly created reserves with long-duration assets, necessarily generate at least a temporary mismatch between the durations of assets and liabilities.
Additionally, we have not investigated how the steady state composition of the Fed’s asset holdings might affect the shape of the yield curve and other asset prices. Such effects depend importantly on how the Treasury Department and other issuers adjust their debt issuance, if at all, in response to any changes in the Fed’s desired holdings.
About the authors

Hugo De Vere is a research analyst in the Research Department at the Federal Reserve Bank of Dallas.

Srini Ramaswamy is a senior financial economist in the Research Department at the Federal Reserve Bank of Dallas.

Sam Schulhofer-Wohl is senior vice president and senior advisor to the president of the Federal Reserve Bank of Dallas.