
Consumption concentration may be up, adding slightly to economic fragility
Analysts have taken notice of the large share of total U.S. spending attributable to the very highest earners. The concerns are that the emergence of K-shaped growth—bifurcated activity at an elevated rate among high earners and much more restrained among most others—may put the U.S. in greater economic peril.
The potential stability implications of such a trend are of clear interest to policymakers, beyond concern about the normative implications.
To quantify this trend, we constructed a measure of consumption concentration, the relative amount of consumption for which people at high income levels are responsible, over the past three decades. We then applied a macroeconomic model developed in prior research to assess how this concentration of consumption changes the economic outlook. Our results indicate that a moderate increase in consumption concentration has not noticeably increased fragility of the economy.
Consumption reflects growing concentration in net worth, income
Two measures of consumption concentration are particularly notable. The Bureau of Labor Statistics uses the joint distribution of disposable personal income and personal consumption expenditures from its Consumer Expenditure Surveys. The share of consumption by top earners has been stable since 2004, with the top 10 percent responsible for roughly 20 percent of consumption and the top 20 percent of earners responsible for 35 percent of consumption, according to this data.
A second measure comes from a Moody’s Analytics report that combines data on income shares and financial flows from the Federal Reserve’s Survey of Consumer Finances to estimate consumption concentration. This measure has trended upward and shows much higher estimates of consumption concentration, with the most recent estimate attributing 49 percent of spending to the top 10 percent of earners.
The Consumer Expenditure Surveys has underreported aggregate consumption and underestimated consumption concentration. We find the income share of the top 20 percent from the Consumer Expenditure Surveys sample is around 47 percent, much lower than the 60 percent share from the Fed’s Survey of Consumer Finances, which has better coverage of affluent households. As a result, the Consumer Expenditure Surveys may underestimate consumption concentration.
We thus follow Moody’s methodology to analyze the Survey of Consumer Finances. We use the survey to estimate the share of total disposable income going to the top 20 percent of earners. Similarly, we use the Fed's Distributional Financial Accounts for changes in net worth.
We combine these sources with the Bureau of Economic Analysis measure of total disposable personal income to create estimates of disposable income and savings to measure consumption for the top 20 percent of earners. We find that quintile is responsible for 57 percent of overall consumption on average from 2020 to the second quarter of 2025.
The approach differs from the Moody’s report by accounting for the tax liability of each household before calculating income shares. Because high earners pay relatively higher taxes, they account for a smaller share of disposable income than in the Moody’s estimates.
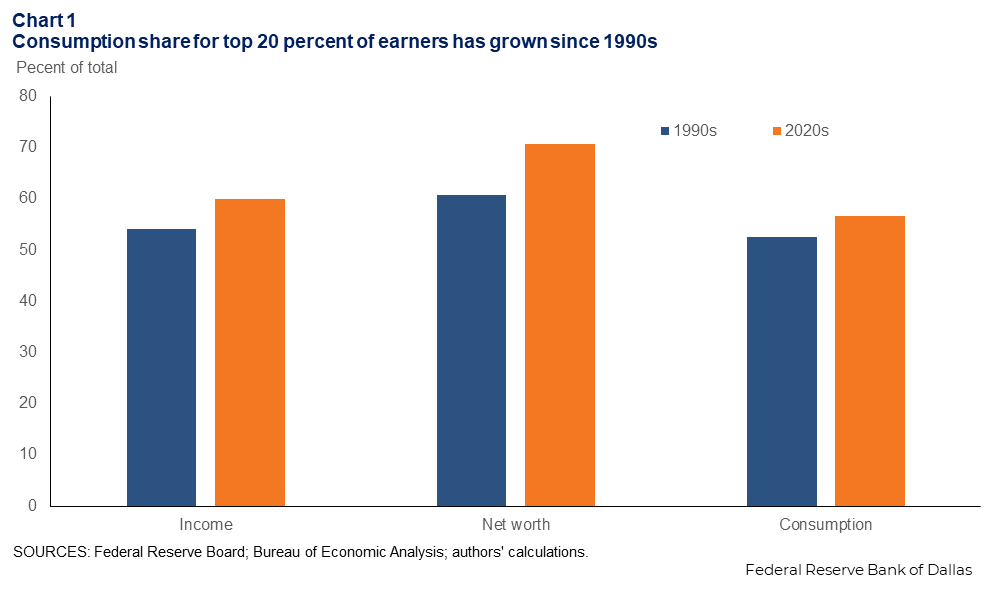
The top 20 percent of earners accounted for on average 54 percent of total earnings from 1990–99, increasing to an average of 60 percent from 2020 to mid-2025 (Chart 1). The fraction of aggregate wealth owned by the top 20 percent of earners rose from 61 percent to 71 percent over the same period. Consumption concentration grew less quickly, with the top 20 percent of earners’ share of total consumption moving from 53 percent to 57 percent.
Macro model determines future consumption
We apply data on households’ income and asset holdings from the Survey of Consumer Finances to a model developed in prior research. The model predicts households’ consumption and savings decisions over time in response to uncertain future earnings and captures how the key drivers of consumption differ by age, labor income and net worth. In addition to household characteristics, consumption and savings decisions are also affected by expectations of the future economic environment.
Applying the model to households in the 2022 Survey of Consumer Finances, we generate a simulated path of income, net worth and consumption for each household from 2023 to 2027. To capture the effects of rising concentration, we also solve a version using 1998 Survey of Consumer Finance data as a less concentrated economy for comparison.
Concentration increase alters impact of shocks; quantitative effects small
To assess whether K-shaped growth adds risks to the overall economy, we use the model to compare different risk scenarios to a benchmark outlook. In the benchmark scenario, we assume the economy grows on a normal path: Wages increase 1.2 percent annually and the number of households expands 0.8 percent annually. This generates a 2 percent annual rise in aggregate earnings.
We develop a series of scenarios to investigate the impact of mild adverse labor market outcomes on future aggregate consumption. In the initial scenario, the economy experiences no income growth in 2026 but recovers in 2027. In another scenario, the unemployment rate rises from 4 percent to 6 percent in 2026.
We then consider moderate adverse shocks to net worth, such as a stock market decline. Specifically, we assume the rate of return on assets is reduced from 4 percent to zero in 2026.
Finally, we consider a combination scenario in which the unemployment rate increases to 6 percent and the rate of return on assets is simultaneously reduced to zero.
These shocks are of similar magnitude to prior mild recessions, such as in 1991 and 2001. We conduct this exercise for both the high and low concentration versions of the model to quantify how increased concentration changes overall consumption in each scenario.
The impact on the economy of a labor market downturn from high unemployment is small, while the impact of low income growth is larger, though still modest (Chart 2). Unemployed households receive transfers from unemployment compensation and other federally provided social safety net programs, muting the impact of the unemployment shock on consumption. In the scenarios featuring a deterioration of the asset market, consumption drops drastically due to the implied large loss to lifetime wealth.
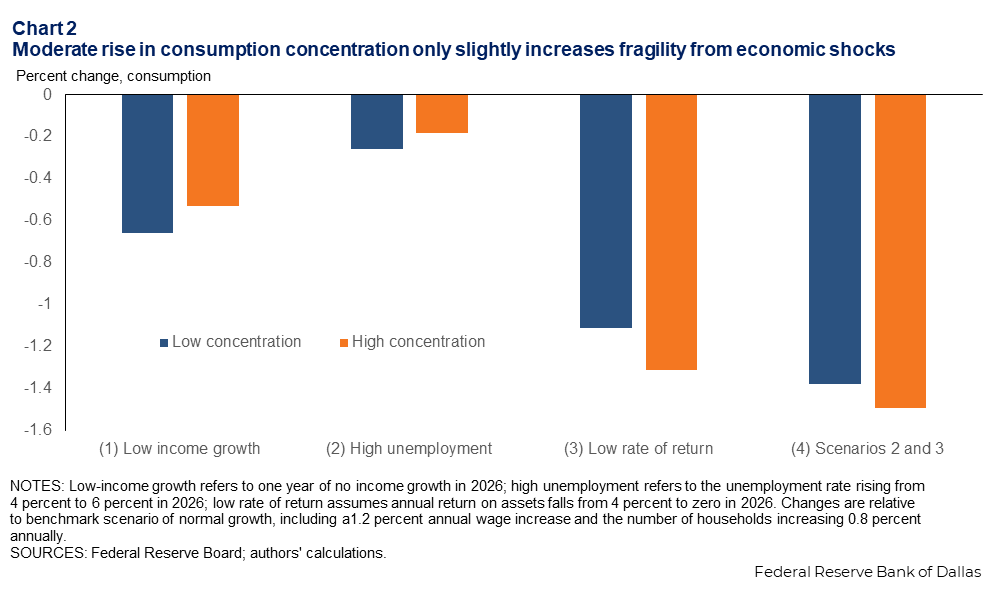
When the economy is more concentrated, labor market shocks cause smaller drops in aggregate consumption, while rate-of-return shocks create larger negative effects. This is because when concentration is high, aggregate consumption is driven more by high wealth and high income households whose spending is more broadly supported by their return on assets rather than wages. In the scenario combining a labor market slowdown and an asset market downturn, increased consumption concentration adds little fragility.
More concentrated economy barely changes dynamic
Consumption concentration has increased modestly over the past 30 years. The share of spending by consumers in the top 20 percent of the income distribution is up 4 percentage points in the last three decades, from 53 percent of total spending to 57 percent.
The rise in consumption concentration can be explained by rising income concentration and wealth concentration.
Compared with an economy with low consumption concentration, the current economy with high consumption concentration is more vulnerable to downside risks in return on assets and less vulnerable to a temporary slowdown in the labor market. Quantitatively, the effects are small. Consumption concentration may be up but has resulted in little heightened economic fragility.
About the authors

Benjamin Hoham is a research analyst in the Research Department at the Federal Reserve Bank of Dallas.

Fang Yang is an assistant vice president in the Research Department at the Federal Reserve Bank of Dallas.