
Break-even employment declined after immigration changes
Recent employment reports show U.S. payroll employment growth has cooled from its torrid pace in previous years, raising the question of whether this signals a healthy rebalancing or the start of a concerning slowdown.
A reliable benchmark is required to properly interpret these numbers, the break-even rate of employment growth, or the number of jobs required each month to keep the labor market in balance.
A new, high-frequency estimate of break-even employment shows a dramatic reversal in immigration flows, combined with cyclical shifts in labor force participation, has caused the monthly break-even requirement to collapse from a peak of approximately 250,000 in 2023 to about 30,000 in mid-2025.
This recalibration suggests that today’s more modest payroll gains don’t signal weakness but are consistent with a balanced labor market. Furthermore, the new measure highlights the growing importance of using timely, comprehensive data to track an economy reshaped by volatile demographic forces.
Deconstruct break-even employment
Break-even employment is most commonly understood in two ways: It is the pace of job growth needed to hold the unemployment rate constant, or, equivalently, the growth required to absorb the net monthly increase in the size of the labor force.
One can view the labor force as the product of the labor force participation rate and the civilian noninstitutional population (CNP). The latter, in turn, can be expressed as the product of the total population (POP) and CNP’s share of the total (CNP/POP). This decomposition gives rise to a simple expression for the growth rate of the labor force as the sum of the growth rates of the three pieces that make it up: total population, the labor force participation rate and the civilian noninstitutional population’s share of total population.
To keep the unemployment rate stable, the growth rate of employment must equal the growth rate of the labor force. Knowing the level of employment, we can easily translate this break-even growth rate into a break-even number of net new jobs.
Such an estimate is constructed by assembling each of these three components from the timeliest data available.
Component 1: Real-time estimate of population growth
The most significant driver of recent volatility in the labor force has been immigration. Population statistics from the Census Bureau and Bureau of Labor Statistics are invaluable benchmarks, but their methodology, which relies on annual estimates and periodic survey data, updates with a considerable lag. In a period of rapid demographic shifts, these lags can lead to a misreading of the economy in real time.
To overcome this, I construct a high-frequency, bottom-up measure of total U.S. population growth (Chart 1). The methodology combines three distinct data streams.
- Natural population change: The latest available monthly data on births and deaths from the Centers for Disease Control and Prevention are used to project a forward trend.
- Legal immigration: Congressional Budget Office projections for the flow of legal permanent residents and nonimmigrant visas provide a stable baseline for documented arrivals.
- Net unauthorized immigration: This is the most volatile component and draws from timely estimates derived from administrative and border-crossing data. Crucially, this series captures not only the surge of arrivals in 2022–23 but also the sharp reversal that began in mid-2024, which includes an estimated net outflow (including self-deportation) of approximately 300,000 individuals during 2025. This outflow remains the single largest source of uncertainty for the demographic outlook.
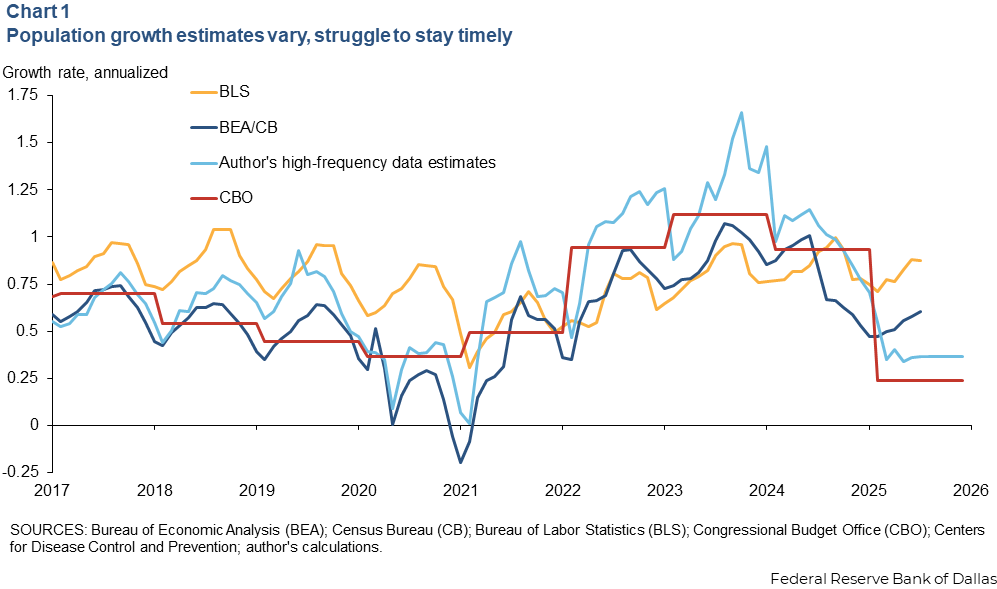
The resulting population growth estimate shows a significantly higher peak in 2023 and a much steeper fall into 2025 compared with series based on official sources.
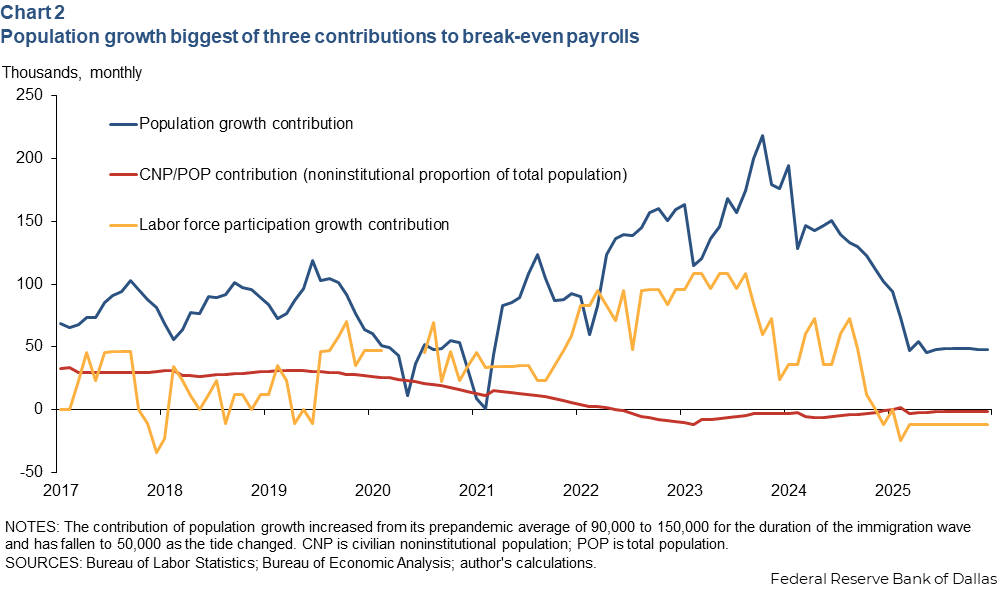
From its prepandemic average of 90,000 people, the contribution of population growth increased to 150,000 for the duration of the immigration wave and has declined to 50,000 as the tide changed (Chart 2).
Component 2: Capturing the labor force participation cycle
Changes in the labor force participation rate are the second driver of breakeven. The labor force participation rate is pro-cyclical; it tends to rise following labor market improvements and fall after the market cools. An aging population has produced an overall long-term drag on labor force participation. After rising steadily through 2023, the labor force participation rate has trended down in 2025.
To isolate the underlying cyclical movements from noisy month-to-month fluctuations, the labor force participation rate growth rate is calculated and then smoothed with a two-year moving average. This trend translates into a monthly contribution to breakeven, also shown in Chart 2.
At the 2023 peak, rising participation added nearly 100,000 to the monthly break-even requirement. Today, that tailwind has become a headwind, subtracting roughly 20,000. This cyclical swing has acted as a powerful amplifier of the underlying demographic trend.
Importantly, this observed change in labor force participation is primarily a broad cyclical phenomenon affecting the entire population, far exceeding what can be explained by the compositional effects of recent immigrants alone.
Component 3: The slow-moving structural ratio
The final component accounts for the fact that the labor force participation rate is measured as a share of the civilian noninstitutional population, a group that excludes children under 16, active-duty military and the institutionalized population. Immigration and natural change affect the total population. The shifting ratio of these two population measures therefore matters for the calculation.
While high-frequency data on this ratio are unavailable, historical data from the Census Bureau’s decennial census and the American Community Survey show that this share evolves very slowly. The ratio’s contribution to the monthly break-even number is small and stable, rarely exceeding 25,000 people. I incorporate this as a slow-moving structural factor in the overall estimate.
The result is a dramatically lower break-even rate
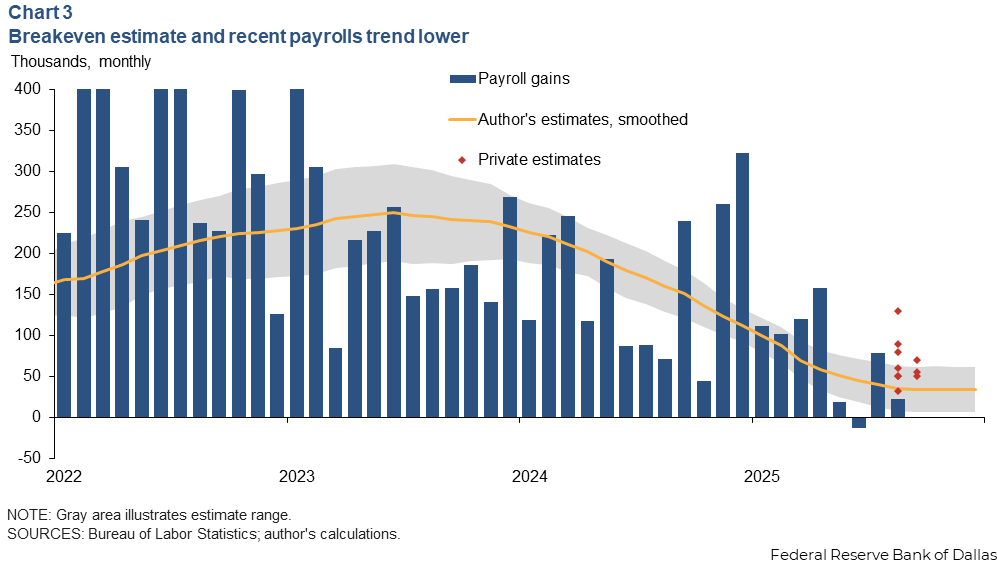
Combining these three components yields a comprehensive break-even employment estimate (Chart 3). The series rose from less than 100,000 new jobs to keep employment in balance in late 2020 to a peak of roughly 250,000 in mid-2023. Since then, it has collapsed, falling to the current estimate of approximately 30,000.
As illustrated in the Chart 2 decomposition, about half of the decline in the break-even number is explained by the slowdown in population growth and the other half by the slowdown in the labor force participation rate.
This estimate provides a powerful lens to view recent labor market history. In late 2023 and early 2024, when actual payroll growth frequently fell below the elevated break-even estimate, the unemployment rate correspondingly drifted higher. More recently, as payrolls have exceeded the now-lower break-even line, the unemployment rate has stabilized. This provides important external validation for my measure.
When compared with alternative estimates built on official population data (shown in Chart 1), the new series appears more responsive to the underlying demographic shifts. Other series understated the break-even need in 2023 and overstate it now.
The uncertainty stemming from these different population growth rates and other components is depicted as a gray band around my estimate in Chart 3. My estimate is consistent with a growing consensus among private forecasters and Federal Reserve speakers who have also marked down their assessments of break-even employment.
A new labor market reality emerges
Several conclusions arise for navigating an economy shaped by demographic volatility.
- The goalposts have moved. A break-even rate of around 30,000 appears to be the new reality for the U.S. labor market. This means modest payroll gains, which might have seemed alarming in 2023, are now indicative of a stable and balanced market.
- Look through the headlines. With payrolls and GDP growth heavily influenced by demographic factors, they have become less reliable indicators of economic slack or overheating.
- The unemployment rate is a more reliable signal. Federal Reserve Bank of Dallas research shows that the unemployment rate has been remarkably insensitive to these demographic shocks. It therefore remains a clearer and more stable signal of labor market slack than jobs data.
- Real-time data is paramount. In a rapidly changing environment, the ability to construct high-frequency, comprehensive measures of fundamental inputs, such as population, is not just an academic exercise. It is critical for accurate economic analysis and sound policymaking.
About the author

Anton Cheremukhin is a principal research economist in the Research Department of the Federal Reserve Bank of Dallas.