A simple measure of monetary policy transmission
The Federal Open Market Committee (FOMC) adjusts the stance of monetary policy primarily by changing its target range for the federal funds rate. However, relative to other money markets and the U.S. financial system as a whole, the federal funds market is small both in the volume of transactions and in the number and variety of participating institutions. Changes in the fed funds rate, therefore, may not significantly affect the economy unless the fed funds rate transmits well to other money market rates and broader financial conditions.
I propose a simple new measure of monetary policy transmission and use it to assess the current effectiveness of transmission from fed funds to broader money markets. The measure can be calculated from publicly available data with only a brief lag.
I find that transmission from the Effective Federal Funds Rate (EFFR) to broader money markets has deteriorated in recent months. However, it does not exhibit a breakdown comparable to several that occurred from late 2018 through the onset of the pandemic in 2020. I also compare transmission of EFFR with transmission of the Tri-Party General Collateral Rate (TGCR). Transmission of TGCR deteriorated less than transmission of EFFR in the episodes during 2018 through 2020 and has weakened only modestly in recent months, much less so than EFFR.
Even on a single day, interest rates can vary both across transactions within a single money market such as the fed funds market and across different money markets such as fed funds and the market for repurchase agreements (repos). Duffie and Krishnamurthy (2016) observed that interest rate dispersion reduces the efficiency of monetary policy transmission because marginal rates of substitution are not equated across market participants. They proposed measuring pass-through efficiency by examining the volume-weighted dispersion of money market interest rates. Such an index can be calculated either using the average rates on each of several money market instruments or using transaction-level data that reflect variation in rates for a given instrument.
The Duffie-Krishnamurthy dispersion measure is higher when the level of interest rates differs between money markets, after correcting for observable risk factors. While such level differences can imply inefficiency in the sense that the cost of money is not the same for all market participants, level differences between markets do not necessarily impair the setting and transmission of monetary policy. If the spread between fed funds and other rates is stable, the FOMC can take the spread into account when deciding where to set the fed funds target range to achieve its macroeconomic goals. However, if the spread between fed funds and other rates varies, it may become more difficult for the FOMC to determine how changes in the fed funds rate will influence broader monetary and financial conditions and the economy.
My measure of monetary policy transmission builds on Duffie and Krishnamurthy’s examination of dispersion but focuses on the predictability of money market rates, removing the effect of stable differences in levels between fed funds and other markets. I estimate the root mean squared error (RMSE) from using the EFFR—the volume-weighted median rate in the fed funds market—to make simple predictions of rates on transactions in unsecured and secured money markets. When the RMSE is larger, the FOMC’s fed funds target is transmitted less precisely to broader monetary conditions.
Data
My procedure uses data on rates and volumes in the following overnight money markets: wholesale, unsecured bank funding; repos secured by Treasury securities, federal agency and government-sponsored enterprise (GSE) securities and corporate debt; and commercial paper.
For wholesale, unsecured bank funding and Treasury repos, I use daily data the Federal Reserve Bank of New York publishes on the distribution of interest rates on these transactions. The wholesale, unsecured bank funding transactions are those incorporated in the overnight bank funding rate (OBFR), which measures rates paid by banks in the federal funds market as well as for Eurodollars and large domestic deposits. The Treasury repo transactions are those incorporated in the secured overnight financing rate (SOFR), which measures rates paid on repos collateralized by Treasury securities on both tri-party and centrally cleared platforms.
For both OBFR and SOFR, the New York Fed publishes the respective reference rate, which is the volume-weighted median of rates on individual transactions, as well as the 1st, 25th, 75th and 99th percentiles of the rate distribution. I construct an estimated distribution of transaction-level rates by assuming 1 percent of transactions occur at exactly the 1st percentile rate, 24 percent at the 25th percentile rate, 50 percent at the median rate, 24 percent at the 75th percentile rate and 1 percent at the 99th percentile rate in each market. (The New York Fed also publishes percentiles of some subsegments of the markets that make up OBFR and SOFR, such as the fed funds market and the tri-party repo market. In principle, these data could be used to produce more granular estimates of the distributions, but I do not attempt to do so here in the interest of simplicity.)
Interest rate distributions often have a long right tail, and the right tail typically expands when a market comes under stress as some participants pay much higher interest rates. By collapsing the entire right tail to the 99th percentile, my approach likely underestimates both the amount of dispersion on a typical day and the increase in dispersion when monetary transmission breaks down. Thus, my method provides a conservative estimate of breakdowns in monetary transmission.
For commercial paper, I employ daily data published by the Federal Reserve Board on rates on overnight commercial paper (CP). A distribution of rates is not available for CP. However, the data give the volume and average rates on overnight CP from four separate types of issuers: AA-rated financial institutions, AA-rated non-financial firms, A2/P2-rated non-financial firms and asset-backed securities. I construct an estimated distribution by assuming the entire volume in each category is issued at that category’s mean rate. Again, this is a conservative estimate of both the amount of dispersion on a typical day and the increase in dispersion when monetary transmission breaks down. (The data aggregate daily issuance volume for maturities of one to four days; I assume the rate on all of these maturities is the same.)
Finally, I use daily data from the U.S. Treasury Department’s Office of Financial Research (OFR) on the average rate and total volume of tri-party repos collateralized by agency and GSE securities, as well as the average rate and volume of repos collateralized by corporate debt. Again, a distribution of rates is not available; treating all transactions for each collateral type as if they occur at the mean rate is a conservative approach. (The OFR does not report agency and GSE and corporate repo rates separately by duration, but market intelligence indicates these repos are typically overnight.)
I do not adjust any of the rates for differences in risk characteristics across the markets, because predictable differences do not interfere with the FOMC’s ability to predict how changes in EFFR will translate to other money market rates. Importantly, however, I do not include term money market rates, such as rates on Treasury bills or term CP. Term transactions can span FOMC meetings, and the rates in those cases reflect market participants’ expectations for how the FOMC will act. Term rates can therefore diverge from overnight rates when the FOMC is expected to change the fed funds target, but such divergences do not necessarily reflect a breakdown in transmission. If term rates were included in the calculation, it would be necessary to adjust for rate expectations, which would not be straightforward because market participants typically use SOFR rather than EFFR as the baseline for their term rate expectations.
Measuring transmission
I use the approximate distributions of rates on bank funding, repo and CP to estimate the predictability of rates from EFFR as follows.
- On each trading date t, I calculate the volume-weighted mean interest rate on all bank funding, repo, and CP transactions according to the estimated distributions.
- For a look-back period of L trading days before date t, I calculate the average difference between the volume-weighted mean interest rate and the EFFR. Assuming no trend in this average difference, the best prediction of the rate on a money market transaction on date t based on EFFR would be the EFFR at date t plus the average difference during the look-back period.
- Finally, I calculate the RMSE of this prediction across all bank funding, repo and CP transactions at date t, again according to the estimated distributions.
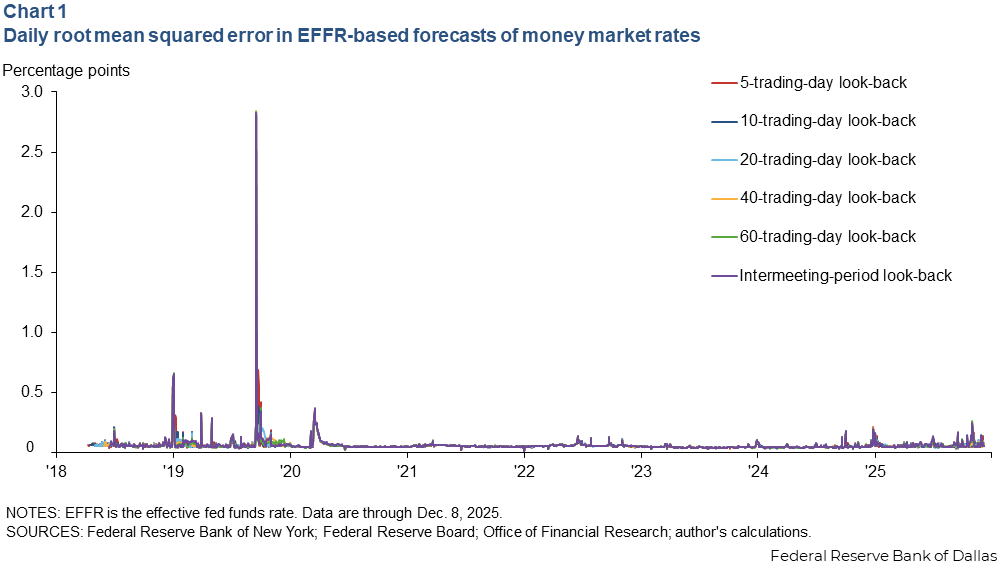
I repeat this calculation for look-back periods of five trading days (corresponding to approximately one week), 10 trading days (approximately two weeks), 20 trading days (approximately one month), 40 trading days (approximately two months), and 60 trading days (approximately one quarter). A longer look-back period responds more slowly to movements in rate spreads. This slow response can filter out noise but also means the measure will not adjust as quickly to persistent changes in spreads and can show longer-lasting reverberations from large, temporary shocks. In addition to look-back periods of set numbers of days, I examine look-back periods covering the period between the two preceding FOMC meetings to simulate the predictions the FOMC could make at each meeting using average rate spreads during the preceding intermeeting period.
Chart 1 shows the daily results. The figure begins in April 2018, when the New York Fed started publishing Treasury repo reference rates. There is substantial daily volatility. Nevertheless, some recognizable patterns and events are visible. The RMSE spiked at the end of 2018 when SOFR rose by 69 basis points for a few days over the year-end turn. The RMSE spiked even more substantially in September 2019, when repo rates surged by hundreds of basis points. It also increased modestly at the onset of the pandemic in March 2020. More recently, the RMSE appears to have climbed since late 2024 and especially in the latter part of 2025.
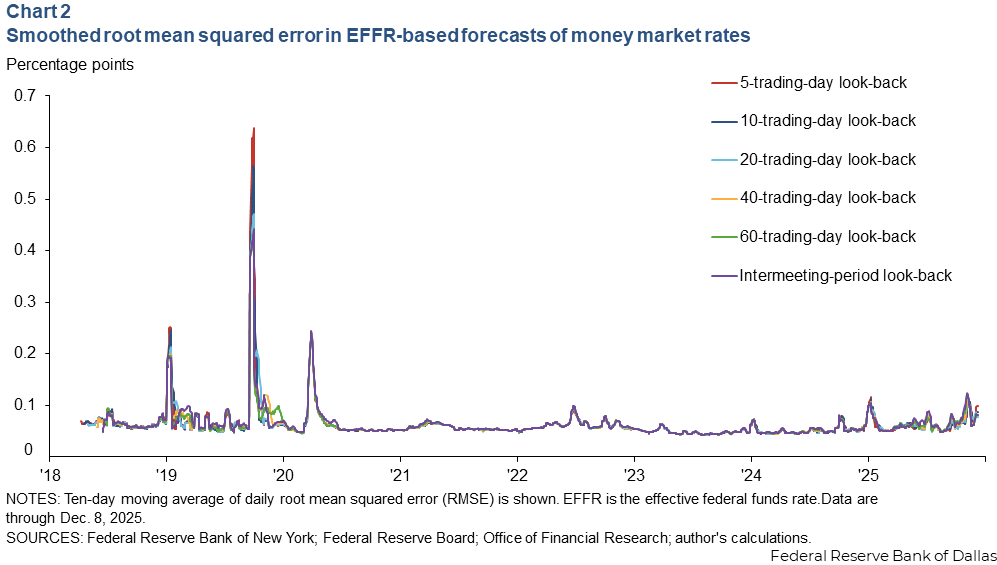
To make the patterns more visible, Chart 2 shows 10-trading-day moving averages of the daily RMSE measures. There is an upward trend in the RMSE during the later part of 2025, but it remains below the level reached at the onset of the pandemic and is much lower than the levels at the 2018–19 turn and in September 2019. The figure also illustrates the trade-offs involved in the choice of the look-back period for the prediction. When there is a brief spike in rate spreads, as at year-end 2018 or September 2019, RMSE measures using a long look-back do not react as quickly and then remain dislocated for longer. On the other hand, when rate volatility rises, as has occurred in the third and fourth quarters of 2025, the longer look-back period more clearly shows the trend in the RMSE.
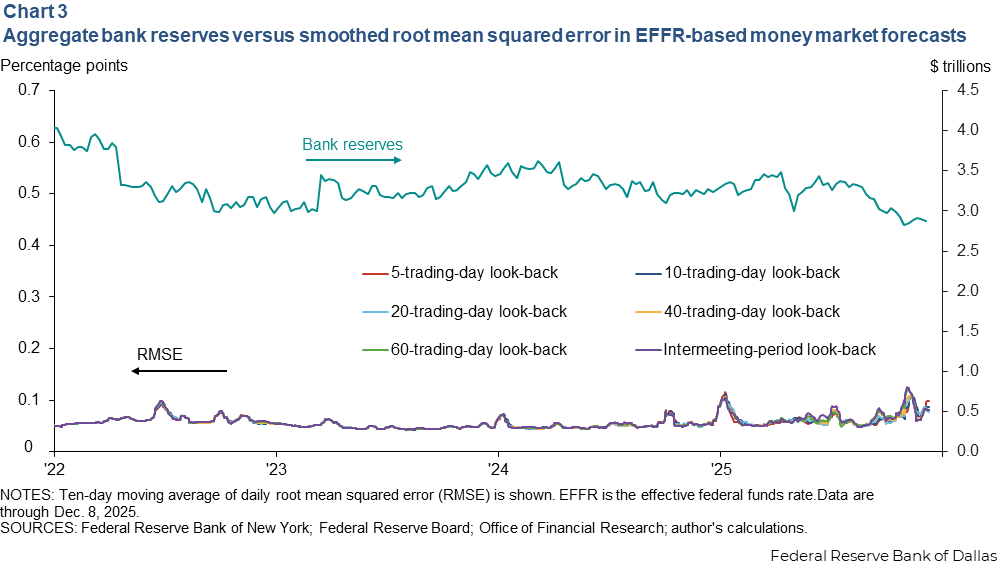
To better understand recent developments, Chart 3 plots the smoothed RMSE measures against bank reserve balances starting in 2022. The RMSE appears to begin trending upward in early 2024 and more rapidly since mid-2025, as reserves declined to postpandemic lows, though RMSE recovered somewhat in mid-November. These findings suggest that policy transmission from the fed funds rate to broader money market rates may have deteriorated as reserves fell.
The markets incorporated in my estimates differ significantly in size. In the calendar year through Dec. 8, 2025, daily volume in the markets measured by SOFR averaged $2.7 trillion, of which just over $1 trillion occurred on the tri-party platform and the rest in centrally cleared transactions. Daily volume in the markets measured by OBFR averaged $250 billion, of which about $100 billion was in fed funds and the rest in Eurodollars or domestic deposits. Repo volume collateralized by agency and GSE debt averaged $630 billion, repo volume collateralized by corporate debt averaged $130 billion, and commercial paper volume averaged $26 billion.
Because my results are volume-weighted, they are likely to be most heavily influenced by transmission from EFFR to Treasury repo markets. However, they will also incorporate transmission from EFFR to broader unsecured bank funding, CP, and agency, GSE and corporate debt repo markets, as well as transmission within the fed funds market.
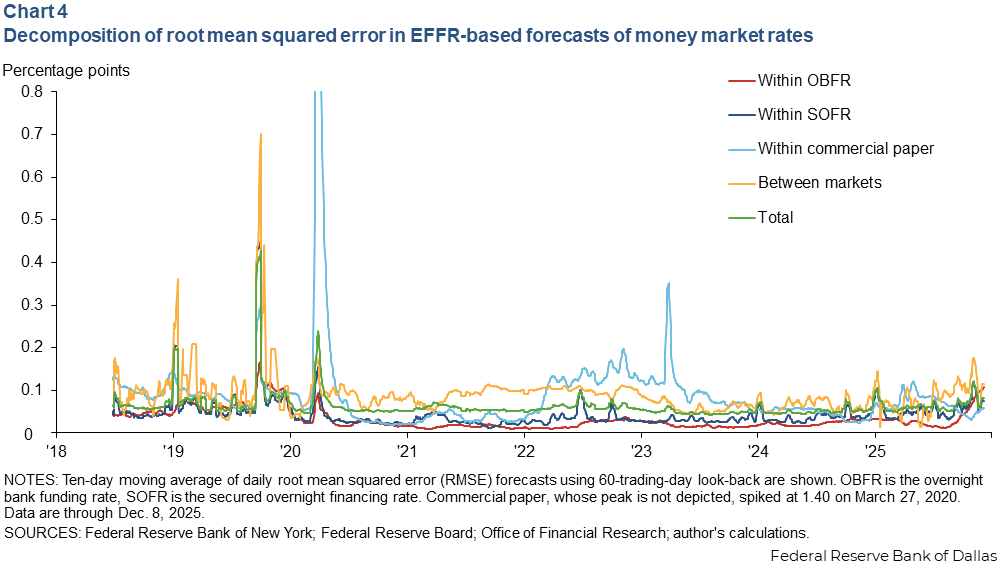
Chart 4 examines these effects by decomposing the RMSE into variation within the OBFR market, variation within the SOFR market, variation across the four types of CP within the CP market, and variation between the OBFR, SOFR, CP, and agency and GSE and corporate debt repo markets (calculated as the RMSE from predicting the volume-weighted mean of each market). The total RMSE moves closely with the RMSE within the SOFR market, as expected. However, the total RMSE also tracks the RMSE within the OBFR market and the RMSE between different markets. The metric therefore captures transmission from EFFR to money market rates in general and does not simply measure dispersion in repo rates.
Logan and Schulhofer-Wohl (2025) argued that the tri-party general collateral rate (TGCR) would provide a more robust operating target for the FOMC than the fed funds rate. TGCR is the median rate on tri-party Treasury repo transactions. Chart 5 uses my method to compare transmission of EFFR versus TGCR. I construct a TGCR transmission metric using the same procedure described above, except I measure the mean squared error from a prediction based on TGCR plus the 60-day lagged average spread between mean rates and TGCR.
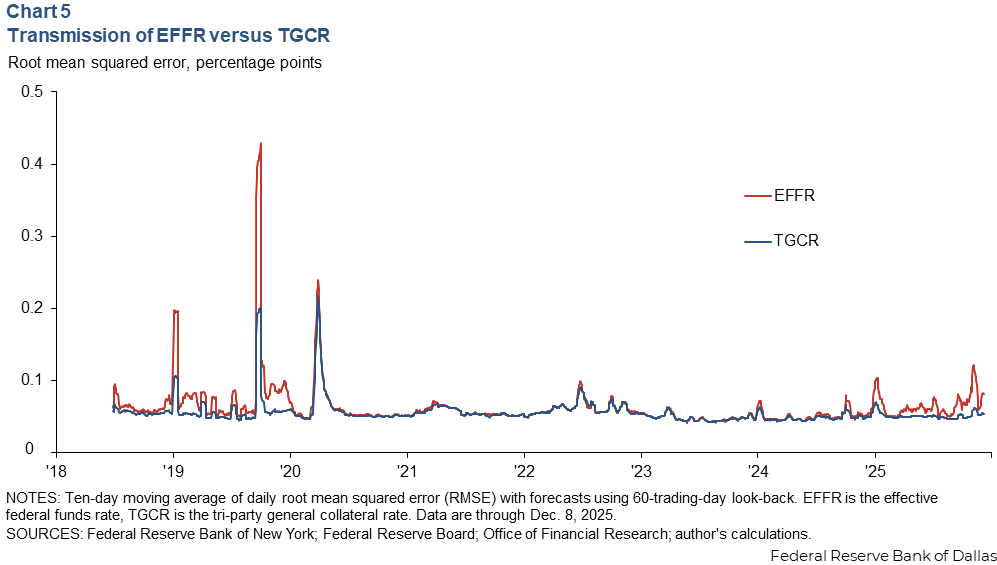
The chart shows that during the episodes in 2018–20, when EFFR transmission deteriorated, transmission of TGCR also deteriorated, but to a lesser degree. In recent months, the transmission measure for TGCR moved up only slightly and remains within its range since 2022, even as the EFFR transmission measure deteriorated more markedly. The more robust transmission of TGCR results in part from the larger share of TGCR transactions relative to EFFR transactions in the data. But it also demonstrates that TGCR transmits robustly to rates other than tri-party Treasury repo and to the cross-section of tri-party Treasury repo rates.
About the authors

Sam Schulhofer-Wohl is senior vice president and senior advisor to the president of the Federal Reserve Bank of Dallas.