Lessons from the destabilization of inflation in the 1970s
Inflation did not destabilize overnight in the 1970s. The origins of the rise in inflation can be traced to the mid-1960s (Chart 1). Starting from a stable level under 2 percent in the early 1960s, year-over-year inflation in the United States rose to 6 percent in 1970, reaching peaks of 12 percent in late 1974 and 15 percent in early 1980. The rise in inflation was only interrupted by recessions in 1970 and 1974, which caused temporary relief from inflationary pressures with some delay.
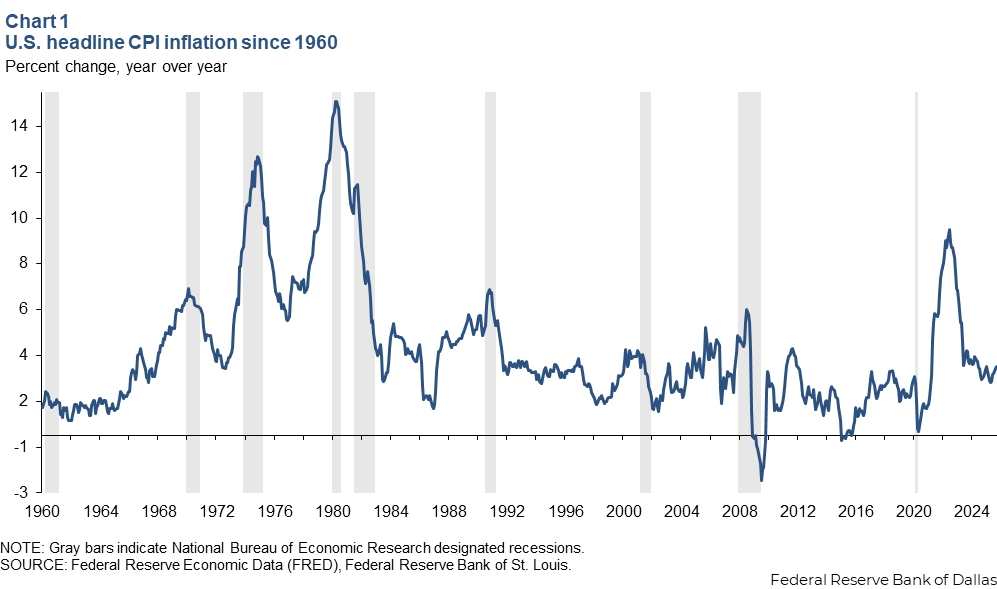
While the rise in inflation in the 1970s is usually associated with the 1973–74 and 1979 oil price shocks, this explanation falls short. It is readily apparent that inflation exceeded 7 percent even before the first sign of an oil crisis in October 1973 and reached 10 percent in February 1979 before the 1979 surge in oil prices began in earnest. Thus, the root causes of the Great Inflation of the 1970s must be deeper.
The demise of the Bretton Woods exchange rate system
To understand the gradual surge of U.S. inflation starting in the mid-1960s, one should keep in mind the role the U.S. played in the Bretton Woods exchange rate system set up after World War II.[1] The Bretton Woods Agreement entailed a fixed exchange rate of $35 to an ounce of gold. Other countries, in turn, fixed the value of their currency against the dollar. It was understood that this system required the U.S. to adjust the supply of dollars to maintain confidence in future gold convertibility.
In the 1950s, the U.S. ran a trade surplus that was more than offset by long-term capital outflows in the form of foreign aid, military spending and foreign direct investment. This allowed war-torn Europe and Japan to import capital goods from the U.S. and later, as those imports were no longer needed, to rebuild their foreign exchange reserves by accumulating dollar holdings.
Over time, however, as foreign central banks and private entities accumulated more (mostly interest-bearing) liquid dollar assets, the dollar reserves held by foreigners began to exceed the U.S. stock of gold, inviting speculation against the dollar exchange rate. At the same time, the U.S. refusal to reign in its Vietnam War and social spending in the 1960s caused inflation to rise further and made holding dollars even less attractive compared with gold, as Chart 1 shows.
The U.S. initially responded by limiting the right to convert dollars to gold to central banks. As the mismatch between dollars in circulation and U.S. gold reserves continued to grow, then-President Nixon had no choice but to close the “gold window” in August 1971, ending dollar convertibility to gold and with it the Bretton Woods exchange rate system. This set the stage for a large U.S. monetary expansion starting from an already high base by removing the need to maintain high short-term interest rates to support the exchange rate. This U.S. monetary expansion was largely mirrored by similar expansions elsewhere in the world.[2]
Why the Fed agreed to a monetary expansion in 1971–72
It may seem surprising at first glance that the Federal Reserve under Arthur Burns, a respected former academic, would have agreed to a monetary expansion, despite recognizing a shift in the public perception of inflation. Short-run inflation expectations had risen from 2.1 percent in 1966, when the University of Michigan Survey of Consumers started, to 4.6 percent in 1971.
There are many reasons for Burns’s action. Perhaps most importantly, Burns did not consider monetary policy to be the driving force behind inflation. Instead, he believed that the rise in U.S. inflation in the 1960s and early 1970s mainly reflected private monopoly power, external shocks and a lack of fiscal discipline that the Fed had no choice but to accommodate.[3]
With the government intervening directly to restrain wage and price increases, as was the intent of the wage and price controls then-President Nixon instituted in 1971, the Federal Reserve felt free to pursue a stimulative monetary policy and raise employment without having to be concerned about noticeably exacerbating inflation. The neglect of the inflationary effects of such a monetary expansion was further explained by the Fed overestimating full employment.[4]
There was a general sense that a little bit of inflation was a small price to pay for higher employment, all the more so as a previous attempt at monetary tightening in 1969 had proved costly in terms of employment. Moreover, given that the economy was not working the way it used to, especially after the demise of the Bretton Woods system, the Fed was willing to explore unconventional policies.[5] Added to this was unprecedented pressure from the Nixon administration to loosen monetary policy before the 1972 election (and sympathies from within the Fed for this policy).[6]
Finally, the Fed operated against the backdrop of having tightened too much during the Great Depression and was eager to show that it had learned its lesson. To the extent that there were warning signs, the Fed exhibited a tendency to attribute inflation to various “special factors” (e.g., unions, food prices, oil prices) rather than the monetary environment.[7]
The unprecedented monetary expansion that started in 1971 initially stimulated the economy without much of an inflationary impact. It ended in January 1973, when the Fed started tightening in response to rising inflation, well before the oil crisis that year. The Fed did not connect the acceleration of inflation to the earlier monetary expansion. Rather it attributed the surge in inflation mainly to a geopolitically driven oil price shock in 1973–74.
In fact, the Fed embarked on a second large monetary expansion, when inflation stabilized after the 1974–75 recession. It was only when Paul Volcker was appointed Fed chairman and insisted on sharply raising short-term interest rates in 1979 that this cycle of go-and-stop monetary policy ended.
These patterns are visible in the evolution of U.S. monetary aggregates such as M2 and of the federal funds rate (Chart 2).
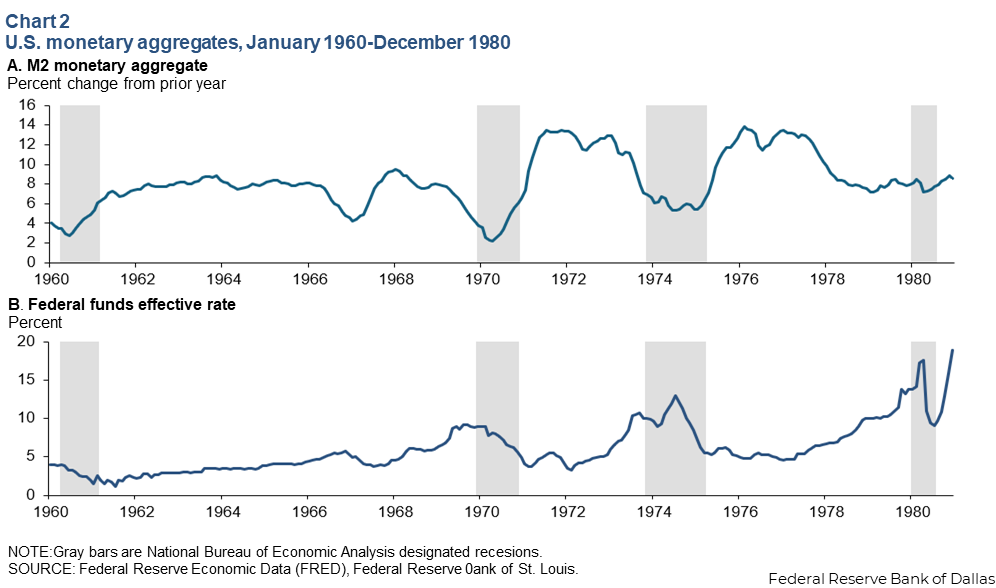
M2—the aggregate of cash and near cash, such as savings deposits and money market funds—rose noticeably in the early 1960s, creating the initial inflationary pressure. What really stands out, however, are the two unprecedented large monetary expansions after the 1970 and 1974–75 recessions, which are mirrored by pronounced declines in short-term interest rates. As a result, the real interest was persistently negative during these two episodes for the first time in postwar history.[8]
The role of monetary policy
One reason there was little concern at the time (and even decades later, for that matter) about this monetary expansion causing sustained inflation is that in conventional macroeconomic models a monetary expansion is associated with an immediate inflationary adjustment rather than sustained inflation. As subsequently shown, however, this changes when not all firms initially understand that a shift in the policy regime has taken place. Over time, as more and more firms become aware of this shift and switch to setting prices in a forward-looking manner, a monetary expansion is associated with an initial surge in output and only a delayed sustained increase in inflation, exactly as observed in the early 1970s.[9]
Stagflation in the form of rising inflation and falling output naturally arises with a delay of about three years, even in the absence of any supply shocks. Thus, such models can explain the inflation and recession data even in the absence of domestic supply shocks such as geopolitically driven oil price shocks.[10]
What then was the role of oil and fuel prices? Oil prices had declined in real terms throughout the 1960s and early 1970s and thus did not contribute to rising inflation. While it is readily apparent that much of the surge in U.S. inflation predated the quadrupling of the price of oil in 1973–74, the question remains whether this oil price shock caused U.S. inflation to accelerate in late 1973. For this causal narrative to be true, the increase in the price of oil in 1973–74 would have to be driven by exogenous forces such as a geopolitical production disruption.
This hypothesis is at odds with the fact that the Arab-Israeli War of October 1973 did not reduce the OPEC supply of oil because the war was fought in countries not producing crude oil (namely, Israel, Egypt, Jordan and Syria). While the simultaneous Arab oil embargo intended to punish supporters of Israel may have contributed to a shortage of oil, this embargo was arguably not very effective.
Quantitative measures of the geopolitical oil supply disruptions in late 1973 predict at most a 25 percent increase in the real price of oil in 1973–74, far from the quadrupling observed in the oil price data.[11] This evidence suggests an important role for oil demand and is corroborated by other data.
Notably, there was a simultaneous peak of the business cycle in the U.S., Japan and Europe in 1972–73 for the first time in post-war history. This unprecedented global expansion in turn caused a surge in the demand for all industrial commodities, including crude oil, in 1972–73, which explains why industrial raw materials prices and metals prices rose at cumulative rates not much lower than oil prices (Table 1). For example, the price of scrap metal nearly doubled between October 1972 and October 1973 and continued to rise to nearly four times its initial level by early 1974.
| November 1971-February 1974 | |
| Crude oil | 125.3 |
| Industrial raw materials | 92.6 |
| Metals | 95.9 |
| SOURCE: International Monetary Fund |
This economic boom was not accidental. The emergence of a global economic boom is exactly what models of partially unanticipated monetary expansions predict.[12] Thus, much of the surge in the price of oil in late 1973 must be attributed to earlier shifts in monetary policy rather than to geopolitical events in the Middle East. This point matters because it implies that rather than the price of oil causing inflation, both inflation and higher oil prices were ultimately caused by monetary policy actions.
A deeper look at the causes of the 1973 oil price increase
In reality, the links between monetary policy and oil markets were even more intricate.[13] In the 1960s and early 1970s, global demand for oil surged, fueled in part by a fall in the real price of oil. At the same time, public regulators controlled U.S. oil production and effectively its price. This removed incentives to expand U.S. oil production. Predictably, by 1970, U.S. production reached capacity. To meet the rising demand, the U.S. turned to imports from the Middle East, where U.S. companies were involved in oil production in many countries.
The increasing demand for oil did not escape the attention of Middle Eastern oil producers. In early 1971, Middle Eastern governments insisted on an increase in their share of the oil revenue in exchange for agreeing to fix the price of oil at which foreign oil companies would be allowed to produce as much oil as they like for years to come. These so-called Tehran-Tripoli agreements, however, did not foresee that after August 1971 the dollar would no longer be “as good as gold” and did not anticipate the further dollar devaluation and U.S. inflation. As a result, the real price of oil these countries received declined substantially in 1972 and 1973, while the amount of their oil extracted rose as the global economy boomed.
In response, in October 1973, Middle Eastern governments reneged on the 1971 agreements, expropriated the foreign oil companies operating on their soil and raised the export price of their oil. Once the posted price had risen to $11.65 per barrel on Jan. 1, 1974, production fully resumed. That price increase appears roughly in line with the latent market value of oil at the time.
The fact that the price of oil increased in late 1973 while the quantity declined may appear to be incontrovertible evidence of a negative shock to the supply of oil. This would be true if there had been a competitive oil market, but the oil market was regulated. The stylized two-period model in Chart 3 illustrates this point.
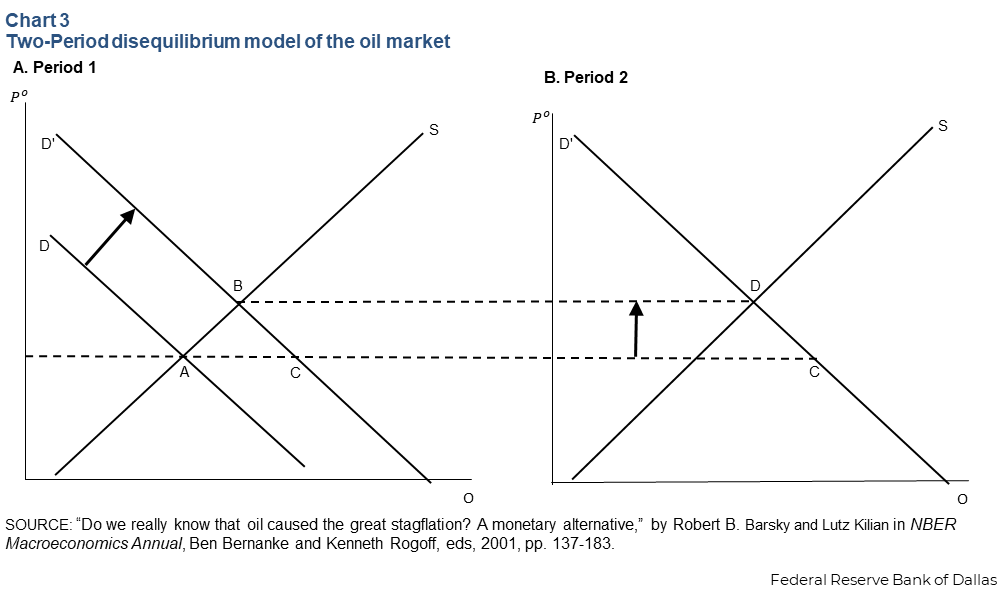
In Period 1, the market is in equilibrium, as the Tehran-Tripoli agreements have just been signed to the satisfaction of both oil producers and U.S. oil companies. Starting from the equilibrium point A, a shift in the demand curve for oil to the right as a result of the monetary expansion raises the shadow price for oil. In a free market, we would have moved to point B.
However, given the fixed contractual price of oil, we move to point C. Middle Eastern oil production increases, but the price of oil does not. U.S. oil companies extract as much oil as needed to satisfy demand at this price. In Period 2, OPEC reneges on the contractual price agreed upon prior to the monetary shift. The oil price rises to the market clearing level D, while the quantity supplied falls.
Why the past is relevant for the future
The fact that U.S. inflation surged long before the price of oil in late 1973 immediately tells us that this increase was not caused by events in oil markets. The oil price surge in late 1973 was mainly driven by inflation, the dollar devaluation and the demand boom caused by a global monetary expansion rather than geopolitical oil supply shocks. Thus, this oil price increase (and the increase in other commodity prices) was a symptom of rising inflation rather than its cause.
This insight is important because it means that the destabilization of inflation did not require large supply shocks. It was the Fed that inadvertently caused higher inflation and higher oil prices by agreeing to a large monetary expansion in 1971. The Fed failed to recognize its mistake and resumed its monetary expansion in the second half of the 1970s. Inflation and inflation expectations kept rising, culminating in the destabilization of inflation by 1980. What we can learn from the 1970s is that a well-intentioned policy of stimulating the economy by lowering interest rates has the potential of inadvertently reigniting inflation.
Notes
Click on the arrow () at the end of a note to return to the reference in the report.
- For a review of the Bretton Woods exchange rate system see “The operation and demise of the Bretton Woods system; 1958 to 1971,” by Michael D. Bordo in The Bretton Woods Agreements, Naomi Lamoreux and Ian Shapiro, eds., Yale University Press, 2019, pp. 217–235.
- “Do we really know that oil caused the Great Stagflation? A monetary alternative,” by Robert B. Barsky and Lutz Kilian in NBER Macroeconomics Annual, Ben Bernanke and Kenneth Rogoff, eds, 2001, pp. 137–183.
- See, e.g., “Arthur Burns and Inflation,” by Robert L. Hetzel, Federal Reserve Bank of Richmond Economic Quarterly, vol. 84, no. 11, 1998, pp. 21–44.
- “The quest for prosperity without inflation,” by Athanasios Orphanides, Journal of Monetary Economics, vol. 50, no. 3, 2003, pp. 633–663.
- In the words of Fed Chairman Arthur Burns, “The rules of economics are not working in quite the way they used to. Despite extensive unemployment in our country, wage rate increases have not moderated. Despite much idle industrial capacity, commodity prices continue to rise rapidly.” Reflections of a Policy Maker, Speeches and Congressional Statements 1969–1978, by Arthur F. Burns, Washington, American Enterprise Institute for Public Policy Research, 1978, p. 118.
- See, e.g., “The expectations trap hypothesis,” by Lawrence J. Christiano and Christopher Gust, Federal Reserve Bank of Chicago Economic Perspectives, vol. 24, no. 2, 2000, pp. 21–39, and “How Richard Nixon pressured Arthur Burns: Evidence from the Nixon tapes,” by Burton A. Abrams, Journal of Economic Perspectives, vol. 20, no. 4, 2006, pp. 177–188.
- See Hetzel (1998) and “The Great Inflation of the Seventies: What really happened?”, by Edward Nelson, Advances in Macroeconomics, vol. 5, no. 1, 2005, pp. 1–50.
- This discussion deliberately focuses on monetary aggregates rather than more modern Taylor rule descriptions of monetary policy. Intermediate targeting of monetary aggregates was typical of FOMC policy in the 1970s. See, e.g., “Perhaps the 1970s Fed did what it said it did,” by Sharon Kozicki and P.A. Tinsley, Journal of Monetary Economics, vol. 56, no. 6, 2009, pp. 842–855.
- See Barsky and Kilian (2001).
- A stylized model illustrating this point can be found in Barsky and Kilian (2001).
- For further discussion, see “Oil and the macroeconomy since the 1970s,” by Robert B. Barsky and Lutz Kilian, Journal of Economic Perspectives, vol. 18, no. 4, 2004, pp. 115–134, and “Exogenous oil supply shocks: How big are they and how much do they matter for the U.S. economy?”, by Lutz Kilian, Review of Economics and Statistics, vol. 90, no. 2, 2008, pp. 216–240.
- See Barsky and Kilian (2001).
- See Barsky and Kilian (2001) and Kilian (2008).
About the authors

Lutz Kilian is a vice president in the Research Department and director of the Center for Energy and the Economy at the Federal Reserve Bank of Dallas.