Houston Economic Indicators

August 5, 2021
COVID-19 is increasing in Houston, but it is not clear that this has materially affected economic activity in the region yet. However, initial estimates for June payroll data showed a surprising slowdown in the pace of recovery, particularly for goods-producing sectors like oil and gas, which is seeing increased drilling activity and favorable commodity prices. Home sales and prices were surging in June due to strong demand. Overall, the outlook remains positive, but potential risks near term from the pandemic are increasing rapidly.
Pandemic 3.0
Delta Variant Drives Third Surge in Burden of COVID
The metro area has begun losing some of the progress made against the pandemic due to the arrival of the Delta wave of COVID-19. This variant was estimated to be responsible for half of infections in Texas over the four weeks ending July 3. Estimates for the two weeks ending July 31 imply Delta surged to account for about 80 percent of infections in Arkansas, Louisiana, New Mexico, Oklahoma and Texas—94 percent when including its subvariants (AY.1, AY.2 and AY.3). The more-contagious strain is racing through the population, with mostly unvaccinated individuals being hospitalized.
The number of coronavirus-positive patients in Houston-area hospitals has nearly quadrupled from a 14-month low of 439 during the seven days ending June 30, 2021, to 1,635 on July 31 (Chart 1). As of July 31, daily hospitalizations in Houston and Galveston Trauma Service Areas were projected to rise further in August and September. Over the past year and a half, increasing coronavirus hospitalizations have been associated with worsening economic outcomes.
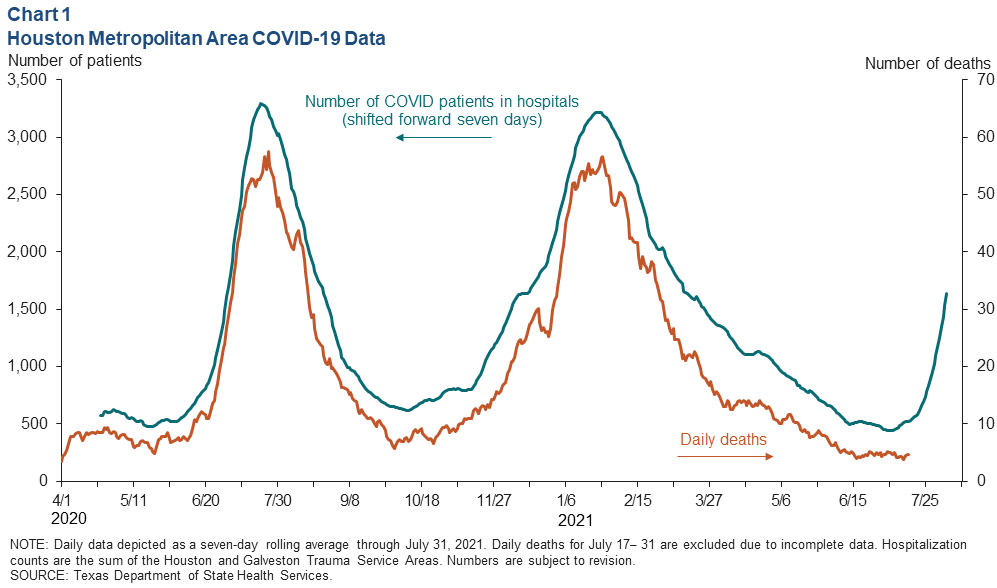
Increases in hospitalizations tend to precede rising deaths. The recent rise in COVID-positive patients suggests local COVID deaths will rise sharply as well. It is uncertain to what extent vaccinations and residual immunity from prior infections will limit the scale of the Delta wave when compared with prior strains of the virus.
The share of the total population in the Houston metropolitan area that was fully vaccinated as of July 28 was 50 percent. This was higher than Texas overall, in which 44 percent of its population was fully vaccinated. Nationally, 50 percent were fully vaccinated.
The seven-day average of daily vaccinations in Texas peaked on April 11 at 270,591 and fell as low as 43,050 on July 16—not counting the July 4 holiday weekend. By the end of July, that number had increased 42 percent to nearly 63,000 daily doses.
Impact of Delta Wave on Mobility Likely Modest So Far
Google mobility data were slightly weaker for several Texas metropolitan areas in July. Houston mobility eased from -30 in late June to -33 in late July (Chart 2). This may be attributable in part to the Delta wave, but other factors such as seasonality may also be at play.
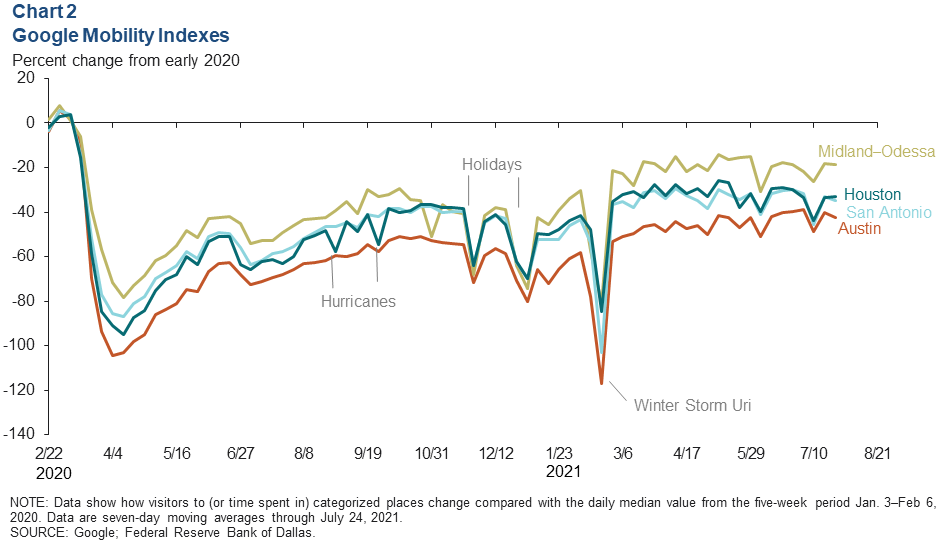
Overall mobility in San Antonio has been similar to Houston throughout the pandemic. Mobility has been relatively subdued in the Austin metro area by comparison, while the Midland–Odessa region has seen higher average mobility. The differences in average mobility over the past year likely reflect the capacity of each region’s industry mix to work remotely.
Restaurant Demand Elevated
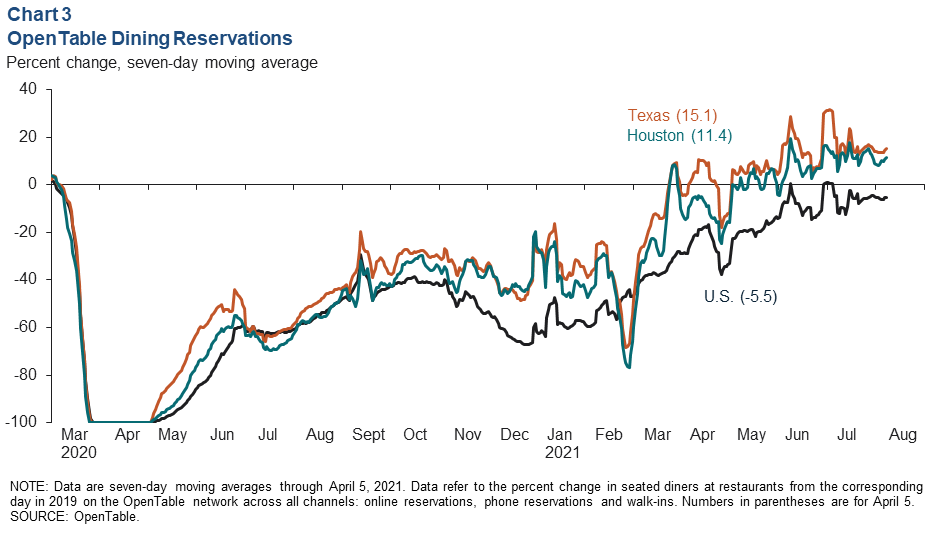
Other high-frequency indicators of local economic activity are mixed. OpenTable data on restaurant demand—number of diners seated—showed no sign of slowing down through the end of July (Chart 3). In contrast, Homebase employment data indicate that the number of hourly workers clocking in each day at small businesses has slowed.
Employment
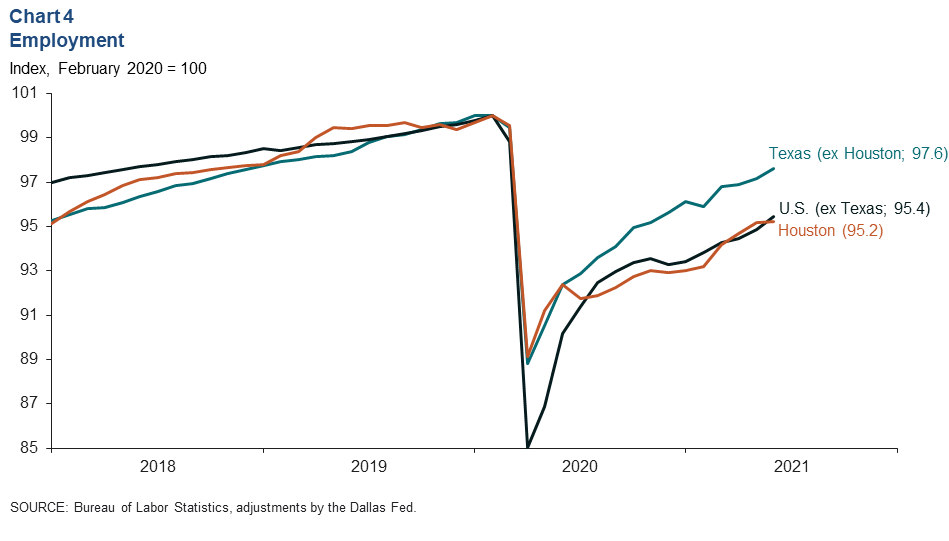
Houston-area employment continued to recover in June, albeit at a slower pace (Chart 4). Houston added 1,700 jobs in the initial estimate for June payroll growth after adding over 15,000 jobs in April and 15,800 jobs in May. That brought Houston to 95.2 percent of prepandemic employment levels. Total payroll job growth did not slow in either the rest of Texas or the nation overall but instead climbed to 97.6 percent and 95.4 percent of prepandemic levels, respectively, in June.
The June slowdown in Houston was sharper than what might have been expected based on signs of a tightening labor market, supply chain disruptions and rising input prices. Other data for June such as Homebase, local leading indicators like the Houston Purchasing Managers and leading indexes, and the Texas Manufacturing and Service Sector outlook surveys logged only modest weakening of employment indicators, if any. June output and revenue growth were also healthy in industry surveys.
Regional payroll jobs data will be subject to several revisions, including early benchmarking in the coming weeks.
Oil and Gas
Benchmark West Texas Intermediate crude oil prices reached their highest point since 2014 in July, averaging over $72 per barrel (Chart 5). The improvement is more striking in Midland—closer to the wellheads of the Permian Basin—where oil and gas producers have spent most of the last six years selling crude at a discount due to insufficient takeaway capacity.
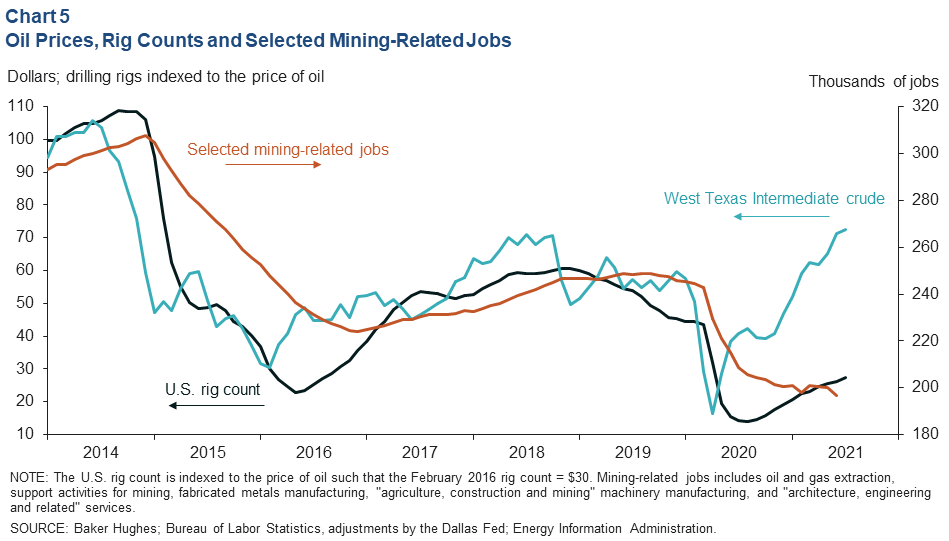
Typically, a change in the price of oil is followed by a change in drilling activity about three months later. However, the increase in drilling and completion activity this year has been relatively muted given the run-up in oil prices. Firms have instead prioritized increased returns for investors, deleveraging, and mergers and acquisition activity over highly leveraged production growth.
This “capital discipline” amid strong pricing on the heels of the pandemic oil bust and a pair of bankruptcy cycles from 2015 to 2016 and in 2020 has helped transform energy-sector returns from one of the worst performing in the S&P 500 this past decade into the best performing sector year to date in 2021.
In prior oil busts, it took about one year for mining jobs—including manufacturing and other related professional, technical and scientific services—to stabilize once the price of oil bottomed. By spring 2021, industry payrolls had stabilized, but data for June show a slight decline in jobs despite the rising rig count and high oil prices.
Single-Family Housing
Home sales in Houston are booming due to low interest rates and other factors like shifts in preferences during the pandemic. In second quarter 2021, 28,015 homes were sold in the Houston area, or nearly 9 sales per 1,000 employed people in the region (Chart 6). That is an 11.9 percent increase over the 2006 peak during the housing boom.
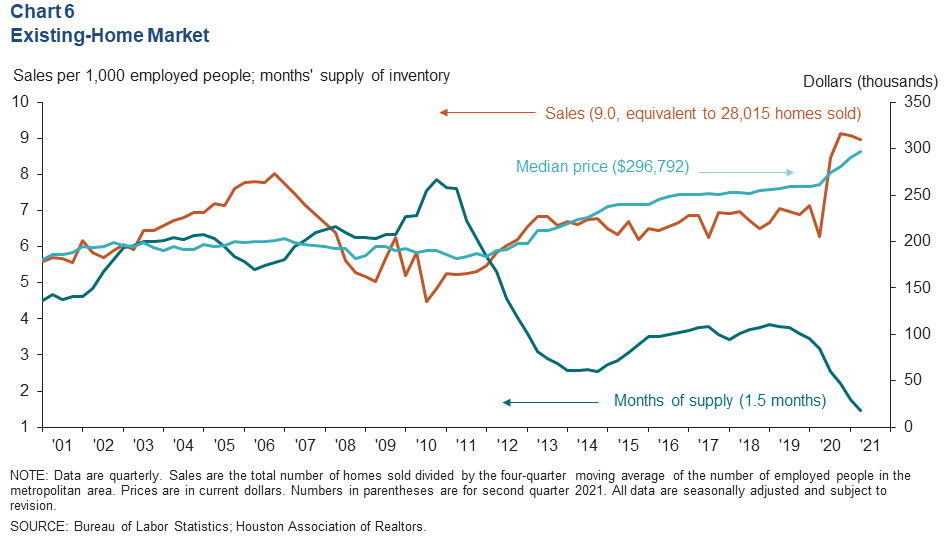
Limited construction the past decade, high demand over the past year and a record-low number of houses listed for sale have helped push existing-home inventories—the number of sales divided by the number of homes listed for sale each month—to a record-low average of 1.5 months of supply in second quarter 2021.
Tight supplies and high demand are driving near-record home-price appreciation. The median price of homes in Houston was $296,792 in second quarter 2021—a nearly 12 percent annualized two-quarter increase. The record growth rate by this measure was 15.4 percent in both second quarter 2013 and fourth quarter 2020.
NOTE: Data may not match previously published numbers due to revisions.
About Houston Economic Indicators
Questions can be addressed to Jesse Thompson at jesse.thompson@dal.frb.org. Houston Economic Indicators is posted monthly after Houston-area employment data are released.