
Less-tight labor market helps Texas grow faster than U.S. during pandemic
The Texas economy continues to grow faster than the U.S. economy, even though the state unemployment rate often exceeds that of the nation—an apparent paradox.
Payroll employment expanded at a 5.3 percent annual rate through the first 10 months of 2022, compared with 3.3 percent for the nation, according to the Bureau of Labor Statistics. Thanks to its significantly faster job growth, Texas is 5.1 percent above its prepandemic employment levels, while the U.S. is 0.5 percent above its prepandemic peak.
Despite the state’s less-severe COVID-19-related economic contraction in early 2020 and stronger recovery, the Texas unemployment rate was 4.0 percent in October—0.3 percentage points above the U.S. rate of 3.7 percent (Chart 1). While the higher unemployment rate suggests that labor market conditions in Texas are somewhat less favorable than in the nation, the jobless measure may be too narrow. Specifically, it doesn’t account for workers outside the labor force, such as retirees and discouraged workers.[1]
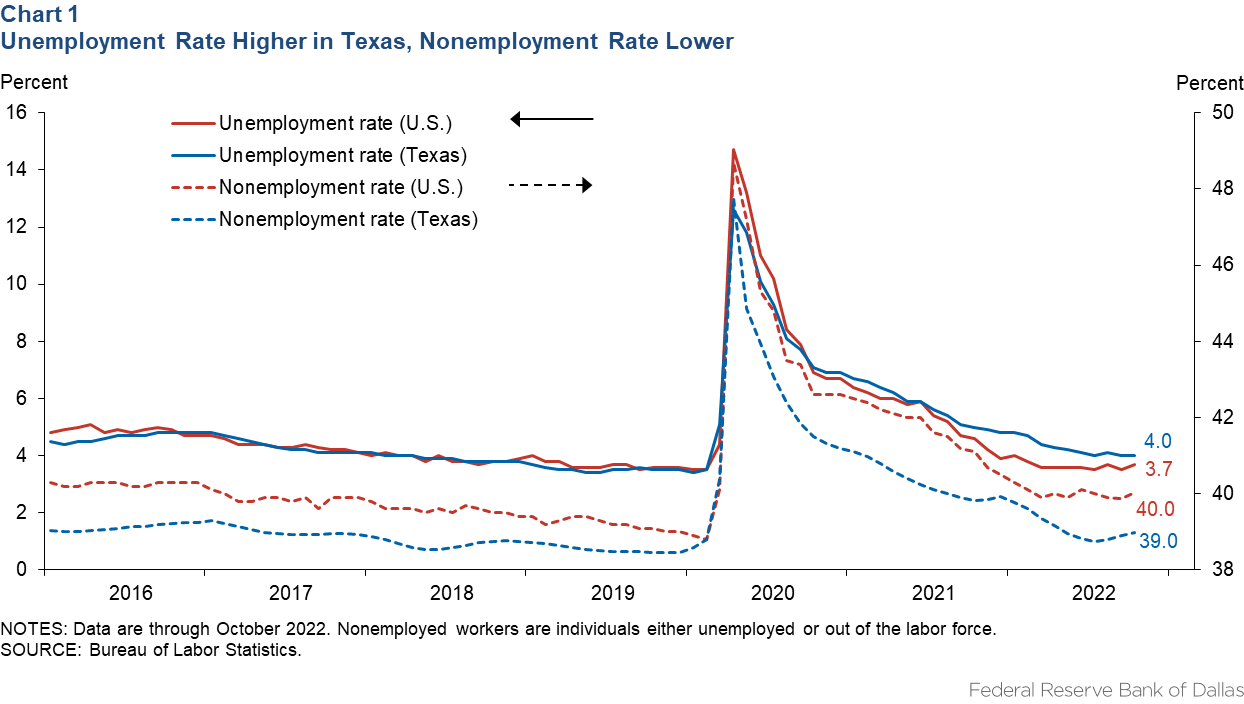
Texas’ unemployment rate may be higher partly because workers, encouraged by more robust job growth, have entered the labor force at a faster clip than in the nation. Due to a stronger economy, Texas also attracts workers from other states in search of jobs, adding to the size of the labor force.[2]
Not surprisingly, the labor force participation rate, which was 63.4 percent in both Texas and the U.S. before the pandemic, has improved to 63.6 percent in Texas, while nationally it still lags behind at 62.2 percent. In fact, counting both unemployed workers and those out of the labor force as a share of the population, the nonemployment rate for October 2022 is lower in Texas at 39.0 percent than in the U.S. at 40.0 percent.
Gauging worker demand
The unemployment rate and the nonemployment rate are imperfect measures of labor market tightness because they mainly represent the supply of workers and do not capture the demand side of the labor market. For the same number of job seekers, the labor market with a larger number of job openings would be considered tighter.
A more precise measure of labor market tightness should incorporate both the demand and supply sides of the labor market. Previous research has considered a number of potential measures of labor market tightness.[3]
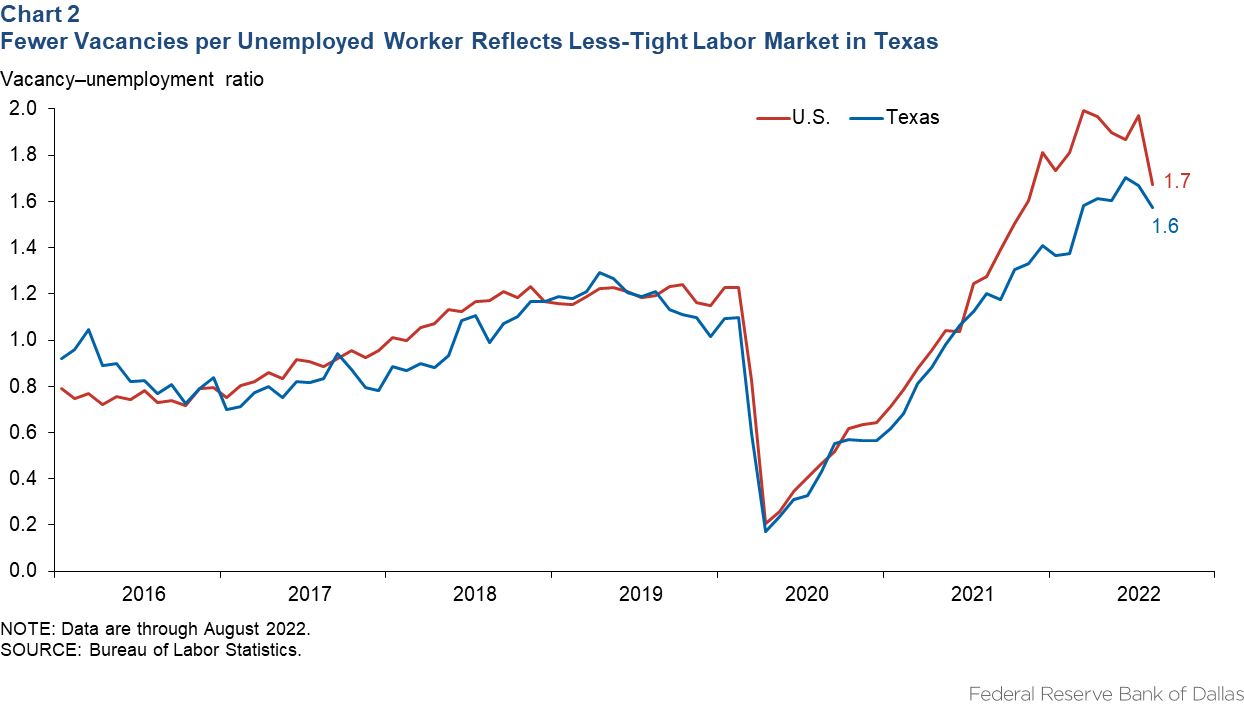
One that stands out as a predictor of wage growth is the ratio of job vacancies to the number of unemployed, also known as the vacancy–unemployment ratio. A higher vacancy–unemployment ratio indicates greater demand for labor relative to the supply of available workers.
The vacancy–unemployment ratio for Texas and the U.S. exceeds 1, suggesting that there are more job openings than unemployed workers looking for jobs and that labor markets have been very tight (Chart 2). Still, the Texas vacancy–unemployment ratio is lower than the national figure, which means that labor markets are less tight and worker shortages have been less severe in Texas.
Filling jobs in Texas
Given less-acute worker shortages in Texas, the job-filling rate (the number of hires relative to job openings) has been consistently higher in the state than in the nation (Chart 3). The jobfilling rate is also considered a proxy for labor market tightness because it indicates how easy it is for employers to fill job vacancies—a lower rate is indicative of tighter labor markets.[4]
Just like the vacancy–unemployment ratio, the job-filling rate rose dramatically at the onset of the pandemic as job vacancies disappeared. But then the ratio fell sharply when the job-openings rate outpaced the hiring rate.
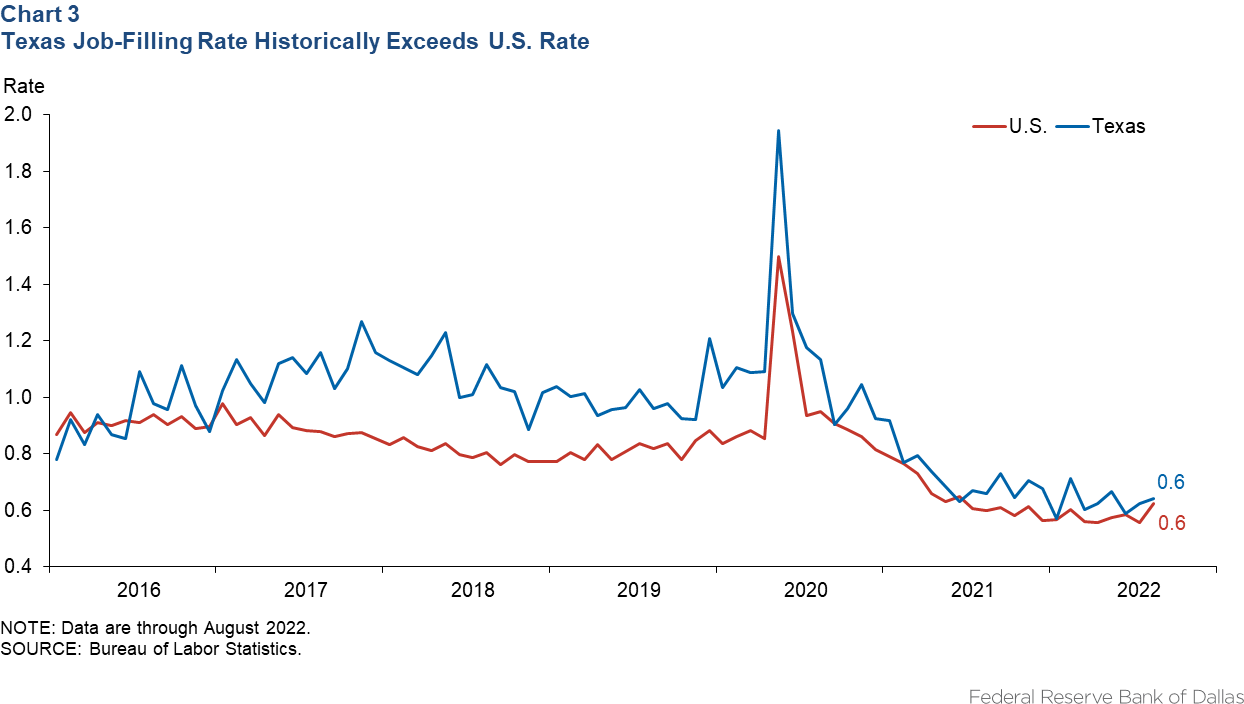
Once again, as with most other indicators, a slightly overall higher jobfilling rate in Texas since the pandemic began confirms that labor markets have been less tight than in the nation as a whole. However, the Texas–U.S. gap in the job-filling rate has narrowed relative to prepandemic levels.
Steeper Beveridge curve
The current level of labor market tightness can provide useful insights into the efficient functioning of the labor market—how well workers are matched to jobs. The ease with which job matching results in job creation depends on the number of vacancies, the number of job seekers and the efficiency of the matching process.
Summarizing this relationship is the Beveridge curve, which depicts the interaction of job vacancies and unemployment that results in the same number of jobs created at a given matching efficiency. The downward slope of the curve reflects the tradeoff between job vacancies and unemployment—when economic activity strengthens, job postings typically rise and unemployment falls.
While movements along the curve capture the impact of cyclical changes in economic activity, shifts are symptomatic of structural changes in the labor market. The position of the curve depends on the matching efficiency and the hiring rate.
Increased hiring due to greater reallocations of workers across sectors would require more vacancies as well as more job seekers, shifting the curve upward. A decline in matching efficiency can similarly lead to an upward shift, resulting in the need for more vacancies amid higher unemployment.
Both these factors have been at play in the large upward shifts in the Beveridge curve during the pandemic in the U.S. and Texas (Chart 4). The jobsearch-and-matching process encountered significant frictions following the labor market churn during COVID-19, leading to more vacancies as well as higher unemployment than before the pandemic (the shift from the dashed to the solid line).
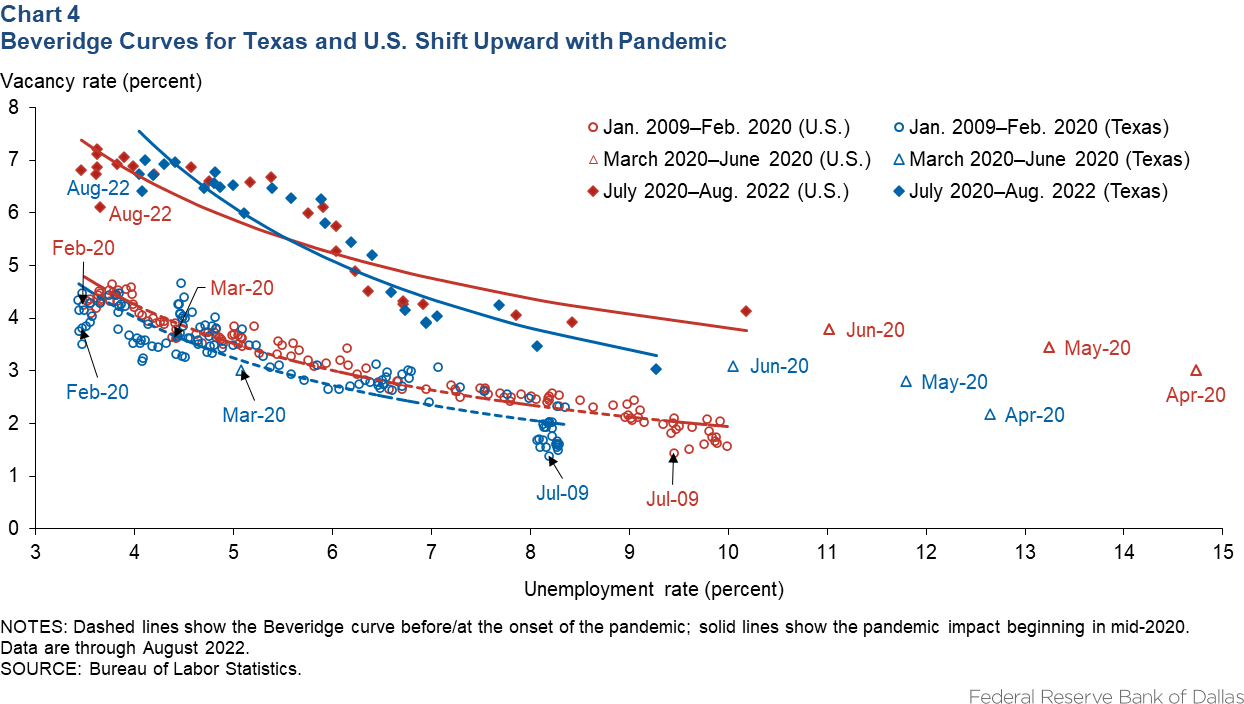
Prolonged weakness in sectors such as leisure and hospitality created a large pool of workers either out of work or looking to switch to other sectors. The resulting reallocation of labor across sectors contributed to the upward shift in the curve.
The sectoral mismatch, among other factors such as an increase in long-term unemployment during the pandemic, also diminished matching efficiency, further amplifying the upward shift in the Beveridge curve.
An estimate of matching efficiency can be obtained from the Beveridge curve relationship using the hiring rate available from JOLTS data and the vacancy–unemployment combinations (Chart 5). Before the pandemic, Texas labor markets more efficiently matched workers to jobs than the U.S. market, but the gap narrowed significantly during the pandemic.
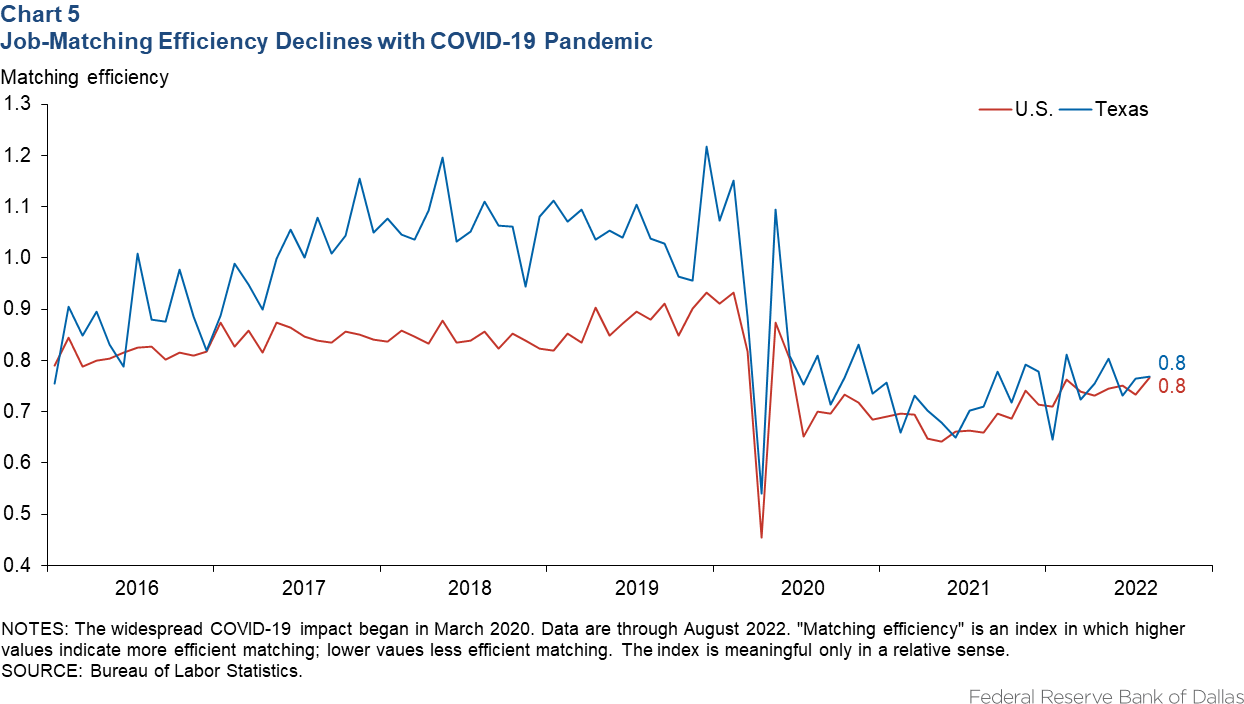
With significant frictions remaining in the job-search-and-matching process since the COVID-19 outbreak, matching efficiency remains below prepandemic levels in Texas and the U.S.
Rising interest rates
The comparison of the U.S. and Texas Beveridge curves in Chart 4 suggests that the slope for Texas has been notably steeper than that of the U.S. during the pandemic. The steeper slope in Texas has important implications for the potential impact of recent interest rate increases on the state labor market relative to the U.S.
The sharp rise in interest rates needed to slow inflation has led to concerns that economic activity may weaken significantly, causing large unemployment rate increases and potentially tipping the economy into a recession. However, just how much the economy could weaken and whether a severe downturn can be avoided have been matters of intense debate among economists.
One view holds that with such high vacancy rates and historically low unemployment rates, a decline in vacancies may not trigger a large increase in unemployment.[5] The extent to which unemployment rises as vacancies decline depends on the slope of the Beveridge curve. Thus, a steeper slope in Texas means that for a given decline in vacancies, the rise in Texas unemployment should be less-pronounced, improving the prospects of a soft landing in Texas relative to the nation.
The alternative view is somewhat less-optimistic about the prospects of a soft landing should interest rates continue rising. This is because matching efficiency remains well below pre-COVID levels.[6] Another reason for the less-optimistic view is that Beveridge curve relationships during past monetary tightening cycles do not support relatively muted increases in unemployment following declines in vacancies.
Efficient unemployment rate
Recent research has pioneered the concept of a socially efficient unemployment rate to assess whether a given vacancy–unemployment combination on the Beveridge curve should be considered efficient.[7]
Socially efficient unemployment is relevant because both unemployment and vacancies are costly to the economy—the unemployed need to spend time and resources seeking jobs, and firms incur recruiting costs to fill vacancies. Therefore, reducing both unemployment and vacancies would clearly make the economy better off. Unfortunately, the downward sloping Beveridge curve implies that it is not possible to reduce both.
Given the tradeoff, there must exist an efficient unemployment rate that maximizes economic welfare. If unemployment is inefficiently high, the gains from reducing unemployment would exceed the costs of having more vacancies. Conversely, if unemployment is inefficiently low, the costs of higher unemployment would be less than the gains from fewer vacancies.
The efficient unemployment rate is the only rate for which neither an increase nor a decrease in the rate would make the economy better off.
The socially efficient unemployment rate is inversely related to the slope of the Beveridge curve. This means that, all else equal, an economy with a steeper Beveridge curve can have relatively higher efficient unemployment because the additional costs of higher unemployment are offset by a relatively larger decline in vacancies.
The Beveridge curve during the pandemic in Texas has been steeper, so the socially efficient unemployment rate is likely higher in the state than in the nation. This also means that the state’s labor market during the pandemic did not need to be as tight as the nation’s for the Texas economy to operate efficiently.
This helps explain why job growth in Texas has consistently exceeded U.S. growth despite the state’s higher unemployment rate through much of the recovery from the COVID-19 downturn.
Notes
- “Texas Joblessness Persists Above U.S. Rate, Weighing on Black, Hispanic Workers,” by Anil Kumar, Federal Reserve Bank of Dallas Southwest Economy, Fourth Quarter, 2021.
- “Migration to Texas Fills Critical Gaps in Workforce, Human Capital,” by Diego Morales-Burnett, Pia Orrenius and Madeline Zavodny, Dallas Fed Economics (blog), Federal Reserve Bank of Dallas, Nov. 29, 2022.
- “What’s the Best Measure of Economic Slack?” by Regis Barnichon and Adam Hale Shapiro, Federal Reserve Bank of San Francisco FRBSF Economic Letter, no. 4, 2022.
- “Measuring Job-Finding Rates and Matching Efficiency with Heterogeneous Job-Seekers,“ by Robert E. Hall and Sam Schulhofer-Wohl, American Economic Journal: Macroeconomics, vol. 10, no. 1, 2018, pp. 1–32.
- “What Does the Beveridge Curve Tell Us About the Likelihood of a Soft Landing?” by Andrew Figura and Chris Waller, Federal Reserve Board of Governors FEDS Notes, July 29, 2022.
- “Bad News for the Fed from the Beveridge Space,” by Olivier Blanchard, Alex Domash and LawrenceH. Summers, Policy Briefs, Peterson Institute for International Economics, July 2022, pp. 22–7.
- “Beveridgean Unemployment Gap,” by Pascal Michaillat and Emmanuel Saez, Journal of Public Economics Plus 2, vol. 2, 2021.
About the author

Kumar is an economic policy advisor and senior economist at the Federal Reserve Bank of Dallas.
Articles may be reprinted on the condition that the source is credited to the Federal Reserve Bank of Dallas.
The views expressed are those of the author and should not be attributed to the Federal Reserve Bank of Dallas or the Federal Reserve System.
Full publication is available online: www.dallasfed.org/research/swe/2022/swe2204.