Eleventh Federal Reserve District banks maintain growth, profitability heading into 2026
Banks in Texas, northern Louisiana and southern New Mexico remain broadly profitable, focusing on core operations in an environment of overall macroeconomic uncertainty.
The banks making up the Eleventh Federal Reserve District experienced accelerating deposit and loan growth during 2025. Financial metrics broadly improved as the Federal Open Market Committee (FOMC) reduced the federal funds rate by 75 basis points (0.75 percentage points) during 2025. The funds rate was down 175 basis points from the 2024 level.
With longer-term interest rates also falling, banks’ unrealized losses on securities also declined, though rates partially reversed course amid geopolitical uncertainty surrounding the Iran war in first quarter 2026. Loan performance in major lending categories—commercial real estate, residential real estate and commercial and industrial—remained generally within normal levels.
Rate cuts boosted bank profitability
Interest expenses fell and interest income remained relatively flat for all banks in 2025. Many were able to pass on Fed rate cuts to reduce deposit rates, but longer-maturity interest rates remained higher. Net interest margin—the spread banks earn on their loans relative to their deposit costs—improved in the district.
From December 2024 to December 2025, the rate on the one-month Treasury bill fell from 4.4 percent to 3.74 percent, but the 10-year Treasury declined only 40 basis points, while the 30-year was narrowly bounded between 4.6 percent and 4.9 percent for most of 2025.
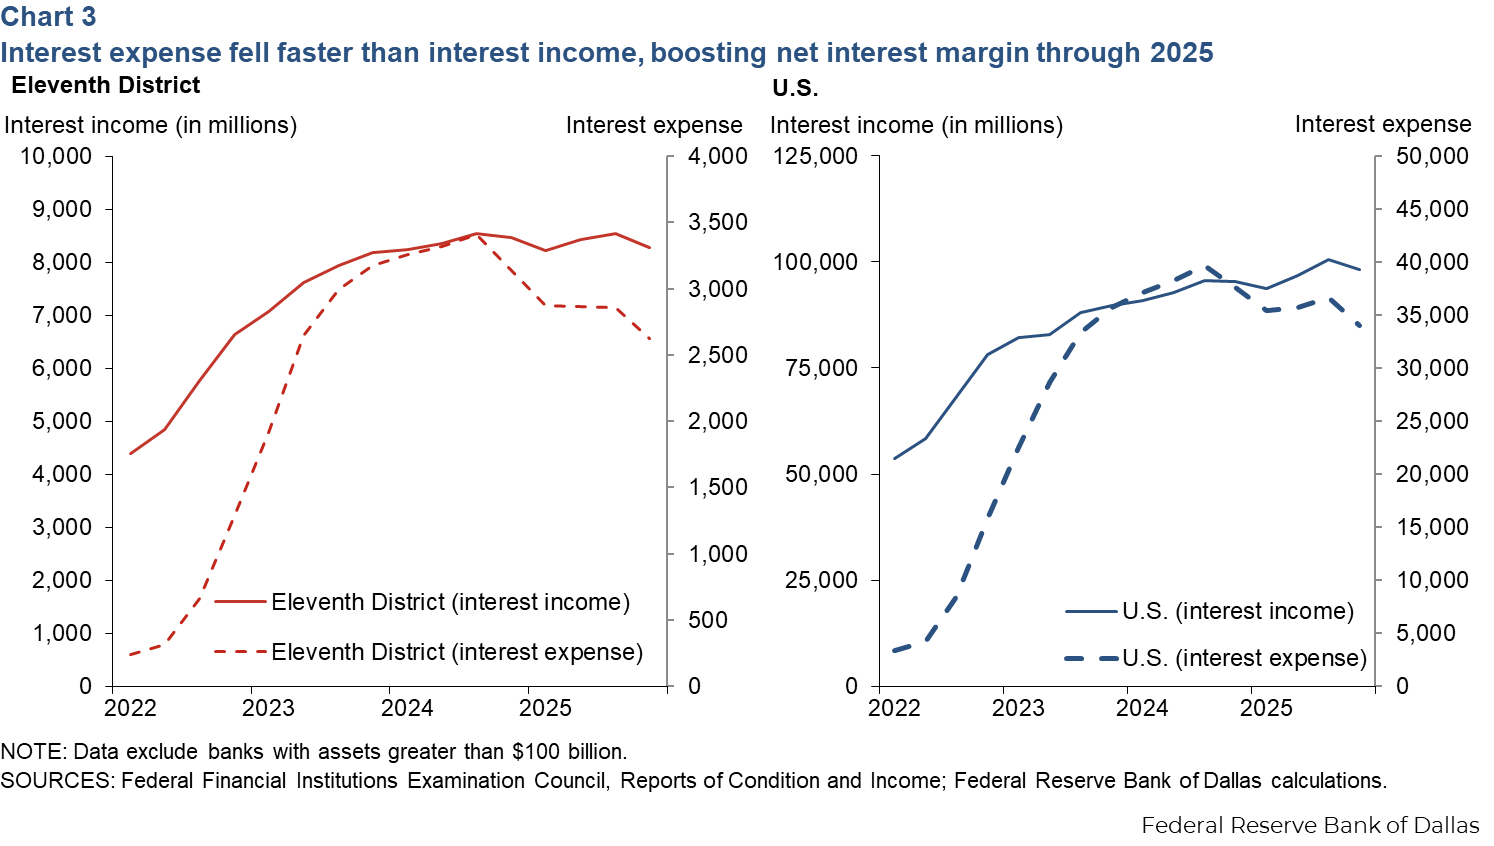
Interest expenses, which declined 19 percent in the Eleventh District, supported net interest margin improvement, even as interest income slipped 2 percent.
District banks boosted their return on assets in 2025, increasing 15 basis points over the year on average (Chart 1). They slightly outpaced U.S. banks, which improved by 13 basis points.
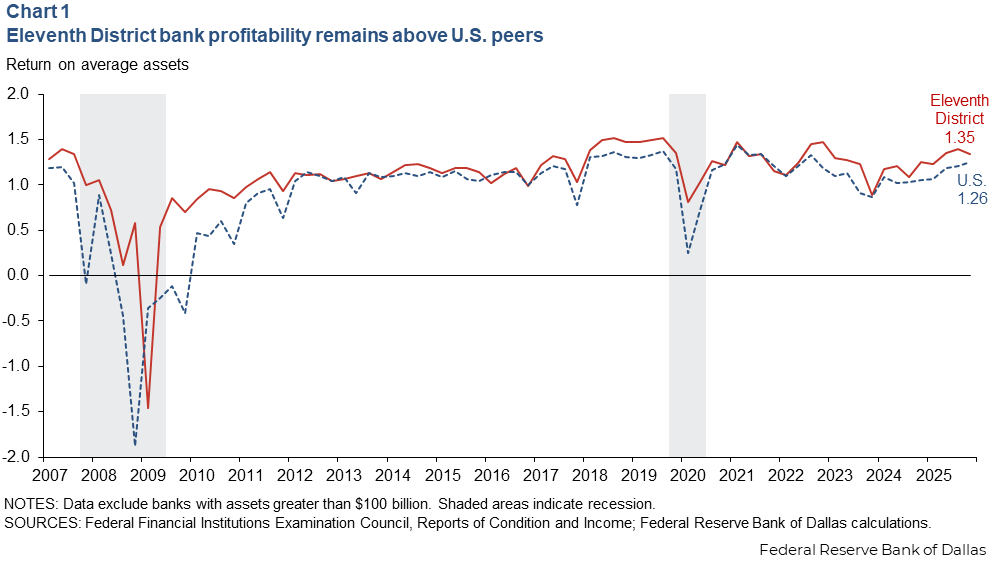
Lower provisioning expense for anticipated troubled loans among Eleventh District banks remained a key driver of performance over their U.S. peers, owing to generally better local credit conditions and favorable noncurrent loan ratios regionally (reflecting loans 90 days or more overdue).
Eleventh District banks’ net interest income (the difference between interest income and interest expense) improved from 3.18 percent to 3.42 percent of average assets year over year, while noninterest income remained above U.S. peers in 2025 (Chart 2).
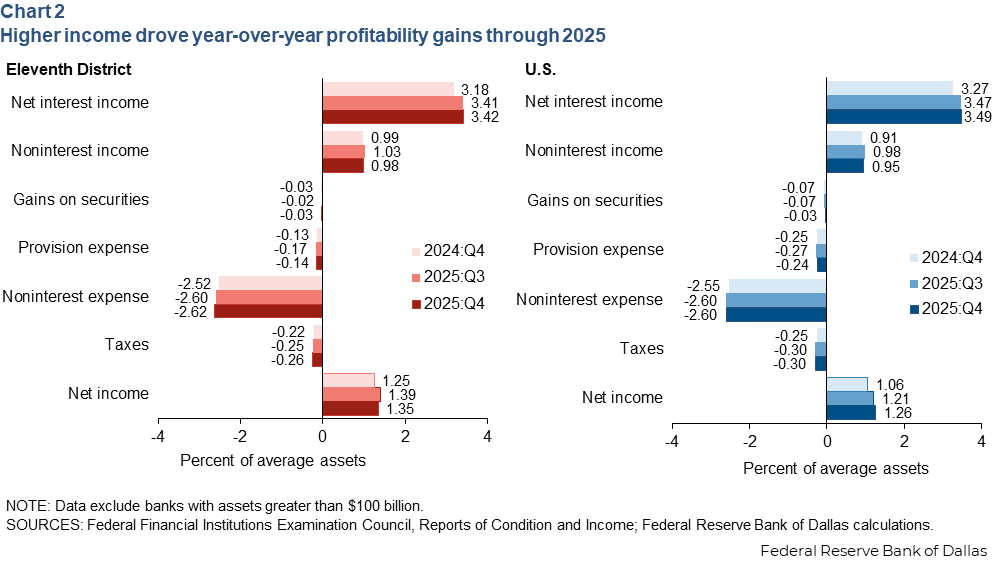
Eleventh District banks provisioned less for future loan losses than banks nationally, reflecting district loan performance and less exposure to consumer lending, such as credit cards and auto loans, which earn more interest but carry a higher risk of default.
Interest expenses also fell substantially across the district, while interest income remained relatively flat due to tightened credit standards and lower loan pricing in 2025 (Chart 3).
District banks’ noninterest income—largely from fees and commissions—remained strong at 0.98 percent of average assets, slightly above the U.S. average of 0.95 percent. However, noninterest expenses—wages, advertising and other overhead—rose by 0.1 percent of average assets among Eleventh District banks.
Net interest margins (net interest income divided by earning assets) grew more slowly across the district than nationally in 2025 (Chart 4).
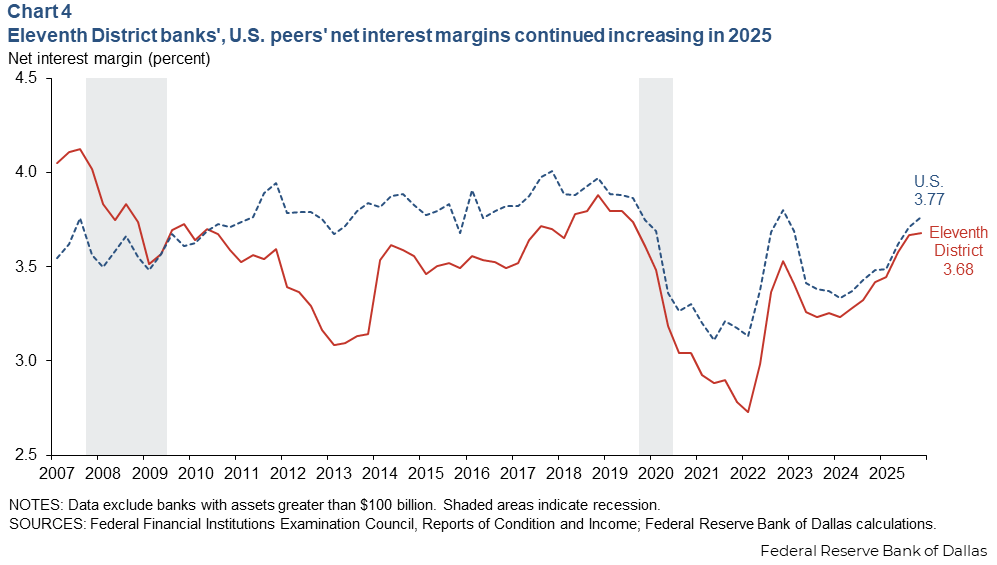
While banks could generally lower their interest expense by cutting deposit rates to reflect Fed rate reductions, Eleventh District banks also reduced their loan interest rates more than U.S. banks generally. That tended to compress net interest income. However, the gap between district banks and their counterparts nationally narrowed overall in 2025, and Eleventh District banks’ fourth quarter net interest margin was at its highest level since 2019.
Balance sheet mix shifts toward loans and deposits
Loans increased by 4.1 percent, while securities holdings declined 1.6 percent among district banks in 2025. On net, they boosted their net interest income by changing their mix of earning assets without growing overall earning assets very much. On the funding side of the balance sheet, deposits increased by 4.2 percent, while wholesale funds declined by 19.1 percent (Table 1). Eleventh District banks’ balance sheet mix shifted toward loans and deposits as the growth rates of both slightly outpaced prior year growth rates of 3.1 percent for loans and 3.2 percent for deposits.
| Change, Dec. 31, 2024-Dec. 31,2025 | ||||
| Eleventh District banks | U.S. banks | |||
| $ billions | Percent | $ billions | Percent | |
| Total assets | 17.8 | 2.8 | 288.7 | 4.1 |
| Loans | 15.3 | 4.1 | 231.3 | 4.8 |
| Securities | -2.6 | -1.6 | 32.1 | 2.4 |
| Cash | -0.1 | -0.9 | 1.1 | 1.6 |
| Other assets | 5.2 | 5.4 | 24.2 | 2.8 |
| Liabilities | 11.2 | 2.0 | 215.2 | 3.4 |
| Deposits | 21.6 | 4.2 | 259.1 | 4.8 |
| Wholesale funds | -9.0 | -19.1 | -43.4 | -5.7 |
| Other liabilities | -1.4 | -11.6 | -0.6 | -0.4 |
| Equity capital | 6.6 | 9.9 | 73.6 | 9.7 |
| NOTES: Data are for a merger-adjusted panel of commercial banks with total assets less than $100 billion. The difference from 2024 to 2025 is shown in both dollars and percent change for Eleventh District and U.S. banks. Other assets for a bank may include premises, accrued income, tax assets, equity investments without readily determinable fair values or intangible assets such as goodwill. Wholesale funding refers to bank liabilities that are quick to arrange but are less stable than core deposits, such as federal funds, Federal Home Loan Bank advances and brokered deposits. Other liabilities for a bank may include accrued expenses, allowances for off-balance-sheet exposures, deferred tax liabilities or other borrowed money such as mortgages on premises owned by the bank. Equity capital equals total assets minus liabilities. SOURCE: Federal Financial Institutions Examination Council, Reports of Condition and Income. |
||||
Nationally, banks grew their balance sheets more than district banks, shifting toward both higher-earning assets and cheaper deposit funding. U.S. banks increased their loans by $231.3 billion (4.8 percent) in 2025, while growing securities by $32.1 billion (2.4 percent). On the funding side, they increased deposits by $259.1 billion (4.8 percent) for the year and reduced wholesale borrowing by $43.4 billion (5.7 percent).
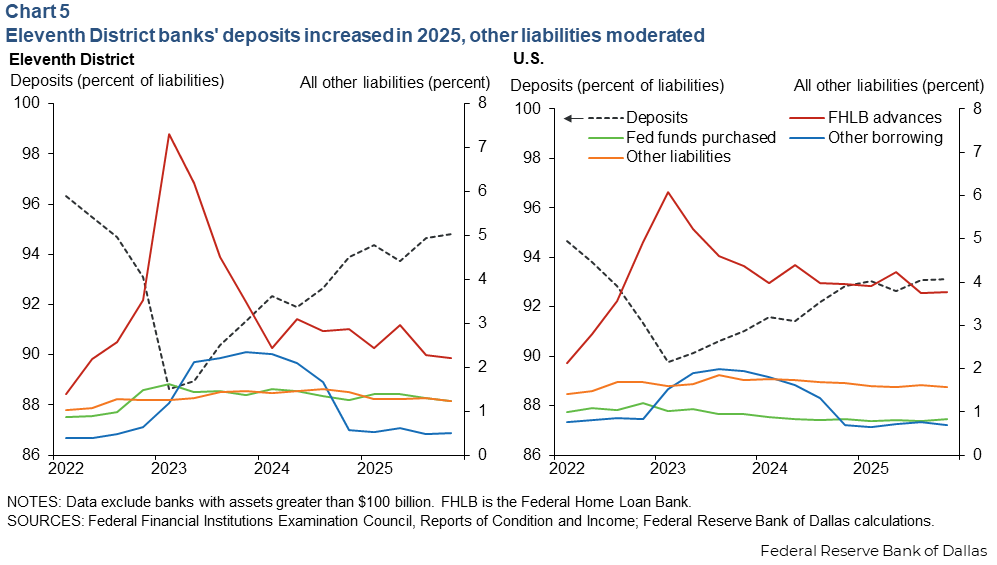
Funding, in general, refers to how banks raise capital to operate, manage liquidity and make loans, primarily through customer deposits and borrowing. Banks can access wholesale funding sources, such as federal funds, Federal Home Loan Bank advances and brokered deposits, as they are quick to arrange, though considered less stable, and usually more expensive than core deposits.
Banks’ share of deposits relative to all liabilities kept growing. All other liabilities, such as wholesale funding and other liabilities, however, slowed in 2025. The growth of Eleventh District banks’ deposits to liabilities ratio surpassed the U.S. banks’ growth year-over-year (Chart 5).
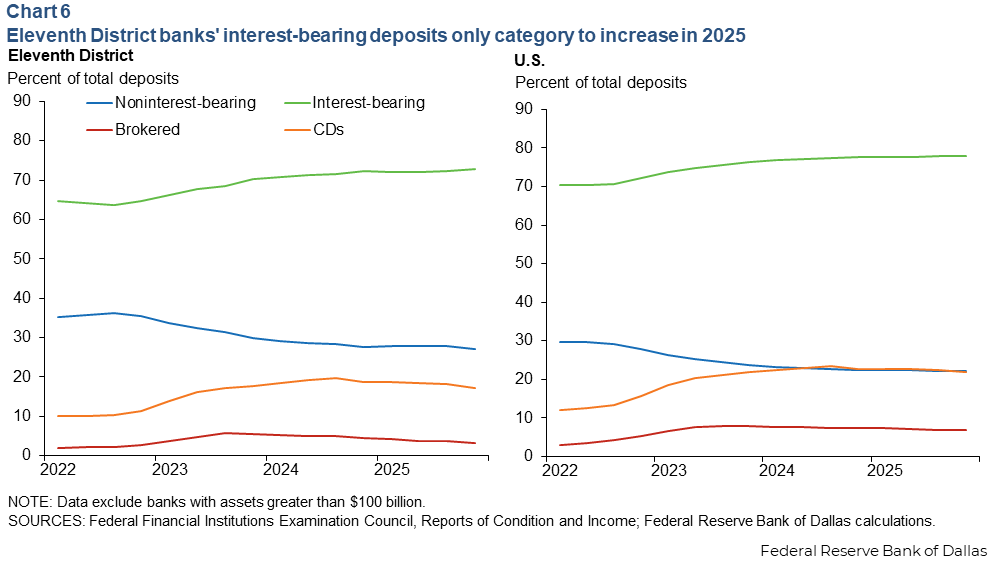
The share of interest-bearing deposits, such as savings accounts and money market accounts, continued to rise on average by 0.8 percent for Eleventh District banks and 0.6 percent for all U.S. banks in 2025 (Chart 6). On the other hand, the remainder of the items in banks’ deposit mix—such as CDs, noninterest-bearing deposits and brokered deposits— declined slightly.
Loan and credit conditions remain strong, stable
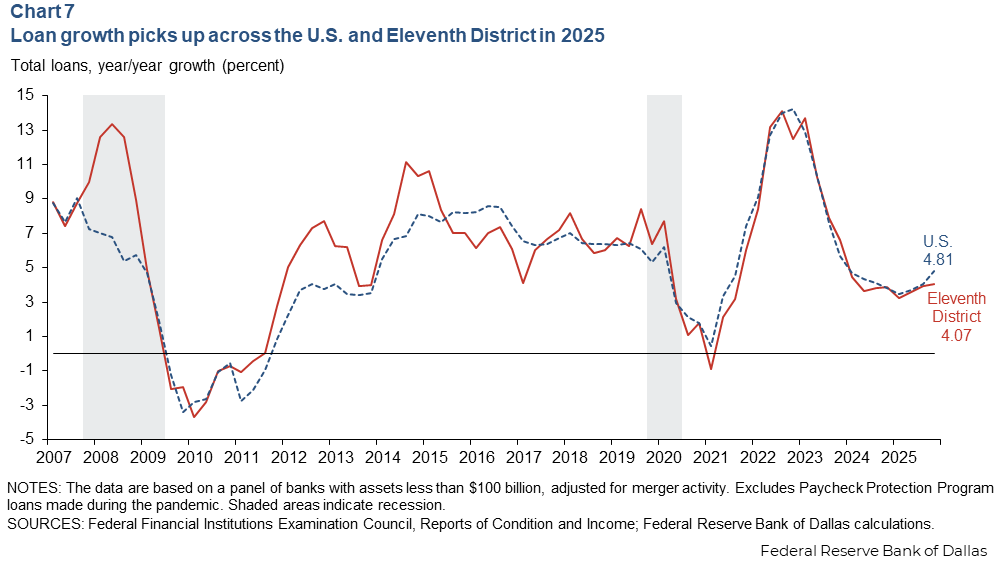
Loan growth reached 4.07 percent in the district and 4.81 percent nationally in 2025 (Chart 7). While an improvement from 2024, loan growth remains below its average prepandemic trend.
Loan growth within the district was concentrated in residential real estate (up 4.1 percent) and commercial real estate (up 3.4 percent) (Chart 8).
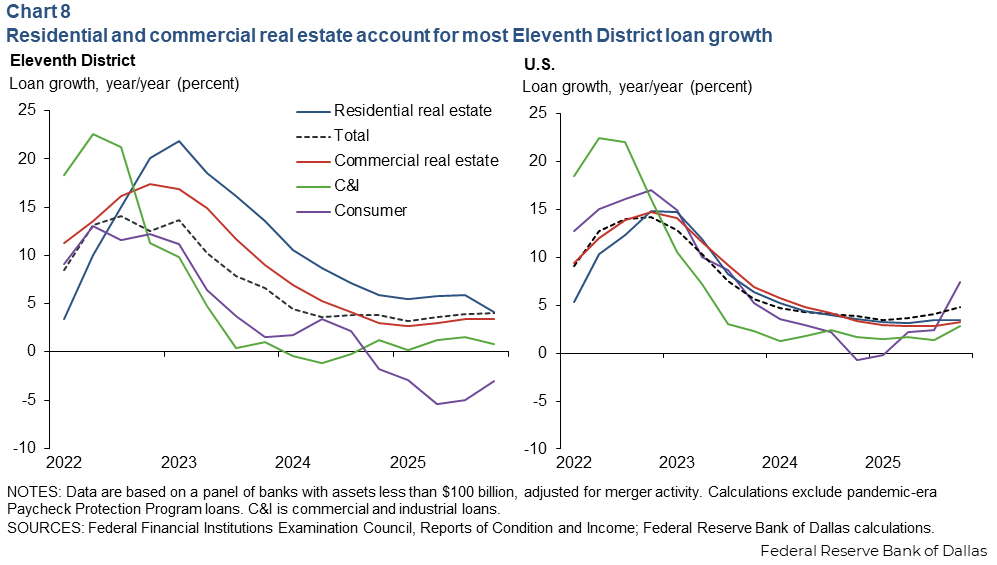
Domestic and international in-migration to Texas helped state job growth surpass national levels and support lending, despite tightening immigration policies since mid-2024. In 2025, district banks experienced sluggish growth across consumer and commercial and industrial loan portfolios.
Overall, bank loan growth has slowed across the district and the country since 2023, primarily because of higher interest rates, reduced loan demand and tightened lending standards to manage liquidity and credit risks. The trend was especially notable for commercial and industrial, commercial real estate and residential real estate loans. Bankers noted in the Dallas Fed’s Banking Conditions Surveys during 2025 that tightening credit standards and an uncertain economic outlook caused some businesses to postpone or delay projects.
Bank lending to nonbank financial institutions has rapidly grown since 2010 following the Global Financial Crisis. These entities—mortgage companies, pension funds, hedge funds, credit unions and insurance companies—provide financial services without a banking license. Credit quality concerns have arisen following bankruptcies, fraud allegations and lack of transparency. A Federal Reserve Bank of Dallas report found that the district banks held fewer loans to these nonbanks than their national peers, with modest loan growth since 2021.
District loan quality remains strong
Loan performance weakened slightly in 2025 though it remained strong overall. Noncurrent loans were below prepandemic levels. However, the rate of banks’ noncurrent loans (to total loans) signals emerging pressure. It increased from 0.74 percent to 0.80 percent year over year in the Eleventh District and from 0.84 percent to 0.96 percent nationally (Chart 9). Overall, loan performance in the district is better than in the nation, mostly because of the lower noncurrent rates in consumer loans and residential real estate loans.
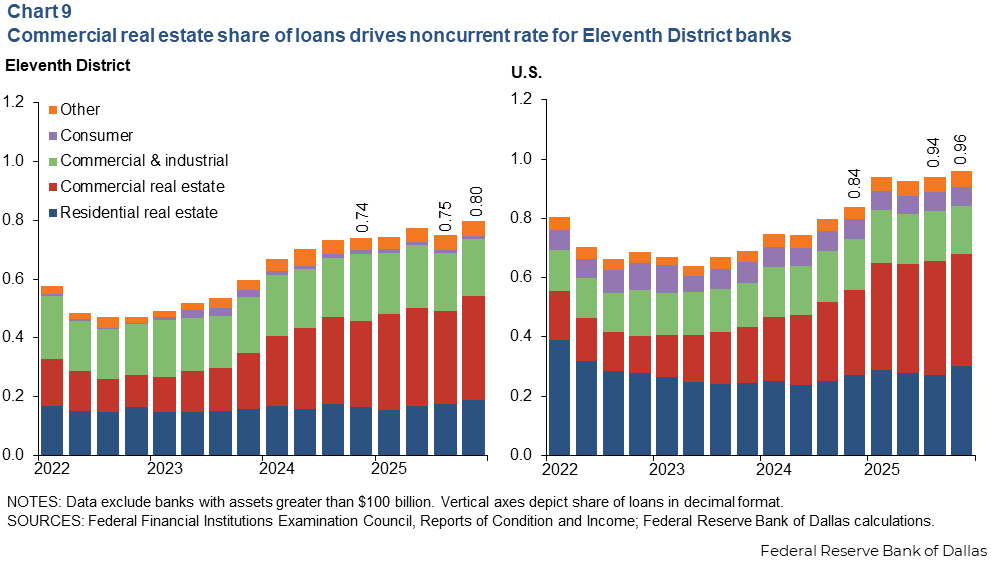
Commercial real estate loans were the main category deteriorating across the district, as the noncurrent loan rate increased from 0.29 percent to 0.35 percent year over year in 2025.
While commercial real estate delinquencies are near historic lows in the district, other risks remain. Commercial property price growth in the U.S. slowed for every category except suburban office, with downtown office and retail experiencing price contraction, according to MSCI’s Real Capital Analytics.
Multifamily real estate struggled in the district, with vacancy rates rising and rents declining, according to CBRE, a commercial real estate services and investment company. Similarly, respondents to the latest Banking Conditions Survey in March expect slightly tighter credit terms and standards for multifamily lending over the next three months relative to the prior survey.
District bankers in the March survey reported slight declines in general business activity with a less optimistic outlook than during the prior survey in February. Banks continued to expect growing loan demand through third quarter but worsening loan performance.
Equity capital improves
District banks held more capital, strengthening their balance sheets in 2025. This improvement appears in the adjusted tangible common equity ratio, a measure of a bank’s capital buffer under fluctuating interest rates that could prompt unrealized losses associated with hold-to-maturity securities (generally fixed-income instruments). The ratio rose from 8.2 percent to 9.4 percent year over year for district banks in 2025, approaching prepandemic levels (Chart 10).
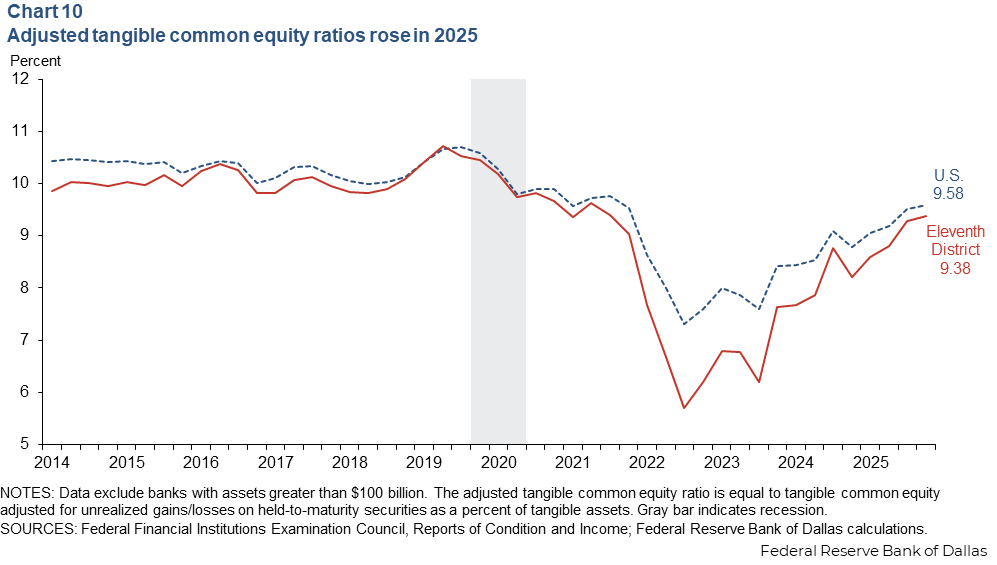
The recent advances follow weakness attributable to rising expected loan losses due to the pandemic, increased lending during the rapid economic recovery in the postpandemic period and unrealized losses on banks’ securities after the Federal Reserve rapidly raised rates to combat inflation in 2022.
Ratio improvements suggest declining unrealized losses in available-for-sale securities, which were aided by a downward shift in the yield curve as the Fed policy rate declined. Additionally, the gap between national and district bank capital ratios is narrowing.
District banks must navigate a changing environment in 2026
District banks retained profitability as well as loan, deposit and capital growth in 2025. While they expect loan demand and business activity to continue this year, they confront changing interest rate, labor market, regulatory and geopolitical environments.
Migration and population growth have sharply slowed in Texas, while job growth has flattened. Higher productivity per worker, slower immigration and a more cautious stance in hiring due to policy uncertainty are contributing to a low-hire, low-fire labor market. High oil prices resulting from the recent elevated geopolitical uncertainty are expected to boost Eleventh District economic activity only if they are sustained.
As the energy sector is a driver of the Eleventh District’s economy, fluctuations in oil prices may impact the area’s banks. Rising oil prices may prompt more drilling activities and provide regional economic gains, but the effects will be felt unevenly among energy producers and consumers who borrow from district banks.
Contemplated changes to the national regulatory environment for banks could increase competition, reduce barriers to entry, shorten wait times for mergers or corporate restructurings, or offer new opportunities for innovation in financial products and services. Eleventh District banks, benefitting from steady profits, strong credit conditions and improving bank capital levels, are well positioned to compete in this changing environment.
About the authors

Kristof Csaky is a risk specialist at the Federal Reserve Bank of Dallas.

JR Garcia is a data scientist in the supervisory risk, policy and surveillance division of the Banking Supervision Department at the Federal Reserve Bank of Dallas.

Ozge Ozden is a senior research economist at the Federal Reserve Bank of Dallas.