
Whose wages are falling behind the least amid surging inflation?
The recent inflation surge has increased the share of workers whose wages have not kept pace with rising prices. However, this outcome has not been consistent across different groups of workers.
We explore how the sharp rise in inflation has differentially impacted individuals by wage level, education and age. Our main finding is that lower-earning, less-educated and younger workers have fared relatively better in terms of their wages keeping pace with inflation. Note that many workers will share more than one of these traits.
In a previous article, we showed that for a majority of workers, wages didn’t increase as fast as inflation in the 12 months ended in second quarter 2022. These workers experienced negative real (inflation-adjusted) wage growth. Here, we dig deeper into this finding to see how outcomes may have differed across groups of workers.
Taking a closer look at inflation, pandemic changes
We use Current Population Survey data where we can measure individual wage growth over the prior 12 months. However, the data are limited in some aspects. We cannot follow individuals who move residences over the period, and we cannot follow individuals for periods longer than a year. So the mix of people surveyed constantly changes. Individuals who work by the hour report their wages. For those who are salaried, we impute wages from their reported earnings and hours. The most recent data allow us to calculate wage growth for second quarter 2022.
We compare outcomes for the 12 months ended in first quarter 2020, just before the pandemic began to rage, with outcomes as of second quarter 2022. Between these two periods, annual Consumer Price Index (CPI) inflation increased from below 2 percent to 9 percent. We examine the extent to which wage growth for different groups of workers kept pace with this rapid pickup in inflation.
For each of the periods, we take a worker’s wage 12 months earlier and identify to which quartile (groups consisting of 25 percent of the total) of the wage distribution the wage belongs—1=lowest paid to 4=highest paid. We group workers by their wage quartile and compute for each the fraction whose wage growth fell below the inflation rate as measured by CPI-U (the measure of all urban consumers). We compare these four wage-level groups in the two time periods.
In the results shown in Chart 1, two things stand out. First, in both periods, the fraction of workers experiencing negative real wage growth increases as you move from individuals in low- to high-wage jobs. Pre-COVID, more than half of workers in the two highest wage groups experienced negative real wage growth. In contrast, only 31 percent of workers in the lowest wage group experienced negative real wage growth.
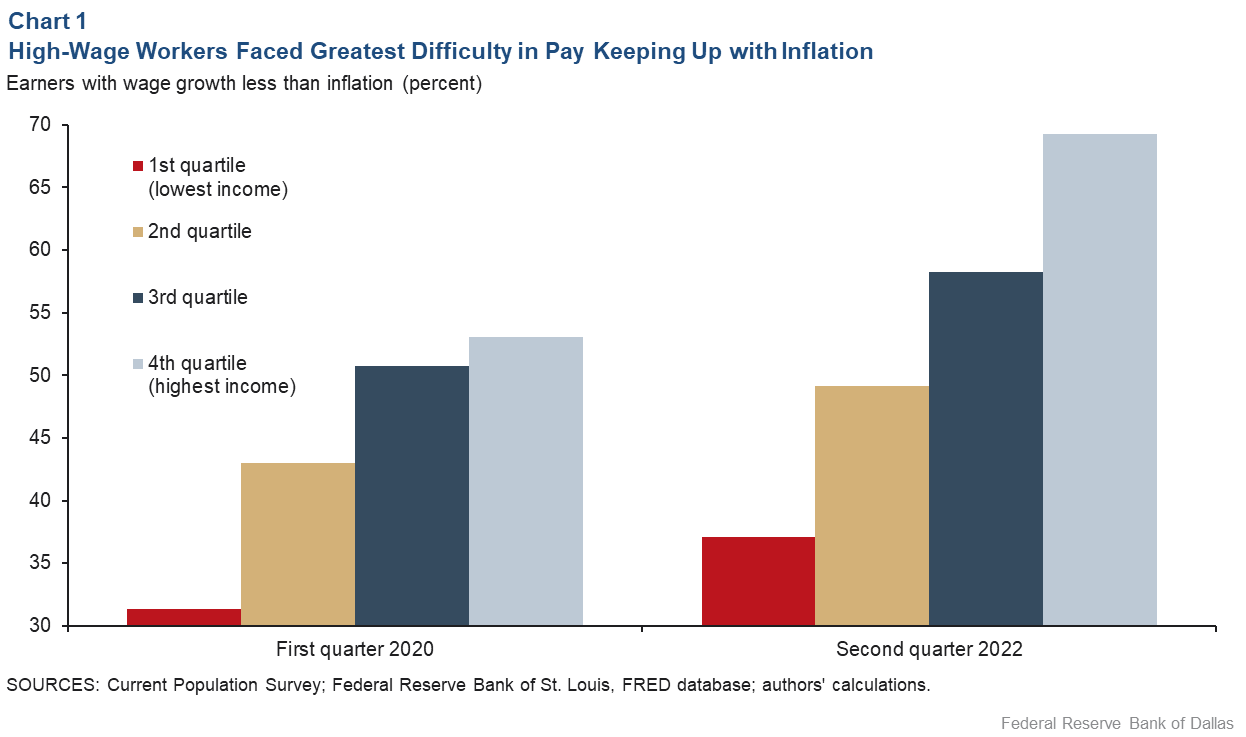
Second, as inflation moved higher, the percentage of workers in each wage group experiencing real wage declines increased. However, these declines were particularly notable among high-wage workers. The highest wage group encountered more than a 16 percentage-point increase in the prevalence of negative real wage growth, while the lowest wage group had less than a 6 percentage-point increase.
Inflation poses challenge to college-educated wage growth
We next examine how workers fared with higher inflation broken down by education level. We separate workers into four education groups: less than high school, high school, some college and college or more. Pre-COVID-19, all four education groups showed roughly similar percentages of workers with negative real wage growth (Chart 2).
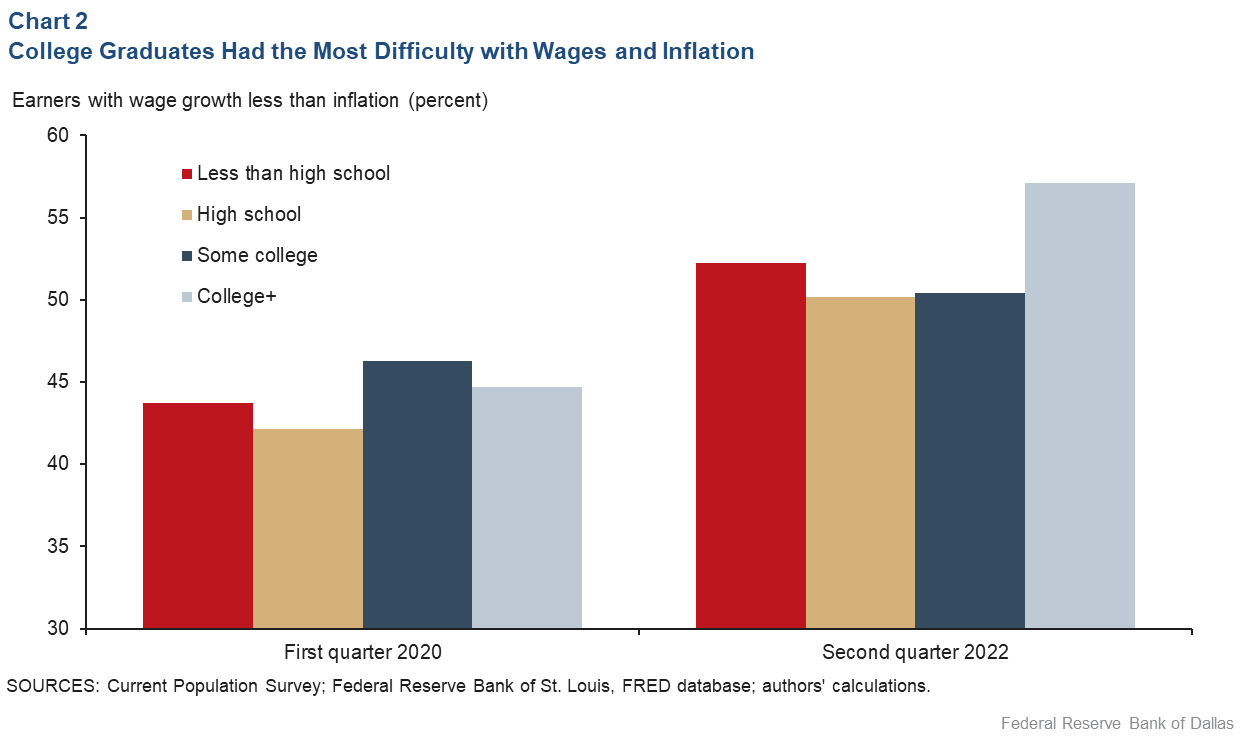
Post-COVID-19, all four education groups saw a rise in the percentage of workers experiencing real wage declines. However, workers with a college degree or more had the highest incidence of real wage declines at 57 percent, while the other three education groups rose to roughly 50 to 52 percent.
Older workers struggle to keep up
Finally, we explore how real wage declines over the past two years have varied by worker age. We separate individuals into four age groups, each with roughly a quarter of overall workers (Chart 3).
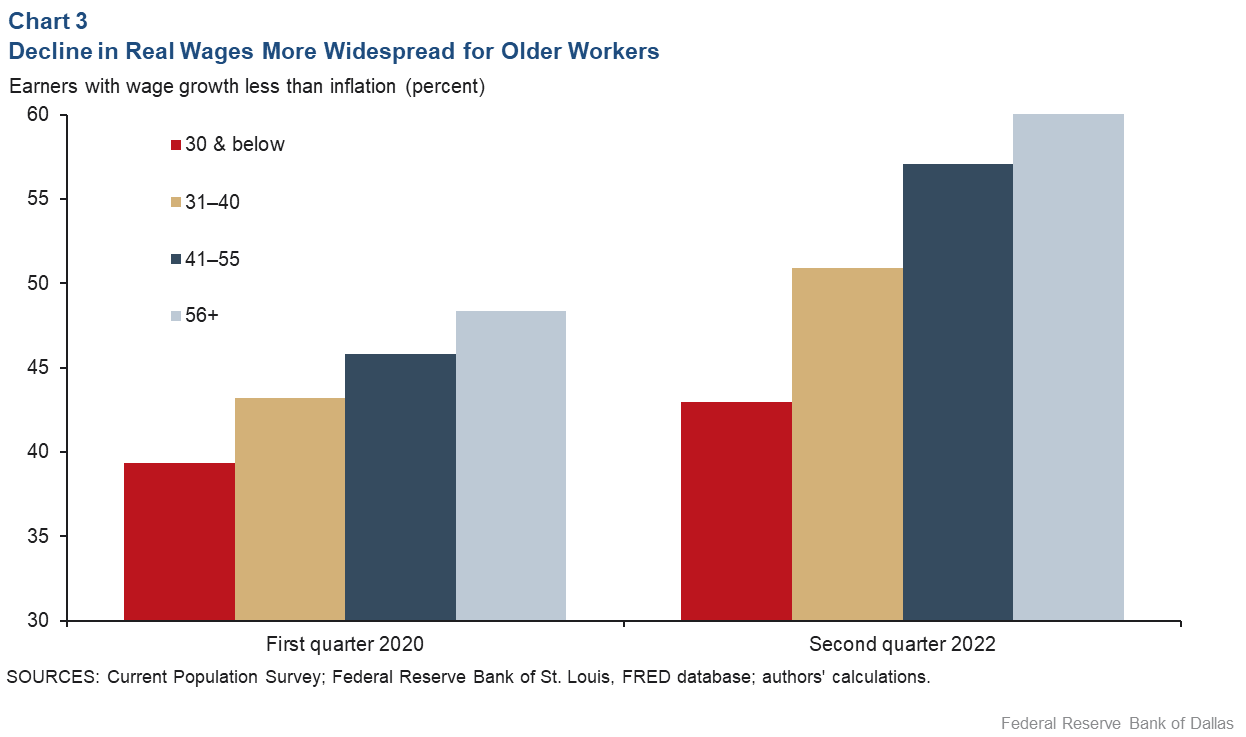
The data show that before COVID-19, the percentage of workers with negative real wage growth increased with age. Around 39 percent of individuals 30 years or younger had negative real wage growth in first quarter 2020, while around 48 percent of workers 56 or older were similarly affected.
Looking at second quarter 2022 data, we see that while the percentage increased for all age groups, the magnitude of the increase was larger for workers over age 40—the 41–55 and 56-plus age groups together experienced an average 11.5 percentage-point rise. In contrast, workers age 30 or under had only a 3.6 percentage-point increase.
The rapid surge in inflation starting in spring 2021 resulted in a majority of employed workers experiencing negative real wage growth in second quarter 2022, but differences emerged by worker group.
All groups experienced a higher percentage of negative real wage growth post-COVID-19. However, lower-wage, non-college-educated and younger employed workers displayed both smaller shares of negative real wage growth pre-COVID-19 and relatively smaller increases over the subsequent two years.
About the Authors

Robert Rich
Rich is a senior economic and policy advisor in the Research Department at the Federal Reserve Bank of Cleveland.

Joseph Tracy
Tracy is a former executive vice president and senior advisor in the Research Department at the Federal Reserve Bank of Dallas.
Mason Krohn
Krohn is a former intern in the Research Department at the Federal Reserve Bank of Dallas.
The views expressed are those of the authors and should not be attributed to the Federal Reserve Bank of Dallas or the Federal Reserve System.


